. 2022 Nov 21;377(1864):20210331.
doi: 10.1098/rstb.2021.0331. Epub 2022 Oct 3.

Serial block face scanning electron microscopy reveals region-dependent remodelling of transverse tubules post-myocardial infarction

Affiliations

Serial block face scanning electron microscopy reveals region-dependent remodelling of transverse tubules post-myocardial infarction

Tharushi Perera et al. Philos Trans R Soc Lond B Biol Sci. .

Abstract

The highly organized transverse tubule (t-tubule) network facilitates cardiac excitation-contraction coupling and synchronous cardiac myocyte contraction. In cardiac failure secondary to myocardial infarction (MI), changes in the structure and organization of t-tubules result in impaired cardiac contractility. However, there is still little knowledge on the regional variation of t-tubule remodelling in cardiac failure post-MI. Here, we investigate post-MI t-tubule remodelling in infarct border and remote regions, using serial block face scanning electron microscopy (SBF-SEM) applied to a translationally relevant sheep ischaemia reperfusion MI model and matched controls. We performed minimally invasive coronary angioplasty of the left anterior descending artery, followed by reperfusion after 90 min to establish the MI model. Left ventricular tissues obtained from control and MI hearts eight weeks post-MI were imaged using SBF-SEM. Image analysis generated three-dimensional reconstructions of the t-tubular network in control, MI border and remote regions. Quantitative analysis revealed that the MI border region was characterized by t-tubule depletion and fragmentation, dilation of surviving t-tubules and t-tubule elongation. This study highlights region-dependent remodelling of the tubular network post-MI and may provide novel localized therapeutic targets aimed at preservation or restoration of the t-tubules to manage cardiac contractility post-MI. This article is part of the theme issue 'The cardiomyocyte: new revelations on the interplay between architecture and function in growth, health, and disease'.

Keywords: cardiomyocyte; myocardial infarction; remodelling; three-dimensional electron microscopy; transverse tubules.


Figures

Figure 1.
Figure 1.
Reduction in LVEF from baseline to eight weeks post-MI. Mean LVEF eight weeks post-MI (52 ± 2%) is reduced by 16 ± 4% when compared with baseline mean LVEF (68 ± 2%). Paired t-test, p = 0.029, GraphPad Prism 8.4.3.
Figure 2.
Figure 2.
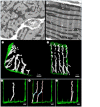
SBF-SEM images and 3D reconstructions of the t-tubular network in healthy sheep cardiac myocytes. (a,b), SBF-SEM images illustrating key features in control cardiac myocytes, cut in transverse (a) and longitudinal (b) sections. t-Tubules are indicated by white arrows. M: mitochondria; mf: myofilaments. (c) 3D reconstruction of the t-tubular network in a control cardiac myocyte in transverse view, where t-tubules (white) adopt a radial orientation extending from the sarcolemma (green) to the cell centre. (d) 3D reconstruction of the t-tubular network in a healthy cardiac myocyte in longitudinal view, displaying an ordered arrangement of t-tubules (white) arranged perpendicular to the sarcolemma (horizontal green regions at the top and bottom) and regularly along z-lines. Vertical green lines are present to delimit the region. (e) Focus on a single t-tubule showing dilations and narrowings along its length. (f) Focus on a pair of t-tubules showing a longitudinal arrangement (blue dashed lines) at the crossover between z-lines (red dashed lines). (g) Focus on twin tubules projecting from the same region on either sides of the z-line (red dashed line). (ad) scale bars: 2 µm; (eg) scale bars: 1 µm.
Figure 3.
Figure 3.
Comparison of t-tubule morphology between control, MI remote and border groups. (ah) Comparison of t-tubule morphological features between control (green), MI remote (yellow) and border (orange) regions, illustrating: (a) increment of t-tubule diameter in border region compared with control; (b) increment of t-tubule length as a fraction of the cell in border region compared with control; (c) changes to the t-tubule volume in the border region compared with control and remote region; (d) volume occupied by t-tubules in the three different regions as a fraction of the cell volume; (e) the depletion of t-tubules in border region compared with control; (f) increment of fragments in border region compared with control; (g) increment in mean fragment volume in border region compared with remote region; (h) increment of fragment volume as a fraction of cell volume in border region compared with control and remote region. p-values demonstrating significant differences (p < 0.05) between groups are indicated.
Figure 4.
Figure 4.
SBF-SEM images and 3D reconstructions of the t-tubular network in sheep border MI. (a) SBF-SEM image illustrating key features in a border region cell, in transverse section. t-Tubules are indicated by white arrows, and fragments by red arrows. M: mitochondria. (b) 3D reconstruction of the t-tubular network (white) in a border region cell in longitudinal view, displaying disorganization of t-tubules, t-tubule fragmentation (red) and regional t-tubule loss, indicated by a green ellipse. (c) 3D reconstruction of the t-tubular network (white) in a border region cell, in transverse view, illustrating extensive fragmentation (red). (d) 3D reconstruction of the border region cell shown in (c), with its fragments removed, displaying the underlying t-tubule network (white). Green ellipses indicate regions of t-tubule loss. (e) t-Tubules in light grey lined by the basement membrane indicated by black arrows. (f) Fragment in light grey preserving the basement membrane indicated by black arrow. (ad) Scale bars: 2 µm; (e,f) scale bars: 1 µm.
Figure 5.
Figure 5.
Regional involution of the tubular system from control to remote to border region MI region. (a) Control t-tubules (white) are regularly aligned along the z-lines (red dashed lines). (b) Remote region t-tubules (white) are aligned along the z-lines (red dashed lines) and present some longitudinal elements (green arrows). (c) Border region t-tubules (white) are irregularly aligned along the z-lines (red dashed lines) and are sparse and fragmented. (ac) Scale bars: 2 µm.

References

    1. Bers DM. 2002. Cardiac excitation–contraction coupling. Nature 415, 198-205. (10.1038/415198a) - DOI - PubMed
    1. Louch WE, Mork HK, Sexton J, Stromme TA, Laake P, Sjaastad I, Sejersted OM. 2006. T-tubule disorganization and reduced synchrony of Ca2+ release in murine cardiomyocytes following myocardial infarction. J. Physiol. 574, 519-533. (10.1113/jphysiol.2006.107227) - DOI - PMC - PubMed
    1. Crossman DJ, Ruygrok PN, Soeller C, Cannell MB. 2011. Changes in the organization of excitation-contraction coupling structures in failing human heart. PLoS ONE 6, e17901. (10.1371/journal.pone.0017901) - DOI - PMC - PubMed
    1. Cannell MB, Crossman DJ, Soeller C. 2006. Effect of changes in action potential spike configuration, junctional sarcoplasmic reticulum micro-architecture and altered t-tubule structure in human heart failure. J. Muscle Res. Cell Motil. 27, 297-306. (10.1007/s10974-006-9089-y) - DOI - PubMed
    1. Hong T, Shaw RM. 2017. Cardiac T-tubule microanatomy and function. Physiol. Rev. 97, 227-252. (10.1152/physrev.00037.2015) - DOI - PMC - PubMed

Publication types