. 2022 Dec;66(23):e2200443.
doi: 10.1002/mnfr.202200443. Epub 2022 Oct 26.

Grape Seed Proanthocyanidins Modulate the Hepatic Molecular Clock via MicroRNAs

Affiliations

Grape Seed Proanthocyanidins Modulate the Hepatic Molecular Clock via MicroRNAs

Francesca Manocchio et al. Mol Nutr Food Res. 2022 Dec.

Abstract

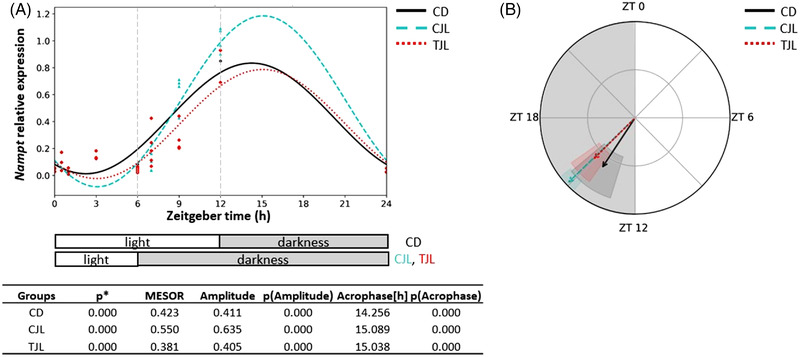
Scope: Circadian rhythm is an endogenous and self-sustained timing system, responsible for the coordination of daily processes in 24-h timescale. It is regulated by an endogenous molecular clock, which is sensitive to external cues as light and food. This study has previously shown that grape seed proanthocyanidins extract (GSPE) regulates the hepatic molecular clock. Moreover, GSPE is known to interact with some microRNAs (miRNAs). Therefore, the aim of this study is to evaluate if the activity of GSPE as modulator of hepatic clock genes can be mediated by miRNAs.

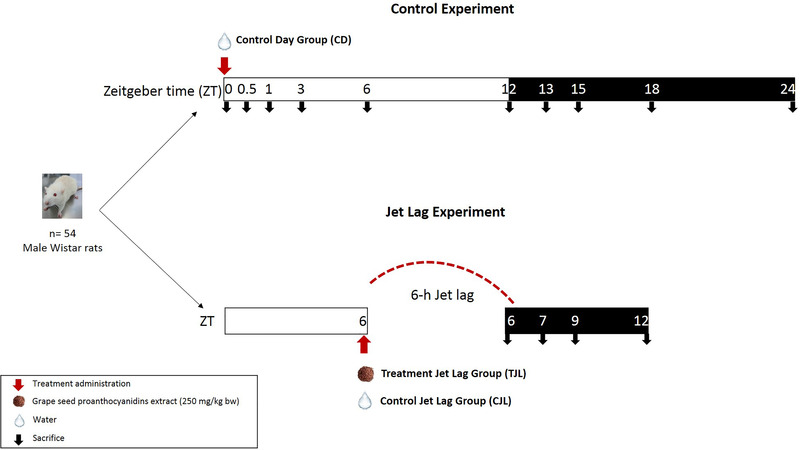
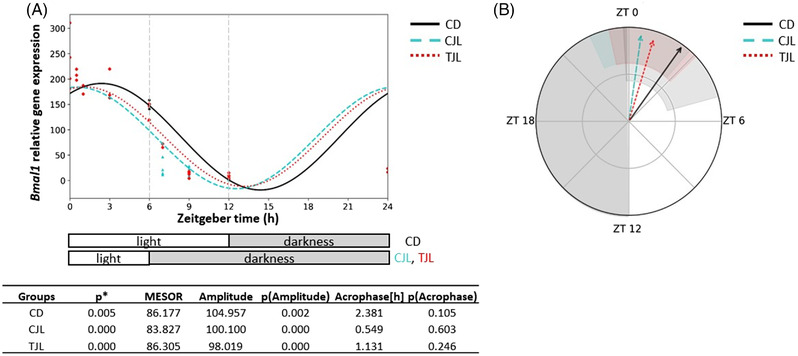
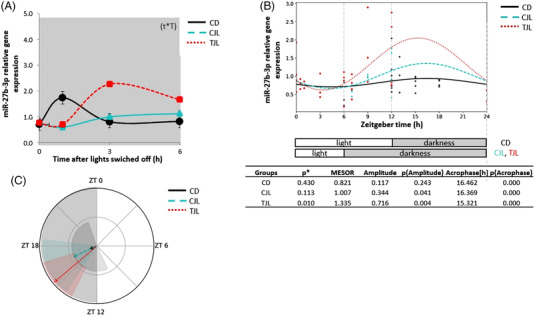
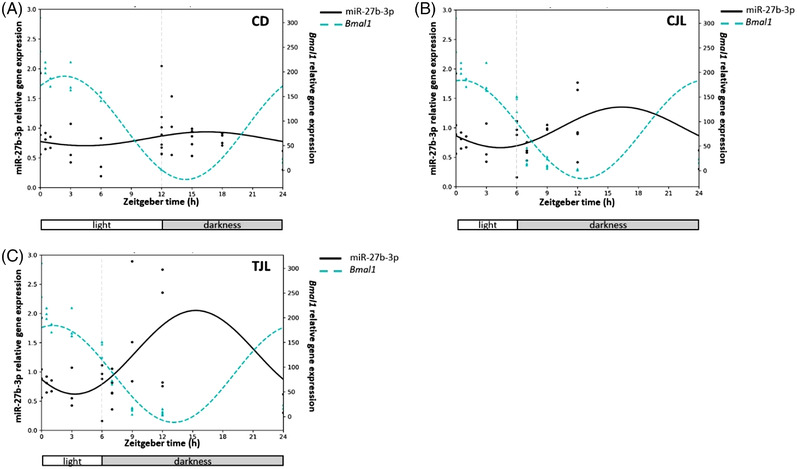
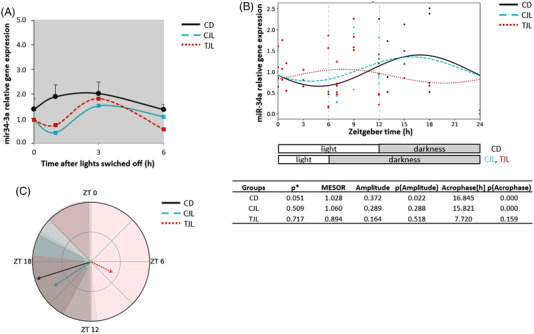
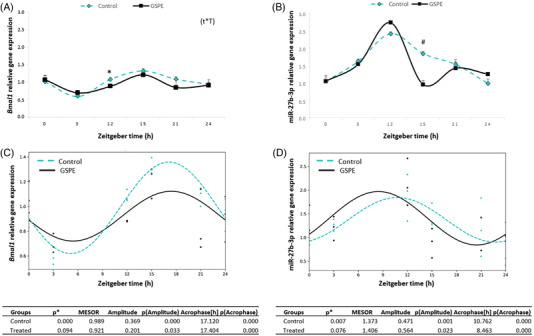
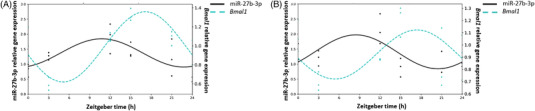
Methods and results: 250 mg kg-1 of GSPE is administered to Wistar rats before a 6-h jet lag and sacrificed at different time points. GSPE modulated both expression of Bmal1 and miR-27b-3p in the liver. Cosinor-based analysis reveals that both Bmal1 and miR-27b-3p expression follow a circadian rhythm, a negative interaction between them, and the role of GSPE adjusting the hepatic peripheral clock via miRNA. Additionally, in vitro studies show that Bmal1 is sensitive to GSPE (25 mg L-1 ). However, this effect is independent of miR-27b-3p.

Conclusion: miRNA regulation of peripheral clocks via GSPE may be part of a complex mechanism that involves the crosstalk with the central system rather than a direct effect.

Keywords: Cosinor-based rhythmometry; circadian rhythm; microRNA; peripheral molecular clock; polyphenols.


Conflict of interest statement

The authors declare no conflict of interest.

Figures

Figure 1
Figure 1
Experimental design used in the animal study.
Figure 2
Figure 2
Estimated circadian rhythm of hepatic Bmal1 expression of the three animal groups analyzed by Cosinor method. A) Estimated circadian rhythm and rhythmometric parameters. B) Representation of the acrophases and the amplitude of the estimated rhythm. Control day group (CD group): animals housed at 12 h light/dark cycle, administered water (ZT0) and sacrificed at ZT0, 0.5, 1, 3, 6, 12, 13, 15, 18, and 24 h; Control jet lag group (CJL group): animals housed at 12 h light/dark cycle, administered water at ZT6 and immediately moved to dark and sacrificed at ZT6, 7, 9, and 12. Treatment jet lag group (TJL group): animals housed at 12 h light/dark cycle, administered GSPE (250 mg kg−1 bw) at ZT6 and immediately moved to dark and sacrificed at ZT6, 7, 9, and 12. *p ≤ 0.05 indicates circadian rhythm. Acrophase: time at which the peak of a rhythm occurs ([h] hours); Amplitude: difference between the peak and the mean value of a wave; MESOR: a circadian rhythm‐adjusted mean. p < 0.05 indicates significant differences.
Figure 3
Figure 3
Relative gene expression of hepatic miR‐27b‐3 and estimated circadian rhythm of the hepatic miR‐27b‐3 expression of the three animal groups analyzed by Cosinor method. A) Relative gene expression of hepatic miR‐27b‐3 in the dark phase. B) Estimated circadian rhythm and rhythmometric parameters. C) Representation of the acrophases and the amplitude of the estimated rhythm. Control day group (CD group): animals housed at 12 h light/dark cycle, administered water (ZT0) and sacrificed at ZT0, 0.5, 1, 3, 6, 12, 13, 15, 18, and 24 h; Control jet lag group (CJL group): animals housed at 12 h light/dark cycle, administered water at ZT6 and immediately moved to dark and sacrificed at ZT6, 7, 9, and 12. Treatment jet lag group (TJL group): animals housed at 12 h light/dark cycle, administered GSPE (250 mg kg−1 bw) at ZT6 and immediately moved to dark and sacrificed at ZT6, 7, 9, and 12. *p ≤ 0.05 indicates circadian rhythm. Acrophase: time at which the peak of a rhythm occurs ([h]. hours); Amplitude: difference between the peak and the mean value of a wave; MESOR: a circadian rhythm‐adjusted mean. p < 0.05 shows significant differences. t × T indicates interaction between time and treatment (two‐way ANOVA).
Figure 4
Figure 4
Correlation of the estimated circadian rhythm of the hepatic Bmal1 and miR‐27b‐3 expression of CD A), CJL B), and TJL C) analyzed by Cosinor method. Control day group (CD group): animals housed at 12 h light/dark cycle, administered water (ZT0) and sacrificed at ZT0, 0.5, 1, 3, 6, 12, 13, 15, 18, and 24 h; Control jet lag group (CJL group): animals housed at 12 h light/dark cycle, administered water at ZT6 and immediately moved to dark and sacrificed at ZT6, 7, 9, and 12. Treatment jet lag group (TJL group): animals housed at 12 h light/dark cycle, administered GSPE (250 mg kg−1 bw) at ZT6 and immediately moved to dark and sacrificed at ZT6, 7, 9, and 12.
Figure 5
Figure 5
Estimated circadian rhythm of hepatic Nampt expression of the three animal groups analyzed by Cosinor method. A) Estimated circadian rhythm and rhythmometric parameters. B) Representation of the acrophases and the amplitude of the estimated rhythm. Control day group (CD group): animals housed at 12 h light/dark cycle, administered water (ZT0), and sacrificed at ZT0, 0.5, 1, 3, 6, 12, 13, 15, 18, and 24 h; Control jet lag group (CJL group): animals housed at 12 h light/dark cycle, administered water at ZT6 and immediately moved to dark and sacrificed at ZT6, 7, 9, and 12. Treatment jet lag group (TJL group): animals housed at 12 h light/dark cycle, administered GSPE (250 mg kg−1 bw) at ZT6 and immediately moved to dark and sacrificed at ZT6, 7, 9, and 12. *p ≤ 0.05 indicates circadian rhythm. Acrophase: time at which the peak of a rhythm occurs ([h]. hours); Amplitude: difference between the peak and the mean value of a wave; MESOR: a circadian rhythm‐adjusted mean. p < 0.05 indicates significant differences.
Figure 6
Figure 6
Relative gene expression of hepatic miR‐34a and estimated circadian rhythm of the hepatic miR‐34a expression of the three animal groups analyzed by Cosinor method. A) Relative gene expression of hepatic miR‐34a in the dark period. B) Estimated circadian rhythm and rhythmometric parameters. C) Representation of the acrophases and the amplitude of the estimated rhythm. Control day group (CD group): animals housed at 12 h light/dark cycle, administered water (ZT0) and sacrificed at ZT0, 0.5, 1, 3, 6, 12, 13, 15, 18, and 24 h; Control jet lag group (CJL group): animals housed at 12 h light/dark cycle, administered water at ZT6 and immediately moved to dark and sacrificed at ZT6, 7, 9, and 12. Treatment jet lag group (TJL group): animals housed at 12 h light/dark cycle, administered GSPE (250 mg kg−1 bw) at ZT6 and immediately moved to dark and sacrificed at ZT6, 7, 9, and 12. *p ≤ 0.05 indicates circadian rhythm. Acrophase: time at which the peak of a rhythm occurs ([h]. hours); Amplitude: difference between the peak and the mean value of a wave; MESOR: a circadian rhythm‐adjusted mean. p < 0.05 shows significant differences. t × T indicates interaction between time and treatment (two‐way ANOVA).
Figure 7
Figure 7
Relative gene expression of Bmal1 A) and miR‐34a B) obtained from HepG2 cells control and treated grape seed proanthocyanidins extract (GSPE; 25 mg L−1). Estimated circadian rhythm of the Bmal1 C) and miR‐34a D) expression of both cell groups and rhythmometric parameters. Acrophase: time at which the peak of a rhythm occurs ([h]. hours); Amplitude: difference between the peak and the mean value of a wave; MESOR: a circadian rhythm‐adjusted mean. p < 0.05 or * shows significant differences. # indicates tendency (p < 0.01). t × T indicates interaction between time and treatment (two‐way ANOVA).
Figure 8
Figure 8
Correlation of the estimated circadian rhythm of Bmal1 and miR‐27b‐3 expression of HepG2 cells control A) and treated with a grape seed proanthocyanidins extract at a dose of 25 mg L−1 B).

References

    1. Ribas‐Latre A., Eckel‐Mahan K., Mol. Metab. 2016, 5, 133. - PMC - PubMed
    1. Asher G., Sassone‐Corsi P., Cell 2015, 161, 84. - PubMed
    1. Koronowski K. B., Kinouchi K., Welz P., Baldi P., Benitah S. A., Sassone‐corsi P., Koronowski K. B., Kinouchi K., Welz P., Smith J. G., Zinna V. M., Shi J., Cell 2019, 177, 1448.e14.
    1. Ribas‐Latre A., Del Bas J. M., Baselga‐Escudero L., Casanova E., Arola‐Arnal A., Salvadó M. J., Bladé C., Arola L., J Funct Foods 2015, 13, 336. - PubMed
    1. Sahar S., Sassone‐Corsi P., Trends Endocrinol. Metab. 2012, 23, 1. - PMC - PubMed

Publication types