. 2022 Oct 3:11:e79128.
doi: 10.7554/eLife.79128.

S6K1 phosphorylates Cdk1 and MSH6 to regulate DNA repair

Affiliations

S6K1 phosphorylates Cdk1 and MSH6 to regulate DNA repair

Adi Amar-Schwartz et al. Elife. .

Abstract

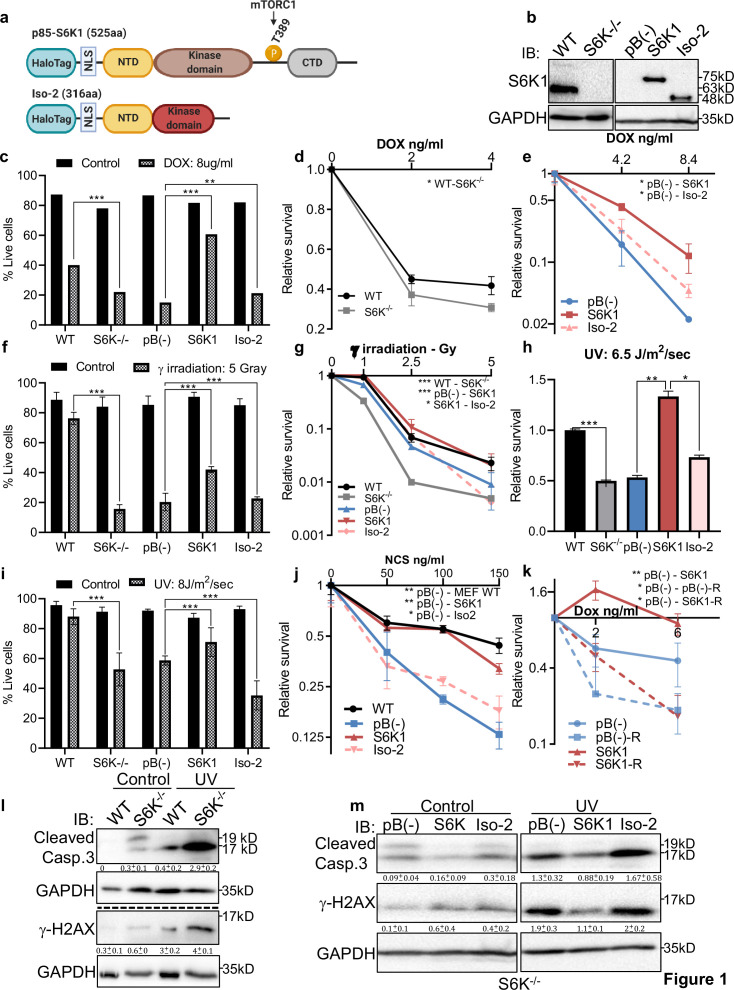
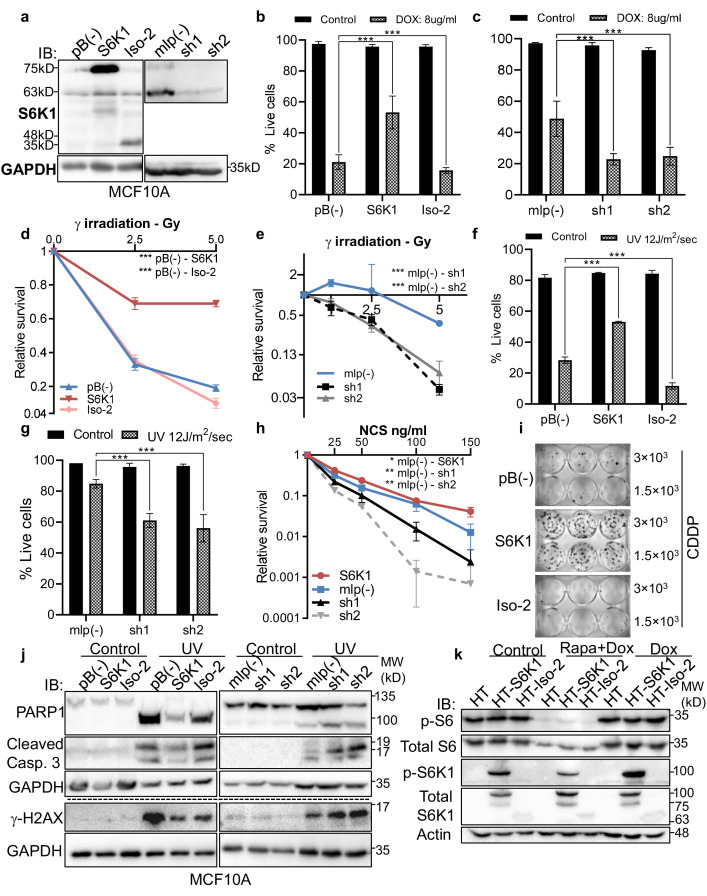
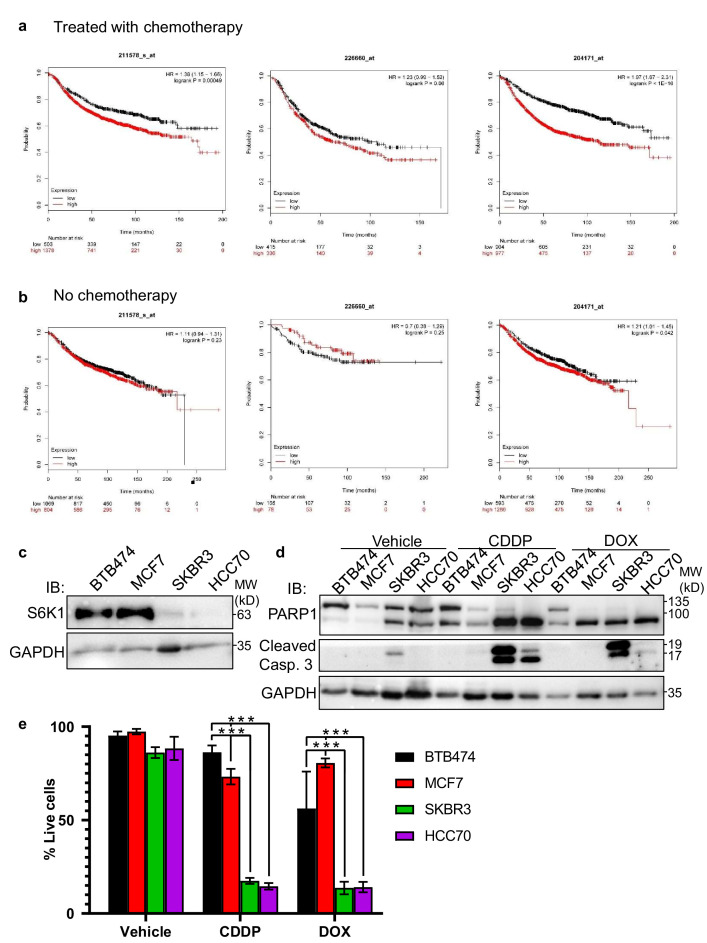
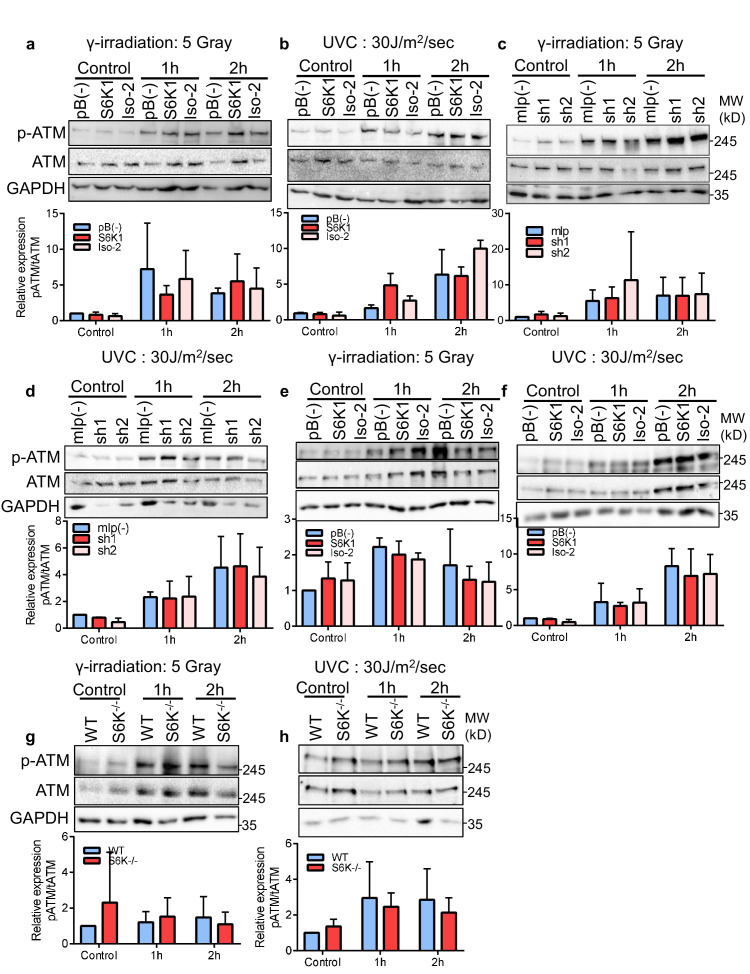
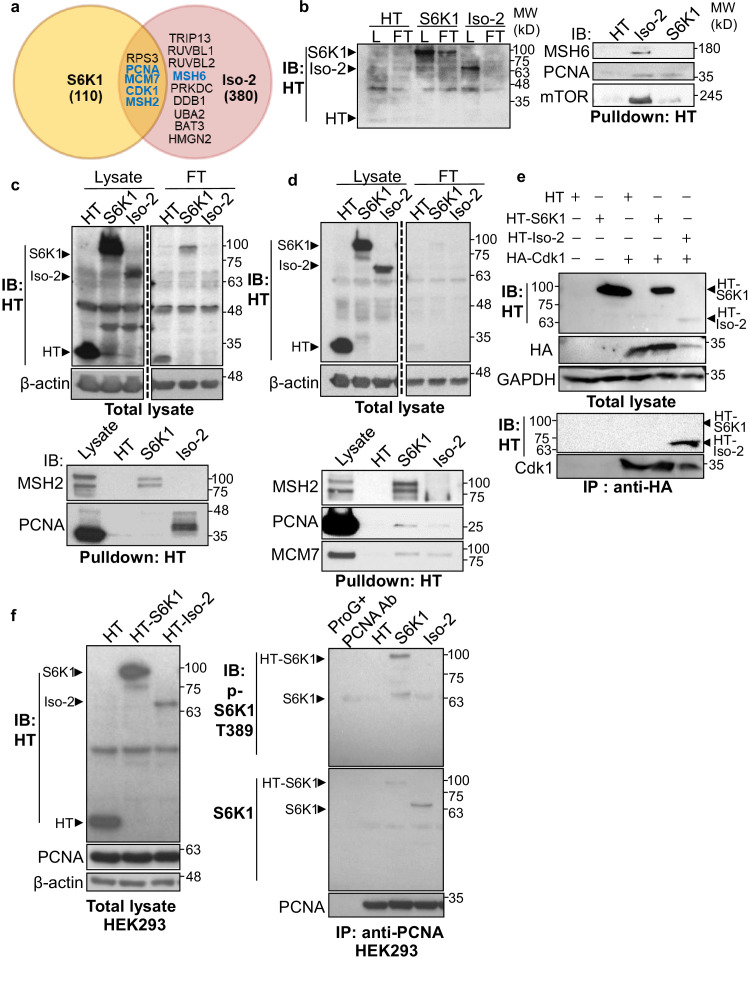
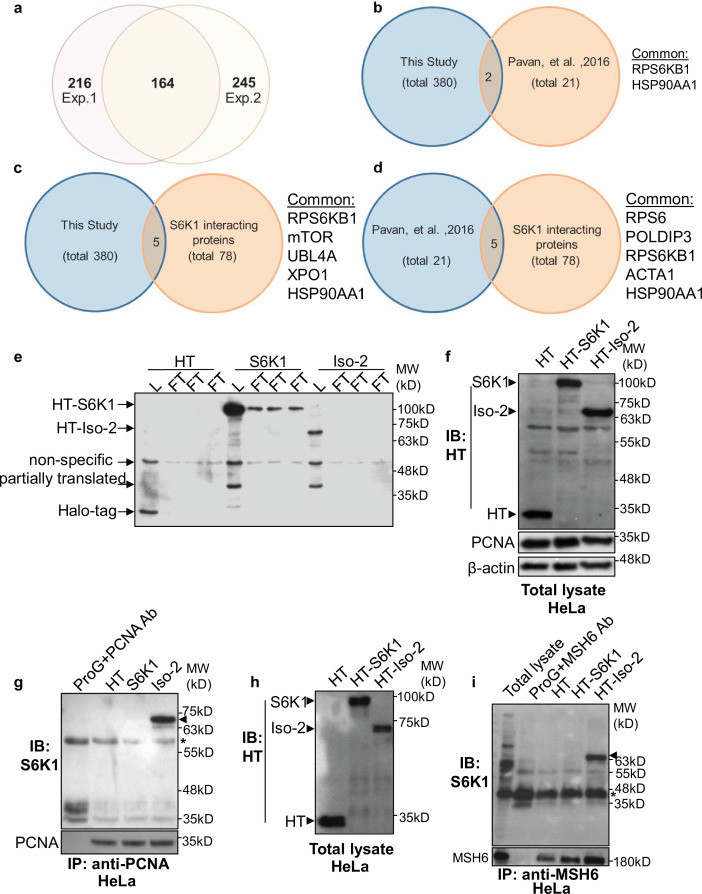
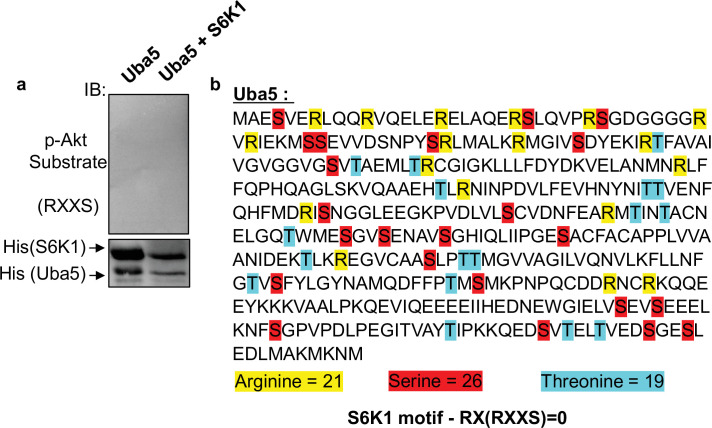
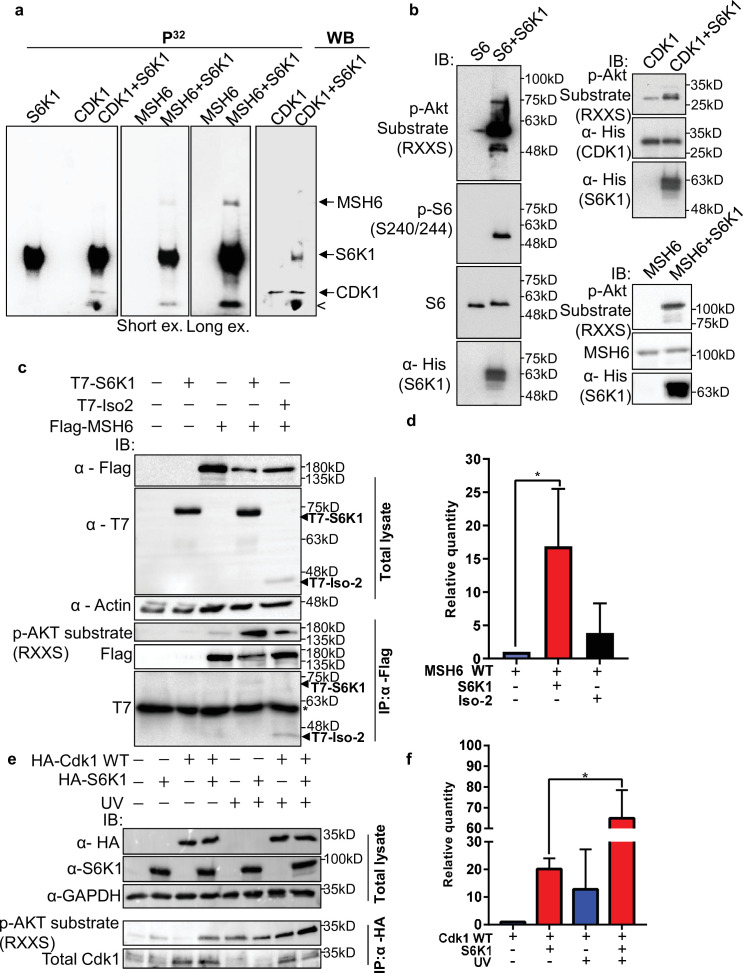
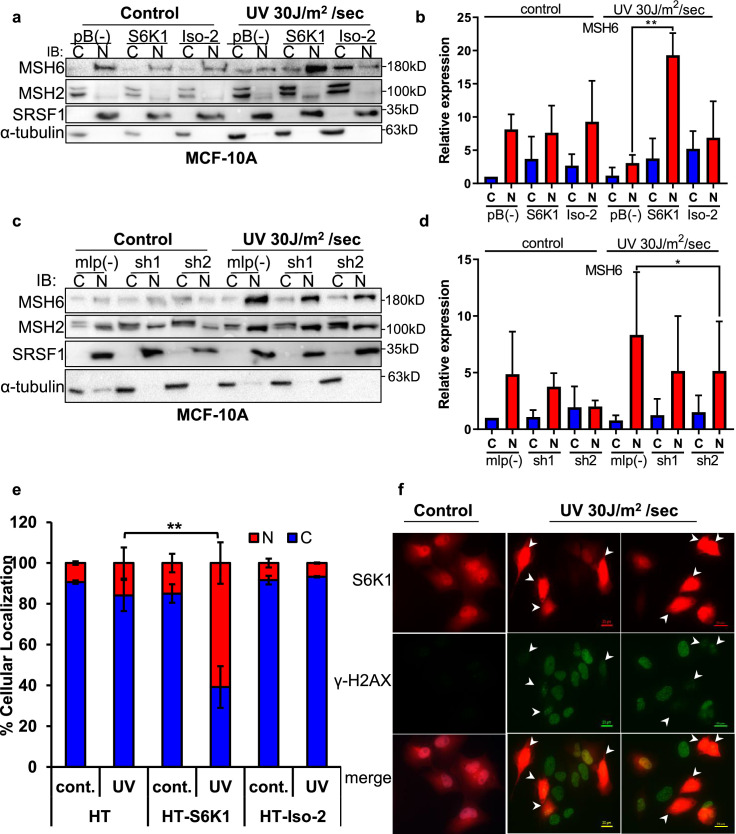
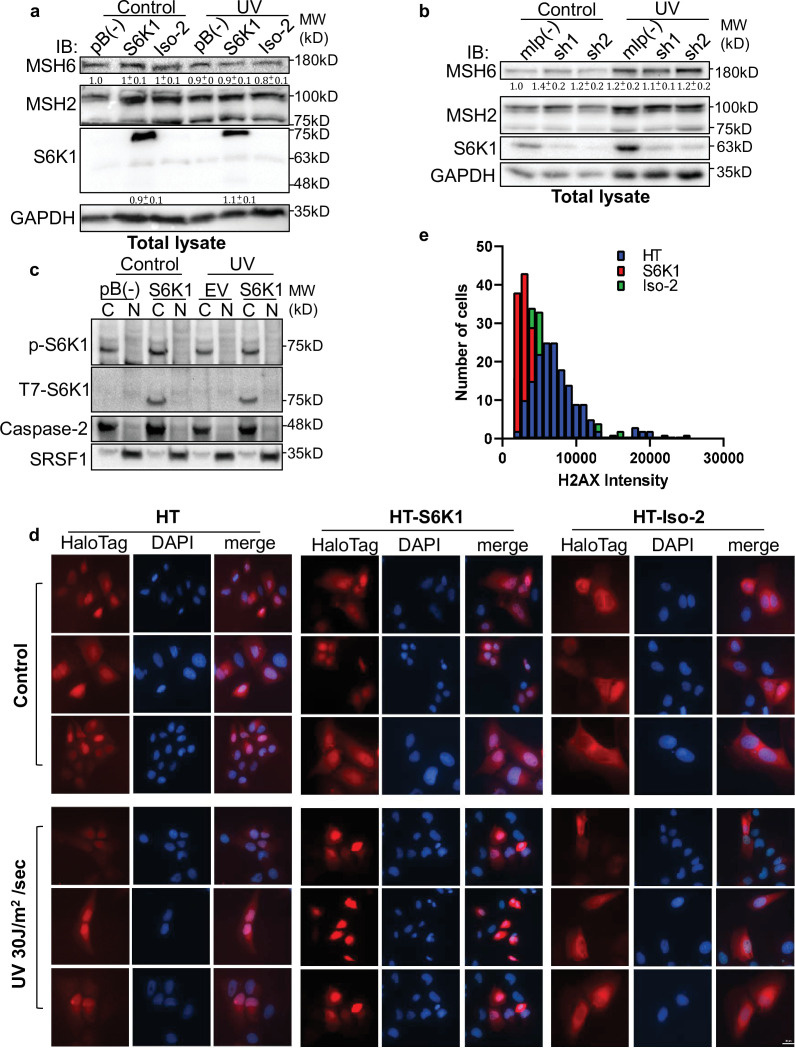
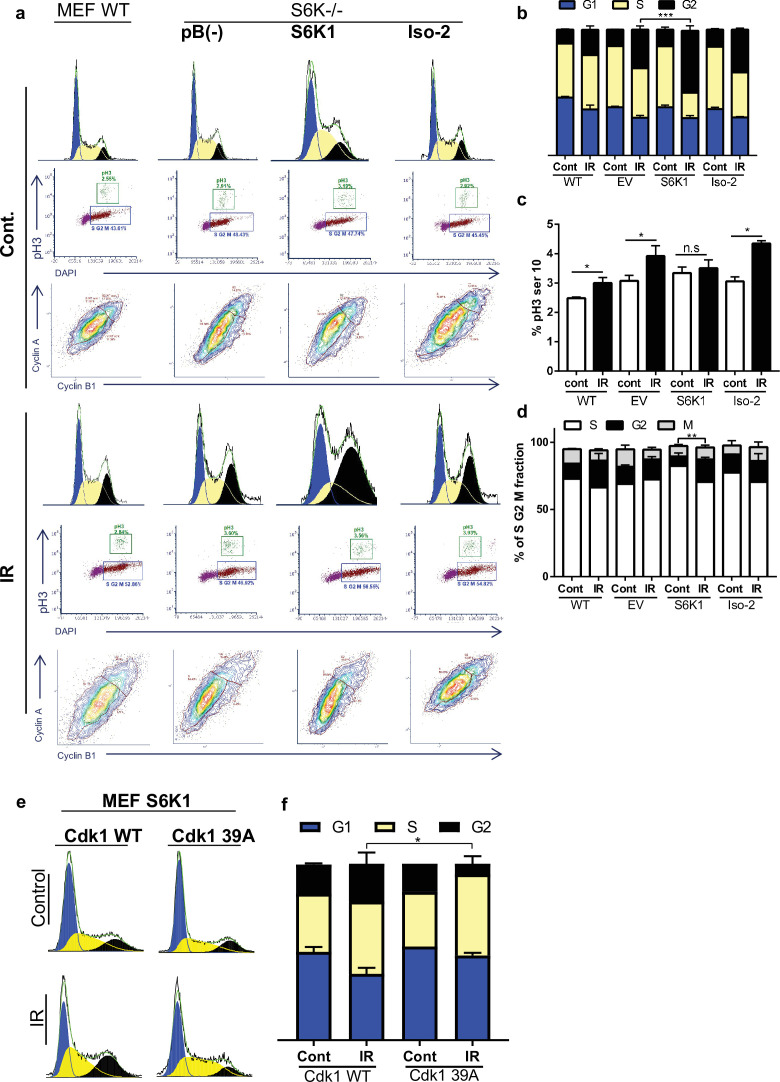
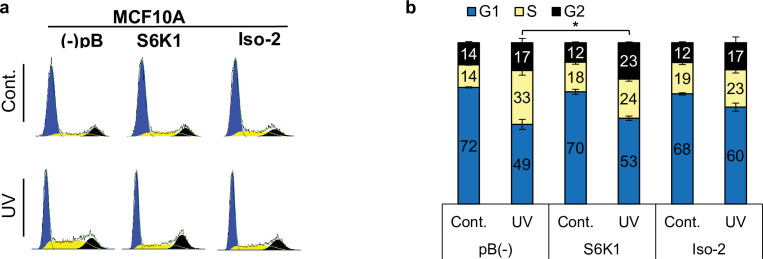
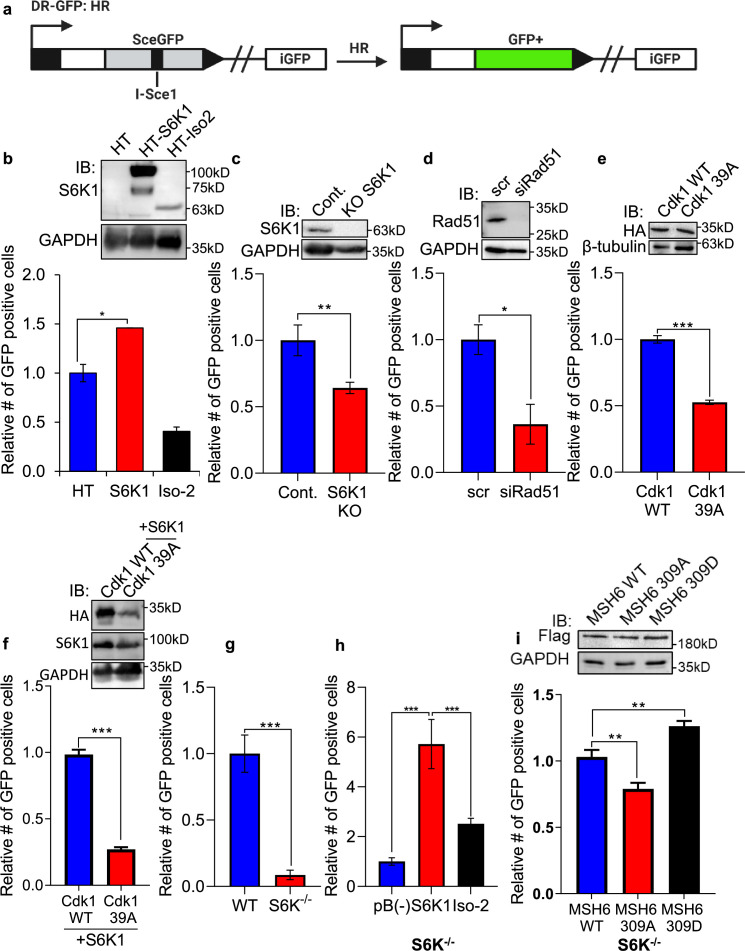
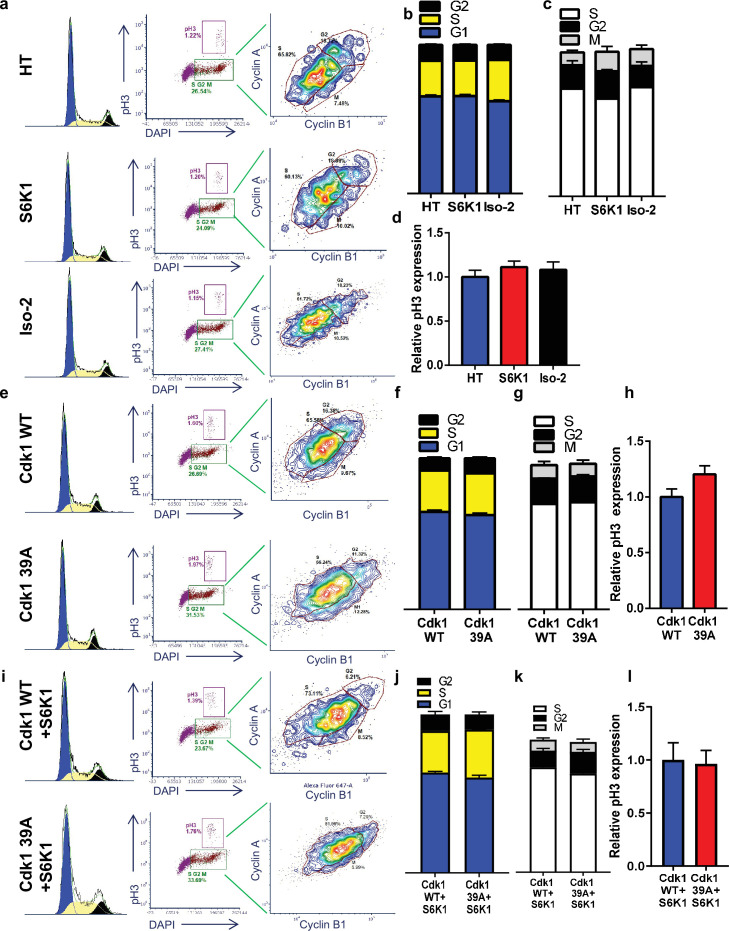
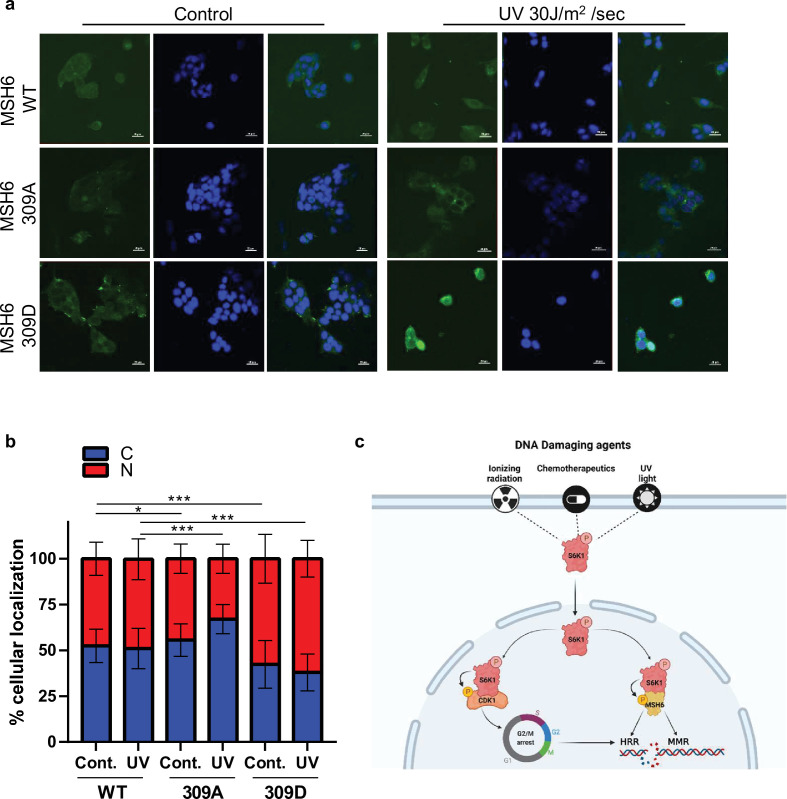
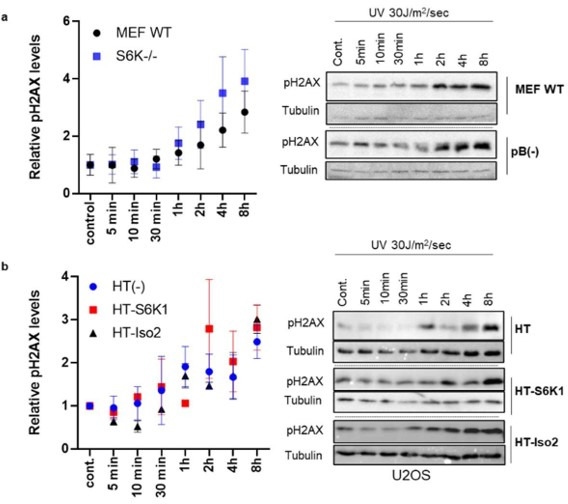
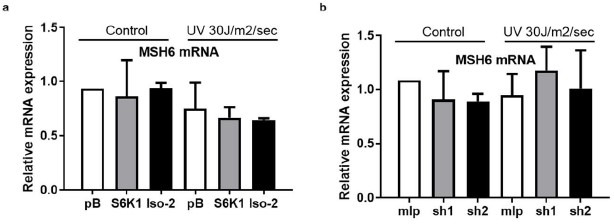
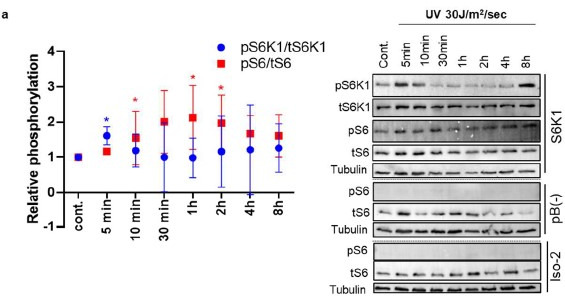
The mTORC1 substrate, S6 Kinase 1 (S6K1), is involved in the regulation of cell growth, ribosome biogenesis, glucose homeostasis, and adipogenesis. Accumulating evidence has suggested a role for mTORC1 signaling in the DNA damage response. This is mostly based on the findings that mTORC1 inhibitors sensitized cells to DNA damage. However, a direct role of the mTORC1-S6K1 signaling pathway in DNA repair and the mechanism by which this signaling pathway regulates DNA repair is unknown. In this study, we discovered a novel role for S6K1 in regulating DNA repair through the coordinated regulation of the cell cycle, homologous recombination (HR) DNA repair (HRR) and mismatch DNA repair (MMR) mechanisms. Here, we show that S6K1 orchestrates DNA repair by phosphorylation of Cdk1 at serine 39, causing G2/M cell cycle arrest enabling homologous recombination and by phosphorylation of MSH6 at serine 309, enhancing MMR. Moreover, breast cancer cells harboring RPS6KB1 gene amplification show increased resistance to several DNA damaging agents and S6K1 expression is associated with poor survival of breast cancer patients treated with chemotherapy. Our findings reveal an unexpected function of S6K1 in the DNA repair pathway, serving as a tumorigenic barrier by safeguarding genomic stability.

Keywords: CDK1; DNA repair; MSH2; MSH6; S6K1; biochemistry; cancer biology; cdk1(cdc2); chemical biology; dna repair; mTORC1; msh2; msh6; s6k1.

Plain language summary

Damage to the DNA in our cells can cause harmful changes that, if unchecked, can lead to the development of cancer. To help prevent this, cellular mechanisms are in place to repair defects in the DNA. A particular process, known as the mTORC1-S6K1 pathway is suspected to be important for repair because when this pathway is blocked, cells become more sensitive to DNA damage. It is still unknown how the various proteins involved in the mTORC1-S6K1 pathway contribute to repairing DNA. One of these proteins, S6K1, is an enzyme involved in coordinating cell growth and survival. The tumor cells in some forms of breast cancer produce more of this protein than normal, suggesting that S6K1 benefits these cells’ survival. However, it is unclear exactly how the enzyme does this. Amar-Schwartz, Ben-Hur, Jbara et al. studied the role of S6K1 using genetically manipulated mouse cells and human cancer cells. These experiments showed that the protein interacts with two other proteins involved in DNA repair and activates them, regulating two different repair mechanisms and protecting cells against damage. These results might explain why some breast cancer tumors are resistant to radiotherapy and chemotherapy treatments, which aim to kill tumor cells by damaging their DNA. If this is the case, these findings could help clinicians choose more effective treatment options for people with cancers that produce additional S6K1. In the future, drugs that block the activity of the enzyme could make cancer cells more susceptible to chemotherapy.


Conflict of interest statement

AA, VB, AJ, YC, GB, EA, ZS, BM, FH, AS, MA, MB, RW, RA, TG, RK No competing interests declared

Figures

Figure 1.
Figure 1.. S6K1 protects cells from DNA damaging agents.
(a) Long (S6K1) and short (Iso-2) S6K1 isoform structure and domain organization with addition of Halo-tag (light blue ovals). Isoform Iso-2 lacks 6 out of 12 conserved regions of the kinase domain, a mTOR phosphorylation site at threonine 389 (T389), as well as the C terminal autoinhibitory domain (CTD). NLS (nuclear localization sequence), NTD (N terminal domain). (b) Western blot showing the expression of S6K1 in MEF wild type (WT), S6K-/- cells and S6K-/- cells transduced with retroviruses encoding either empty vector pBABE (pB(-)), S6K1 or Iso-2. (c,f,i) Trypan blue exclusion assay of MEF WT, S6K-/- and S6K-/- cells described in (b) treated with doxorubicin 8 μg/ml (DOX) for 24 hr (c) or 24 hr after either γ irradiation 5 Gy (f) or UVC 8 J/m2/s (i). Data represents means ± SD of six replicates. (d,e,g,h,j) Clonogenic survival assay of MEF WT, S6K-/- cells (d,g,h,j), and S6K-/- cells transduced with retroviruses encoding either empty vector pBABE (pB(-)), S6K1 or Iso-2 (e,g,h,j) treated with various concentrations of Dox (d,e), γ irradiation 1–5 Gy (g), UVC 6.5 J/m2/s (h) or various concentrations of neocarzinostatin (NCS) (j). Colonies were fixed and quantified after 14 days. Data represents means ± SD of at least three biological replicates. (k) Clonogenic survival assay of S6K-/- cells expressing either empty vector pBABE (pB(-))or S6K1. Cells were treated with various concentrations of doxorubicin (DOX) with and without 50 nM rapamycin (R). Data represents means ± SD of three biological triplicates. (l,m) Western blot analysis of MEF WT and S6K-/- cells (l) or cells described in (b) (m) 24 hours after irradiation with UVC 6.5 J/m2/s. Cleaved caspase 3 and γ−H2AX signals were quantified relative to GAPDH signal. * p<0.05, ** p<0.01, *** p<0.001. p values were calculated using Student’s t-test (two-tailed). Data represents means ± SD of three biological triplicates.
Figure 1—figure supplement 1.
Figure 1—figure supplement 1.. S6K1 protects MCF-10A cells from DNA damaging agents.
(a) Western blot showing the expression of S6K1 in MCF-10A cells transduced with retroviruses encoding either empty vector pBABE (pB(-)), S6K1, Iso-2 or empty vector mlp(-), S6K1-specific shRNAs (sh1, sh2). (b,c,f,g) Trypan blue exclusion assay of MCF-10A cells transduced with retroviruses encoding either empty vector pBABE (pB(-)), S6K1 or Iso-2 (b, f) or mlp(-), S6K1-specific shRNAs (sh1,sh2) (c, g) treated with either 8 mg/µl doxorubicin (DOX) for 24 hr (b,c) or 24 hr after exposure to UVC 8 J/m2/s (f,g). Data represents means ± SD of six replicates. (d,e,h) Clonogenic survival assay of MCF-10A cells over-expressing either S6K1 or Iso-2 (d,h) or MCF-10A cells expressing S6K1-specific shRNAs (sh1,sh2) (e,h). Cells were exposed to γ irradiation 1–5 Gy (d,e) or various concentrations of neocarzinostatin (NCS) (h). Colonies were fixed and quantified after 14 days. Data represents means ± SD of four replicates. (i) Clonogenic survival assay of MCF-10A cells transduced with the either empty vector pBABE (pB(-)), S6K1 or Iso-2 and treated with 10 mM cisplatin (CDDP) for 16 hr. Cells were seeded at either 3000 or 1500 cells/well. After 14 days, colonies were fixed and stained. Experiment was performed in triplicate. (j) Western blot analysis of MCF-10A cells transduced with retroviruses encoding either empty vector pBABE (pB(-), S6K1 or Iso-2 or mlp(-)), S6K1-specific shRNAs (sh1, sh2) 24 hr after irradiation with UVC 12 J/m2/s. (k) Western blot of U2OS cells transfected with either control Halo-tag vector (HT), S6K1 or Iso-2. Forty-eight hr after transfection the cells were either untreated (Control) or treated with either doxorubicin (DOX) (0.5 µg/ml) or doxorubicin and Rapamycin (100 nM) (Rapa +DOX). 3.5 hr after treatment cells were harvested and subjected to western blot. * p<0.05, ** p<0.01, *** p<0.001. p values were calculated using Student’s t-test (two-tailed).
Figure 1—figure supplement 2.
Figure 1—figure supplement 2.. RPS6KB1 expression is a poor prognosis marker for breast cancer patients and cell lines treated with chemotherapy.
(a) Kaplan-Meier survival plots of breast cancer patients treated with chemotherapy with relation to S6K1 expression in their tumors. Data using three different probe-sets from Affymetrix array are shown. (b) Kaplan-Meier survival plots of breast cancer patients not treated with chemotherapy with relation to S6K1 expression in their tumors. Data using three different probe-sets from Affymetrix array are shown. Data was taken from http://kmplot.com/analysis/. (c) Western blot showing the expression of S6K1 in four different breast cancer cell lines (BTB474, MCF7, SKBR3, and HCC70). (d,e) BTB474, MCF7, SKBR3, and HCC70 cells were exposed to either DMSO (vehicle), 25 mM cisplatin (CDDP) or 1 mg/ml doxorubicin (DOX) for 24 hr. Western-blot analysis (d) and trypan-blue exclusion assay (e) are shown. Data represents means ± SD of six replicates. *** p<0.001, comparing BTB474 cells to MCF7, SKBR3, or HCC70 cells. p values were calculated using Student’s t-test (two-tailed).
Figure 1—figure supplement 3.
Figure 1—figure supplement 3.. S6K1 does not affect ATM levels or phosphorylation state.
(a–d) Western blot analysis of MCF-10A cells transduced with retroviruses encoding either empty vector pBABE (pB(-)), S6K1 or Iso-2 (a,b) or empty vector (mlp(-)), S6K1-specific shRNAs (sh1, sh2) (c,d). Cells were irradiated with either γ-irradiation 5 Gray (a,c) or UVC 30 J/m2/s (b,d) and harvested 1 or 2 hr after irradiation. (e–h) Western blot analysis of MEF S6K-/- cells and WT MEFs (g,h) or MEF S6K-/- cells transduced with retroviruses encoding either empty vector pBABE (pB(-)), S6K1 or Iso-2 (e,f). Cells were irradiated with either γ-irradiation 5 Gray (e, g) or UVC 30 J/m2/s (f, h) and harvested 1 or 2 hr after irradiation. The quantitation is shown in a bar graph below each panel. Data represents means + SD of triplicates. *p<0.05 values were calculated using Student’s t-test (two-tailed).
Figure 2.
Figure 2.. S6K1 and Iso-2 bind to DNA damage/repair proteins.
(a) Venn diagram representing DNA damage response/repair proteins that bound specifically to HT-S6K1 isoforms in transfected HEK293 cells. Proteins marked in blue were validated by reciprocal immunoprecipitations. (b,c) Western blot of total lysate (L) and flow through (FT) of Halo-tag pulldown from HEK293 cells transfected with either Halo-tag expressing control vector (HT), HT-S6K1 (S6K1) or HT-Iso-2 (Iso-2) (b, left panel and c, upper panel). Western blot of Halo-tag pulldown from the same cells (b, right panel c, lower panel). (d) Western blot of total lysate (L) and flow through (FT) of Halo-tag pulldown from HeLa cells transfected with either Halo-tag expressing control vector (HT), HT-S6K1 (S6K1) or HT-Iso-2 (Iso-2) (upper panel). Western blot of Halo-tag pulldown from the same cells transfected with either Halo-tag expressing control vector (HT), S6K1 or Iso-2 (lower panel). (e) Western blot of total lysate from HEK293 cells co-transfected with either Halo-tag expressing control vector (HT), HT-S6K1 (S6K1) or HT-Iso-2 (Iso-2) and HA-Cdk1 (upper panel). Western blot of immunoprecipitation of lysates of these cells with anti-HA antibody (lower panel). (f). Western blot analysis of HEK293 cells transfected as described in b (left panel). Western blot of immunoprecipitation of lysates of these cells with anti-PCNA antibody (right panel).
Figure 2—figure supplement 1.
Figure 2—figure supplement 1.. S6K1 isoforms interact with proteins involved in DNA repair.
(a) Venn diagram representing the overlap of proteins identified in two independent proteomic analyses. Proteins bound to HT-S6K1 isoforms in HEK293 cells transfected with either HT, HT-S6K1, or HT-Iso-2 from Halo-tag pulldown assay were analyzed by Mass-spectrometry. The numbers represent the number of proteins which specifically bound to either of the HT-S6K1 isoforms and not to the HT control. Exp. 1 was performed using the conventional proteomic method (gel extracted samples) and Exp. 2 was performed using the ‘on bead digestion’ method. (b) Venn diagram representing the overlap of S6K1 interactors identified in this study (both S6K1 and Iso-2) and those reported in Pavan, et al. 2016 (Raught et al., 2004). Only high-scoring S6K1 interactions with SAINT probability (SP) >0.9 and/or containing potential phosphorylation site (RSRXXT/S) were used for comparison. (c) Venn diagram representing the overlap of S6K1 interactors identified in this study and BioGrid (Biological General Repository for Interaction Datasets https://thebiogrid.org/2). (d) Venn diagram representing the overlap of high-scoring S6K1 interactors identified in the Pavan study compared to BioGrid. (e) Western blot of total lysates (L) and flow through (FT) of HEK293 cells described used for proteomic analysis in Exp. 2 (triplicates). (f,g) HeLa cells transfected as described above were used for immunoprecipitation using PCNA antibody. Western blot analysis of total lysates (f) and immunoprecipitated proteins (g). (h,i) HeLa cells transfected as described above were used for immunoprecipitation using MSH6 antibody. Western blot analysis of total lysates (h) and immunoprecipitated proteins (i).
Figure 2—figure supplement 2.
Figure 2—figure supplement 2.. S6K1 does not phosphorylate unrelated protein Uba5.
(a) Non-radioactive in vitro kinase assay using recombinant His-S6K1 [T412E] and recombinant Uba5 (gift from the laboratory of Dr. Reuven Weiner). Reaction products were resolved by SDS-PAGE and analyzed by Western Blot using an antibody against the S6K1 phosphorylation motif (p-Akt substrate, RXXS) or an antibody to detect the recombinant proteins. (b) Protein sequence of Uba5. Arginines, serines and threonines are highlighted showing absence of an RXXS motif.
Figure 3.
Figure 3.. S6K1 phosphorylates CDK1 and MSH6 in vitro.
(a) In vitro kinase assay using γ-32P-ATP and recombinant His-S6K1 [T412E] with either recombinant His-Cdk1 (CDK1), or recombinant His-MSH6 (MSH6, 1-718aa fragment as described in Materials and methods) in the indicated combinations. First three panels show reaction products resolved by SDS-PAGE and visualized (the second and third panels are short and long exposures of the same membrane). The fourth panel shows the same membrane as the first panel probed with anti-Cdk1 antibody and detected by enhanced chemiluminescence. Nonspecific radioactive band is marked by <. (b) Non-radioactive in vitro kinase assay using recombinant His-S6K1 [T412E] with either recombinant GST-S6 (S6), His-Cdk1(Cdk1) or His-MSH6 (MSH6). Reaction products were resolved by SDS-PAGE and analyzed by Western Blot using an antibody against the S6K1 phosphorylation motif (p-Akt substrate, RXXS), or antibodies to detect the recombinant proteins. (c,d) Western blot analysis of HEK293 cells co-transfected with FLAG-MSH6 and S6K1 isoforms immunoprecipitated with anti-Flag beads. Phosphorylation of MSH6 was detected with p-Akt substrate antibody. Quantification of MSH6 phosphorylation is shown in the graph (d). (e,f) Western blot analysis of HEK293 cells co-transfected with HA-Cdk1 and S6K1 with and without UVC 30 J/m2 /s (UV) damage isoforms immunoprecipitated with anti-HA beads. Phosphorylation of Cdk1 was detected with p-Akt substrate antibody. Quantification of Cdk1 phosphorylation is shown in the graph (f). The experiment was repeated three times (biological replicate). ** p<0.01 p values were calculated using Student’s t-test (two-tailed).
Figure 4.
Figure 4.. S6K1 affects nuclear localization of DNA damage proteins.
(a,b) MCF-10A cells transduced with either empty vector pBABE (pB(-)), S6K1 or Iso-2 were either untreated (control) or treated with UVC 30 J/m2 /sec (UV). Two hours after treatment cells were harvested, fractionated and subjected to western blot analysis. β-tubulin and SRSF1 served as a cytosol (C) and nuclear (N) markers, respectively. Quantification of the blot is shown in b. Data represents means ± SD of three experiments. (c,d) MCF-10A cells transduced with either empty vector (mlp(-)) or S6K1-specific shRNAs (sh1,sh2) were either untreated (control) or treated with UVC 30 J/m2 /s (UV). Two hours after treatment cells were harvested, fractionated and subjected to western blot analysis. β-tubulin and SRSF1 served as a cytosol (C) and nuclear (N) markers, respectively. Quantification of the blot is shown in d. Data represents means ± SD of three biological experiments. (e) U2OS cells transfected with either HT, HT-S6K1 (S6K1) or HT-Iso-2 (Iso-2) were either untreated (cont.) or exposed to UVC 30 J/m2 /sec (UV). After 2 hr, cells were fixed and stained with anti-Halo-tag fluorescence TMR Direct ligand and DAPI. Cells were visually scored using a fluorescent microscope for either nuclear staining (N) or cytoplasmic staining (C). (n=600 cells scored per transfection; 300 for control and 300 for UV treatment). p values were calculated using Student’s t-test (two-tailed) from three biological replicate. (f) U2OS cells were transfected with HT-S6K1 and exposed to UVC 30 J/m2/s and fixed two hours later. Representative photograph of cells stained with anti-Halo-tag fluorescence TMR Direct ligand (red) and anti-γ-H2Ax (green). Arrows point to S6K1 nuclear localization. Images were taken by Nikon-TL (×20). * p<0.05, ** p<0.01. p Values were calculated using Student’s t-test (two-tailed).
Figure 4—figure supplement 1.
Figure 4—figure supplement 1.. Total lysates of fractionation experiments.
(a,b) Western blot of MCF-10A cells transduced with either empty vector pBABE (pB(-)), S6K1, or Iso-2 (a) or MCF-10A cells transduced with either empty vector mlp (mlp(-)) or S6K1-specific shRNAs (sh1, 2) (b) with and without UVC 30 J/m2 /sec (UV) treatment. These are total lysates from the fractionation experiment shown in main Figure 4a and c. (c) MCF-10A cells transduced with either empty vector pBABE (pB(-)) or S6K1 were either untreated (control) or treated with UVC 30 J/m2 /sec (UV). Two hr after treatment, cells were harvested, fractionated, and subjected to western blot analysis. Caspase-2 and SRSF1 served as a cytosol (C) or nuclear (N) markers, respectively. (d) U2OS cells were transfected with control Halo-tag vector (HT), HT-S6K1 (HT-S6K1) or HT-Iso-2 (HT-Iso-2) and exposed to UVC 30 J/m2 /s. After 2 hr cells were fixed and stained with anti-Halo-tag fluorescence TMR Direct ligand (red) and DAPI. Images were taken by Nikon-TL (×20). Representative images of experiment summarized in main Figure 4e. (e) Histogram representing the intensity of γ-H2AX fluorescence in U2OS cells expressing HT, HT-S6K1 (S6K1) or HT-Iso-2 (Iso-2) positive cells related to experiment described in main Figure 4f. The intensity was calculated using the NIS-Elements AR software.
Figure 5.
Figure 5.. S6K1 augments G2/M cell cycle arrest upon DNA damage.
(a–d) MEF WT or S6K-/- cell populations transduced with retroviruses encoding either empty vector pBABE (pB(-)), S6K1, or Iso-2 were irradiated with ionizing radiation 2.5 Gy (IR) (a). Cells were stained with DAPI, anti-phospho-histone H3 Alexa488, anti-Cyclin B1 Alexa647 and anti-Cyclin A PE561. G1, S, and G2 separation displayed according to DAPI staining (b). Dual analysis of pH3 and DAPI distinguishes M phase (c). Plot was gated on S/G2/M. Dual analysis of cyclin A and cyclin B1 distinguishes between S, G2, M (d). (e,f) Cell cycle FACS analysis of S6K-/- cells expressing retroviruses encoding S6K1 transfected with HA-tagged WT CDK1 or HA-tagged mutant CDK1 39 A. Thirty-six hr after transfection cells were treated with IR 5 Gy. After 24 hr, the cells were subjected to FACS analysis (e). The percentage of cells in G1, S and G2/M are depicted in the graph(f). * p<0.05, p values were calculated using Student’s t-test (two-tailed) from three biological replicate.
Figure 5—figure supplement 1.
Figure 5—figure supplement 1.. Cell cycle analysis of MCF-10A cells.
(a,b) Cell cycle FACS analysis of MCF-10A cells transduced with retroviruses encoding either empty vector pBABE (pB(-)), S6K1 or Iso-2, 24 hr after UVC 12 J/m2/s treatment (a). The percentage of cells in G1, S, and G2/M are depicted in the graph (b).
Figure 6.
Figure 6.. S6K1 overexpression enhances homologous recombination and mismatch repair.
(a) Schematic diagram of DSB reporter plasmid. SceGFP is a GFP gene that contains an I-SceI endonuclease site within the coding region. Cleavage of the I-SceI site in vivo and repair by HDR (Homologous Directed Repair) coupled by the downstream iGFP repeat results in GFP positive cells. (b) U2OS cells expressing DSB reporter plasmid (U2OS-DR-GFP) were co-transfected with ISceI and either Halo-tag empty vector (HT), HT-S6K1 or HT-Iso2. Western blot showing S6K1 expression (top panel). Cells were analyzed by FACS for GFP expression (bottom panel). (c) U2OS-DR-GFP cells knocked-out for S6K1 using CRISPR were transfected with ISceI. Western blot showing S6K1 expression (top panel). Cells were analyzed by FACS for GFP expression (bottom panel). (d) U2OS-DR-GFP cells transfected with either control siRNA (scr) or siRNA specific for Rad51 (siRad51) were co-transfected with ISceI. Western blot showing Rad51 expression (top panel). Cells were analyzed by FACS for GFP expression (bottom panel). (e) U2OS-DR-GFP cells were co-transfected with ISceI and WT CDK1 or mutant CDK1 39 A. Western blot showing HA tag expression (top panel). Cells were analyzed by FACS for GFP expression (bottom panel). (f) U2OS-DR-GFP cells were co-transfected with ISceI and S6K1 with either WT CDK1 or mutant CDK1 39 A. Western blot showing HA tag expression (top panel). Cells were analyzed by FACS for GFP expression (bottom panel). (g,h) Mismatch repair assay using MEF WT (WT) and S6K-/- cells (f) or S6K-/- cells stably expressing either empty vector (pB(-)), S6K1 or Iso-2 (g) transfected with EGFP heteroduplex plasmid. Forty-eight hr after transfection, cells were analyzed by FACS for GFP expression. (i) S6K-/- cells were co-transfected with either Flag-wild type MSH6 (WT), Flag-MSH6 mutant 309 A (309 A) or Flag-MSH6 mutant 309D (309D) and EGFP heteroduplex plasmid. Western blot showing Flag-tagged expression (top panel). Forty-eight hr after transfection, cells were analyzed by FACS for GFP expression (bottom panel). Data represents means ± SD of biological triplicates. *p<0.05 values were calculated using Student’s t-test (two-tailed).
Figure 6—figure supplement 1.
Figure 6—figure supplement 1.. Cell cycle analysis of U2OS-DR-GFP cells.
(a–l) Cell cycle FACS analysis of U2OS-DR-GFP cells expressing either HT, HT-S6K1 or HT-Iso2 (a-d, related to main Figure 6b), U2OS-DR-GFP cells expressing Cdk1 WT or Cdk1 39 A (e-h, related to main Figure 6e) or U2OS-DR-GFP co-expressing either Cdk1 WT or Cdk1 39 A with S6K1 (i-l, related to main Figure 6f). Cells were stained with DAPI, anti-phospho-histone H3 Alexa488, anti-Cyclin B1 Alexa647 and anti-Cyclin A PE561. G1, S, and G2 separation displayed according to DAPI staining (b,f,j). Dual analysis of pH3 and DAPI distinguishes M phase (d,h,l). Plots were gated on S/G2/M. Dual analysis of cyclin A and cyclin B1 distinguishess between S, G2, M (c,g,k).
Figure 7.
Figure 7.. MSH6 309 phosphorylation is important for cellular localization.
(a,b) MEF S6K -/- cells transfected with either Flag-MSH6 WT, MSH6 309 A or MSH6 309D were UV irradiated and fixed 2 hours later. Cells were stained using anti-Flag antibody and DAPI. Fluorescence was quantitated using NIS-element AR software. (c) Diagram depicting S6K1 entrance to the nucleus in response to DNA damaging agents. S6K1 phosphorylation of Cdk1 and MSH6 causes G2/M cell cycle arrest and affects DNA damage repair mechanisms.
Author response image 1.
Author response image 1.. Time Course of pH2AX levels.
(a) MEF WT and S6K-/- cells were irradiated with UV30J/m2/sec. Cells were harvested at different time points after irradiation. Western blot analysis shows pH2AX levels. (b) U2OS cells overexpressing either HT, HT-S6K1 or HT-iso-2 were irradiated withUV 30J/m2/sec. Cells were harvested at different time points after irradiation. Western blot analysis shows pH2AX levels.
Author response image 2.
Author response image 2.. MSH6 mRNA levels in cells after UV irradiation.
a. MCF10A cells overexpressing either S6K1 or Iso-2 were either untreated or treated with UV 30J/m2/sec. Q-RT-PCR was used to quantitate MSH6 mRNA levels. b. MCF10A cells overexpressing S6K1 specific sh1 or sh2 were either untreated or treated with UV 30J/m2/sec. Q-RT-PCR was used to quantitate MSH6 mRNA levels.
Author response image 3.
Author response image 3.. Time course of phosphorylation of S6K1 and S6 after UV irradiation.
(a) MEK S6K-/- cells transduced with either bB(-), S6k! or Iso-2 were irradiated with UV 30J/m2/sec. Cells were harvested at different time points after irradiation. Western Blot analysis shows phosphorylated S6K1 T389 (pS6K1), total S6K1 (tS6K1), phosphorylated S6 S235/236 (pS6) and total S6 (tS6) levels. Tubulin was used as a loading control. Graph shows relative phosphorylation od S6 and S6K1 in MEF S6K1-/- cells overexpressing S6K1.

References

    1. Abrahams A, Mowla S, Parker MI, Goding CR, Prince S. UV-mediated regulation of the anti-senescence factor tbx2. The Journal of Biological Chemistry. 2008;283:2223–2230. doi: 10.1074/jbc.M705651200. - DOI - PubMed
    1. Adamson AW, Beardsley DI, Kim W-J, Gao Y, Baskaran R, Brown KD. Methylator-induced, mismatch repair-dependent G2 arrest is activated through chk1 and chk2. Molecular Biology of the Cell. 2005;16:1513–1526. doi: 10.1091/mbc.e04-02-0089. - DOI - PMC - PubMed
    1. Albert JM, Kim KW, Cao C, Lu B. Targeting the akt/mammalian target of rapamycin pathway for radiosensitization of breast cancer. Molecular Cancer Therapeutics. 2006;5:1183–1189. doi: 10.1158/1535-7163.MCT-05-0400. - DOI - PubMed
    1. Alexander A, Cai SL, Kim J, Nanez A, Sahin M, MacLean KH, Inoki K, Guan KL, Shen J, Person MD, Kusewitt D, Mills GB, Kastan MB, Walker CL. ATM signals to TSC2 in the cytoplasm to regulate mtorc1 in response to ROS. PNAS. 2010;107:4153–4158. doi: 10.1073/pnas.0913860107. - DOI - PMC - PubMed
    1. Ali AY, Abedini MR, Tsang BK. The oncogenic phosphatase PPM1D confers cisplatin resistance in ovarian carcinoma cells by attenuating checkpoint kinase 1 and p53 activation. Oncogene. 2012;31:2175–2186. doi: 10.1038/onc.2011.399. - DOI - PubMed

Publication types