

Phasor Analysis of Fluorescence Lifetime Enables Quantitative Multiplexed Molecular Imaging of Three Probes
- PMID: 36190014
- PMCID: PMC10681155
- DOI: 10.1021/acs.analchem.2c02149
Phasor Analysis of Fluorescence Lifetime Enables Quantitative Multiplexed Molecular Imaging of Three Probes
Abstract
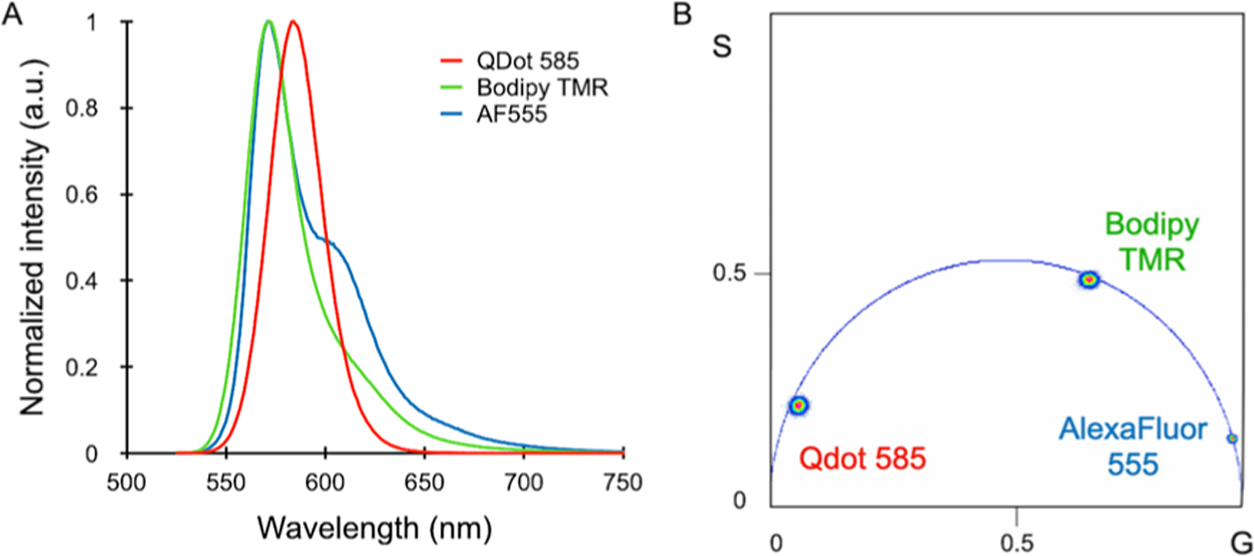
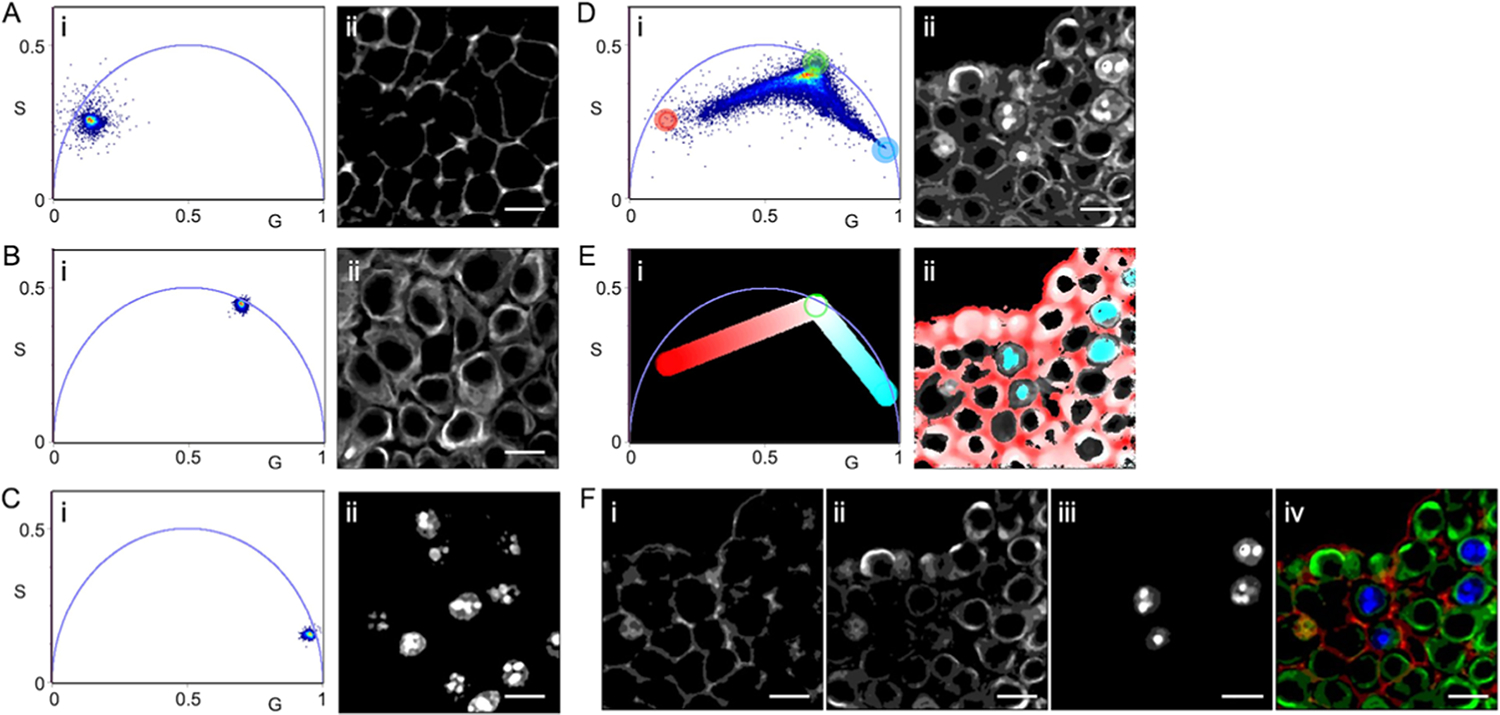
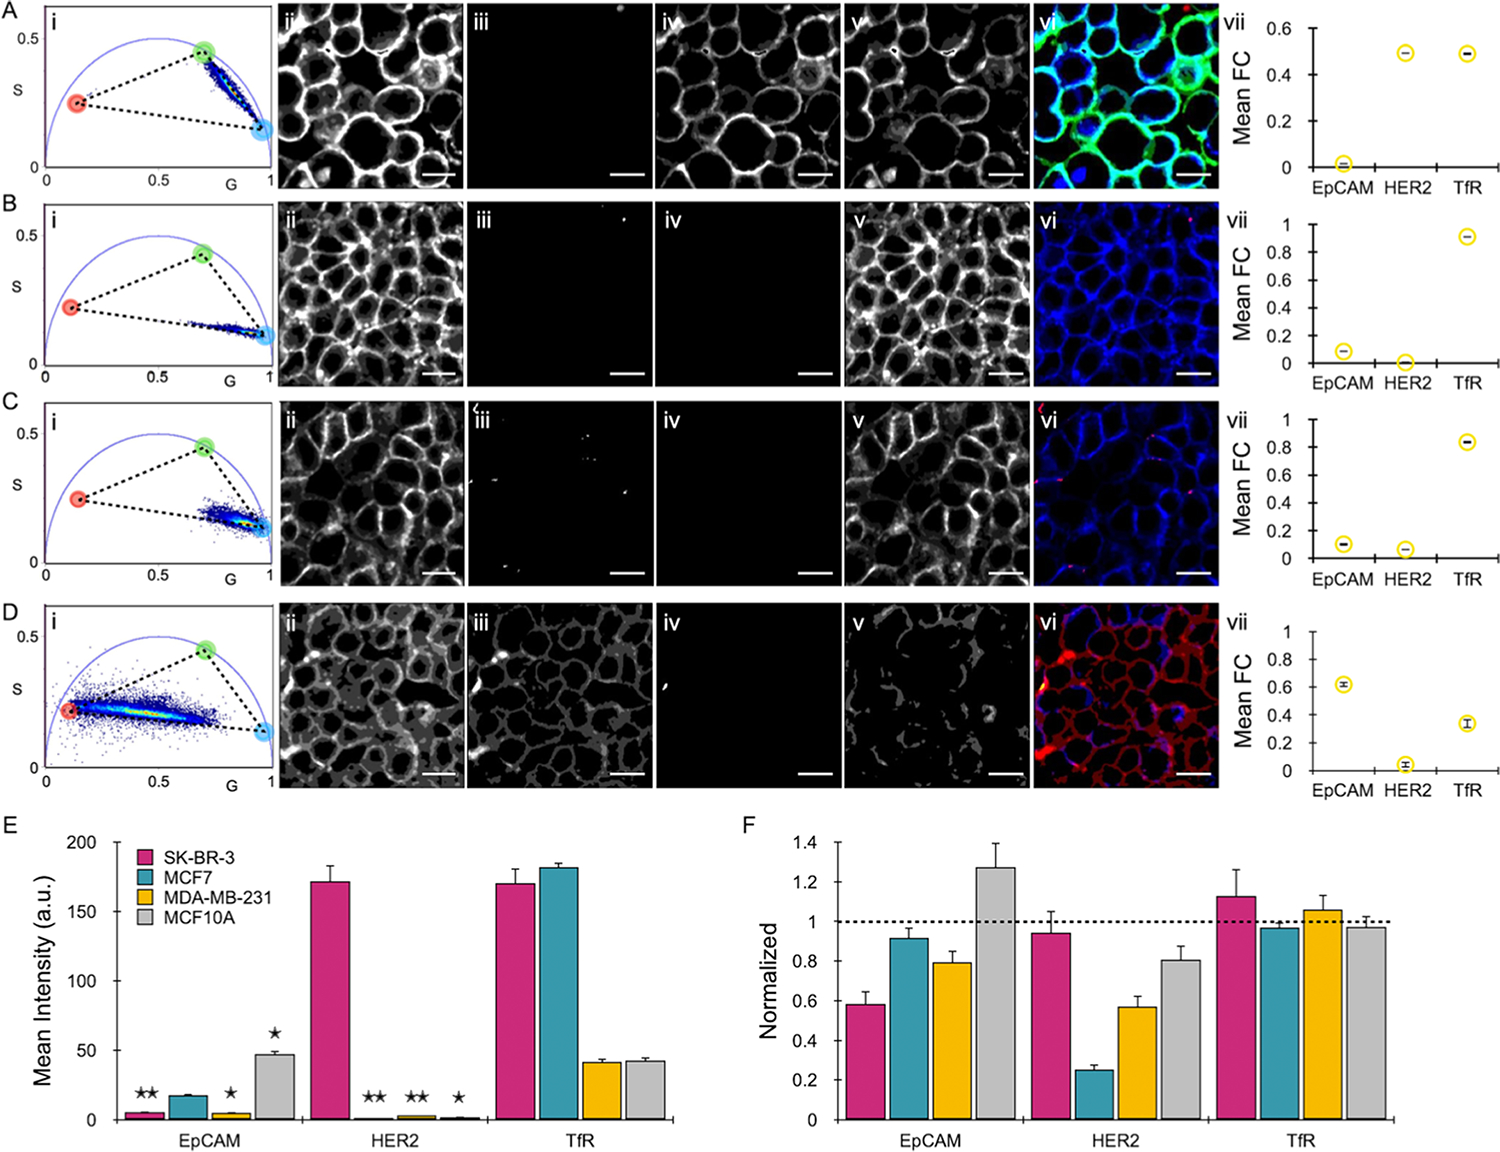
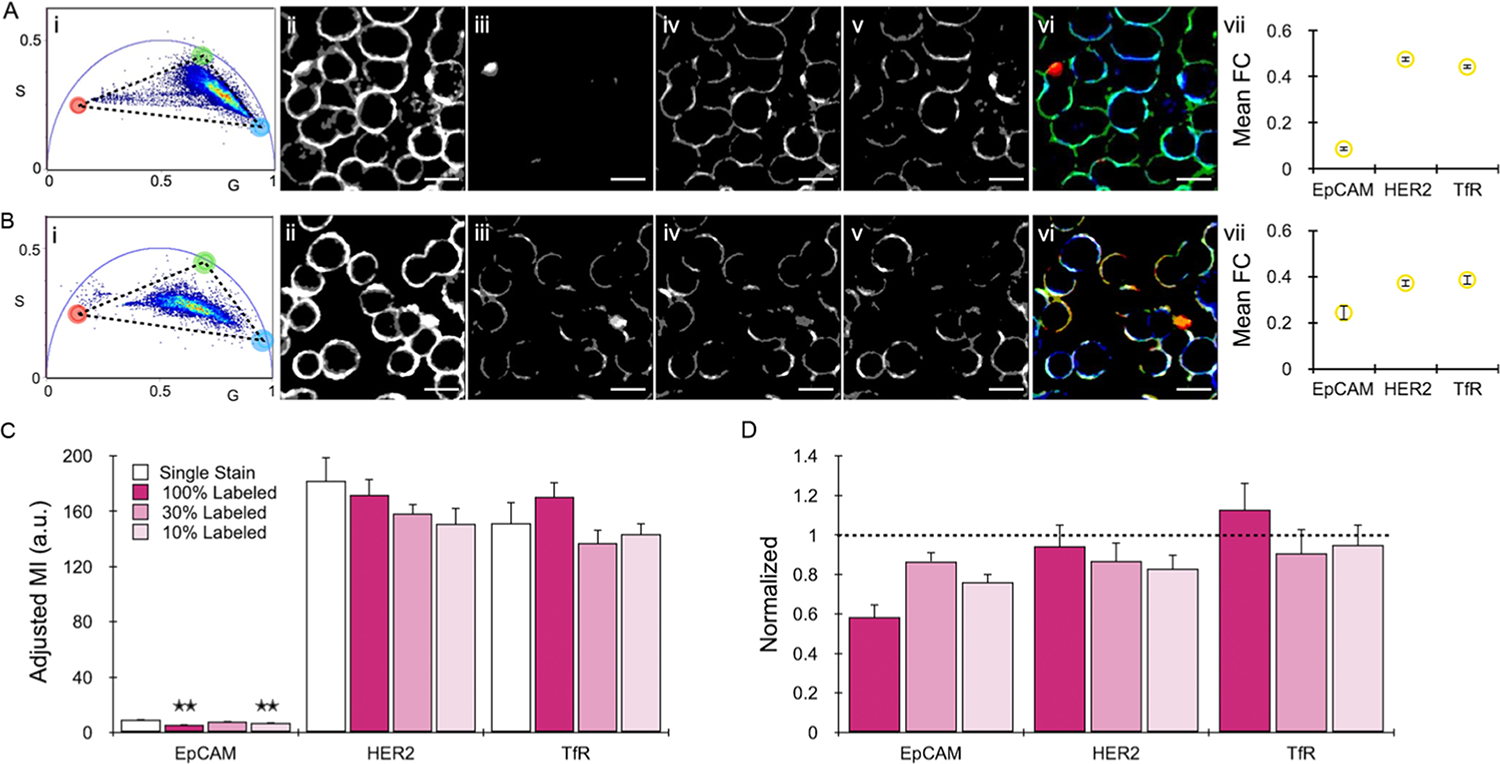
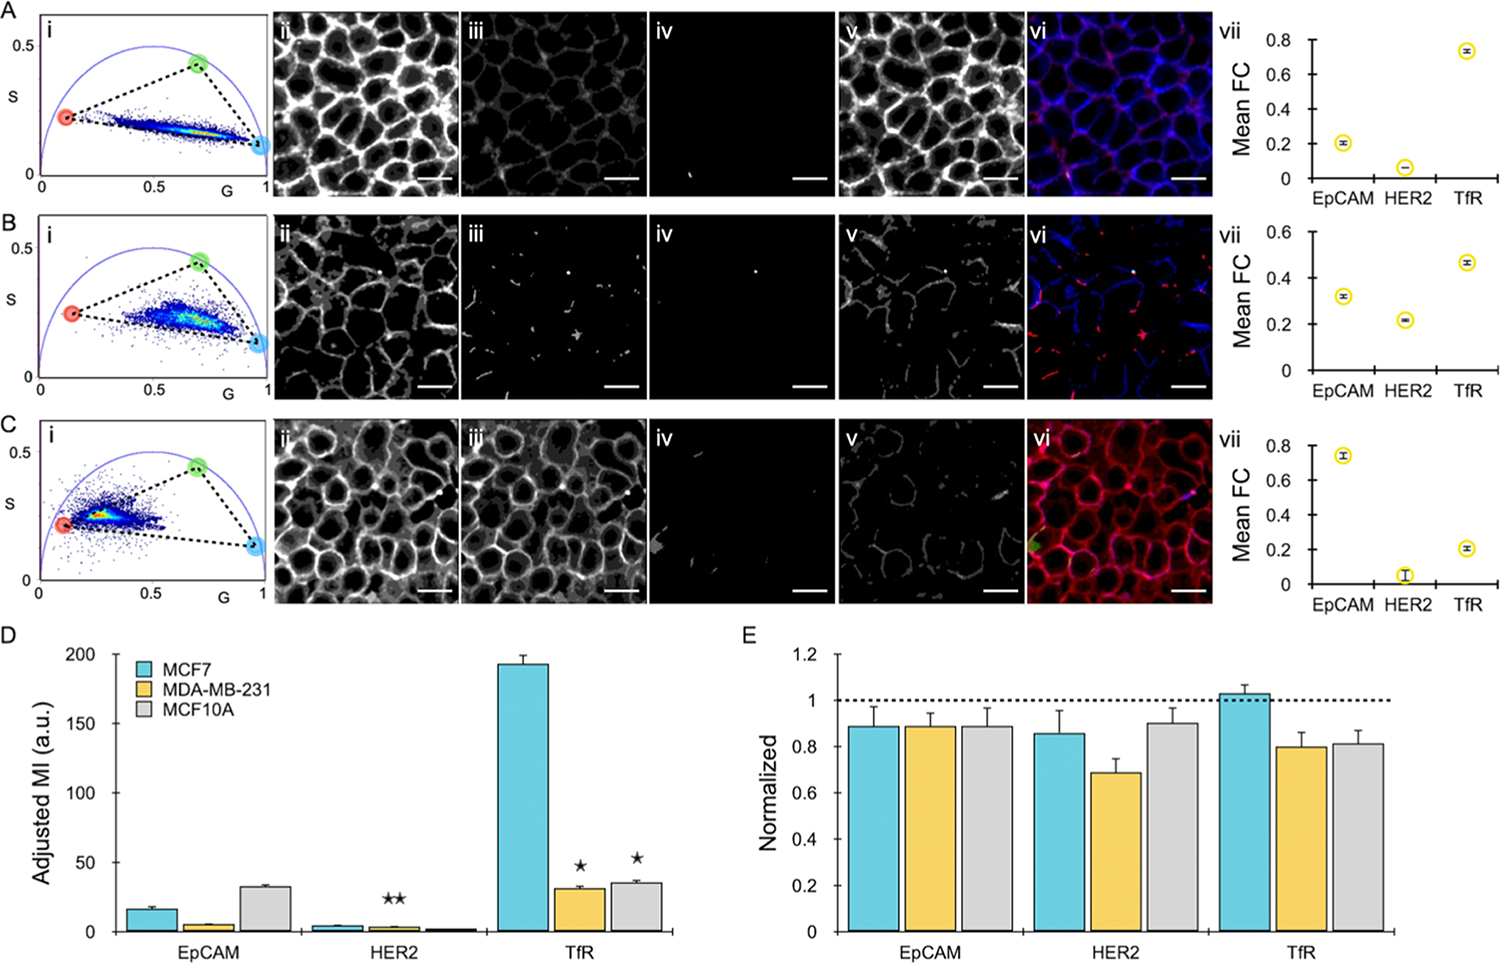
The excited-state lifetime is an intrinsic property of fluorescent molecules that can be leveraged for multiplexed imaging. An advantage of fluorescence lifetime-based multiplexing is that signals from multiple probes can be gathered simultaneously, whereas traditional spectral fluorescence imaging typically requires multiple images at different excitation and emission wavelengths. Additionally, lifetime and spectra could both be utilized to expand the multiplexing capacity of fluorescence. However, resolving exogenous molecular probes based exclusively on the fluorescence lifetime has been limited by technical challenges in analyzing lifetime data. The phasor approach to lifetime analysis offers a simple, graphical solution that has increasingly been used to assess endogenous cellular autofluorescence to quantify metabolic factors. In this study, we employed the phasor analysis of FLIM to quantitatively resolve three exogenous, antibody-targeted fluorescent probes with similar spectral properties based on lifetime information alone. First, we demonstrated that three biomarkers that were spatially restricted to the cell membrane, cytosol, or nucleus could be accurately distinguished using FLIM and phasor analysis. Next, we successfully resolved and quantified three probes that were all targeted to cell surface biomarkers. Finally, we demonstrated that lifetime-based quantitation accuracy can be improved through intensity matching of various probe-biomarker combinations, which will expand the utility of this technique. Importantly, we reconstructed images for each individual probe, as well as an overlay of all three probes, from a single FLIM image. Our results demonstrate that FLIM and phasor analysis can be leveraged as a powerful tool for simultaneous detection of multiple biomarkers with high sensitivity and accuracy.
Conflict of interest statement
The authors declare no competing financial interest.
Figures
Similar articles
-
Less Can Be More: Optimization of the Acquisition Range to Enhance Phasor Analysis in Fluorescence Lifetime Imaging Microscopy.Microsc Microanal. 2025 Mar 17;31(2):ozaf014. doi: 10.1093/mam/ozaf014. Microsc Microanal. 2025. PMID: 40131838
-
Phasor S-FLIM: a new paradigm for fast and robust spectral fluorescence lifetime imaging.Nat Methods. 2021 May;18(5):542-550. doi: 10.1038/s41592-021-01108-4. Epub 2021 Apr 15. Nat Methods. 2021. PMID: 33859440 Free PMC article.
-
Fit-free analysis of fluorescence lifetime imaging data using the phasor approach.Nat Protoc. 2018 Sep;13(9):1979-2004. doi: 10.1038/s41596-018-0026-5. Nat Protoc. 2018. PMID: 30190551
-
Linear Combination Properties of the Phasor Space in Fluorescence Imaging.Sensors (Basel). 2022 Jan 27;22(3):999. doi: 10.3390/s22030999. Sensors (Basel). 2022. PMID: 35161742 Free PMC article. Review.
-
Fluorescence lifetime imaging microscopy: fundamentals and advances in instrumentation, analysis, and applications.J Biomed Opt. 2020 May;25(7):1-43. doi: 10.1117/1.JBO.25.7.071203. J Biomed Opt. 2020. PMID: 32406215 Free PMC article. Review.
Cited by
-
Carbon dots derived from expired drugs based ratiometric fluorescent sensor for horseradish peroxidase in fruits and vegetables and screening inhibitors.Mikrochim Acta. 2024 Jan 22;191(2):109. doi: 10.1007/s00604-023-06160-9. Mikrochim Acta. 2024. PMID: 38246895
-
From mouse to human: Accessing the biochemistry of vision in vivo by two-photon excitation.Prog Retin Eye Res. 2023 Mar;93:101170. doi: 10.1016/j.preteyeres.2023.101170. Epub 2023 Feb 12. Prog Retin Eye Res. 2023. PMID: 36787681 Free PMC article. Review.
-
Two-photon excitation fluorescence in ophthalmology: safety and improved imaging for functional diagnostics.Front Med (Lausanne). 2024 Jan 3;10:1293640. doi: 10.3389/fmed.2023.1293640. eCollection 2023. Front Med (Lausanne). 2024. PMID: 38235268 Free PMC article. Review.
-
Asparagusic Golgi Trackers.JACS Au. 2024 Aug 20;4(10):3759-3765. doi: 10.1021/jacsau.4c00487. eCollection 2024 Oct 28. JACS Au. 2024. PMID: 39483219 Free PMC article.
-
Fluorescent/Phosphorescent Dual-Emissive Probe for Simultaneous and Independent Sensing of Intracellular Hypochlorite and pH via Time-Resolved Luminescence Imaging.Chem Biomed Imaging. 2023 Jun 18;1(9):864-870. doi: 10.1021/cbmi.3c00059. eCollection 2023 Dec 25. Chem Biomed Imaging. 2023. PMID: 39473840 Free PMC article.
References
-
- Stadler C; Rexhepaj E; Singan VR; Murphy RF; Pepperkok R; Uhlen M; Simpson JC; Lundberg E Nat. Methods 2013, 10, 315–323. - PubMed
