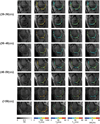
Age-Dependent Changes in Knee Cartilage T1 , T2 , and T1p Simultaneously Measured Using MRI Fingerprinting
- PMID: 36190187
- PMCID: PMC10067532
- DOI: 10.1002/jmri.28451
Age-Dependent Changes in Knee Cartilage T1 , T2 , and T1p Simultaneously Measured Using MRI Fingerprinting
Abstract
Background: Magnetic resonance fingerprinting (MRF) techniques have been recently described for simultaneous multiparameter cartilage mapping of the knee although investigation of their ability to detect early cartilage degeneration remains limited.
Purpose: To investigate age-dependent changes in knee cartilage T1 , T2 , and T1p relaxation times measured using a three-dimensional (3D) MRF sequence in healthy volunteers.
Study type: Prospective.
Subjects: The study group consisted of 24 healthy asymptomatic human volunteers (15 males with mean age 34.9 ± 14.4 years and 9 females with mean age 44.5 ± 13.1 years).
Field strength/sequence: A 3.0 T gradient-echo-based 3D-MRF sequence was used to simultaneously create proton density-weighted images and T1 , T2 , and T1p maps of knee cartilage.
Assessment: Mean global cartilage and regional cartilage (lateral femur, lateral tibia, medial femur, medial tibia, and patella) T1 , T2 , and T1ρ relaxation times of the knee were measured.
Statistical tests: Kruskal-Wallis tests were used to compared cartilage T1 , T2 , and T1ρ relaxation times between different age groups, while Spearman correlation coefficients was used to determine the association between age and cartilage T1 , T2 , and T1ρ relaxation times. The value of P < 0.05 was considered statistically significant.
Results: Higher age groups showed higher global and regional cartilage T1 , T2 , and T1ρ . There was a significant difference between age groups in global cartilage T2 and T1ρ but no significant difference (P = 0.13) in global cartilage T1. Significant difference was also present between age groups in cartilage T2 and T1ρ for medial femur cartilage and medial tibia cartilage. There were significant moderate correlations between age and T2 and T1ρ for global cartilage (R2 = 0.63-0.64), medial femur cartilage (R2 = 0.50-0.56), and medial tibia cartilage (R2 = 0.54-0.66).
Conclusion: Cartilage T2 and T1p relaxation times simultaneously measured using a 3D-MRF sequence in healthy volunteers showed age-dependent changes in knee cartilage, primarily within the medial compartment.
Keywords: MRI fingerprinting; T1 relaxation time; T1ρ relaxation time; T2 relaxation time; cartilage; knee.
© 2022 International Society for Magnetic Resonance in Medicine.
Figures


Comment in
-
Editorial for "Age-Dependent Changes in Knee Cartilage T1 , T2 , and T1p Simultaneously Measured Using MRI Fingerprinting".J Magn Reson Imaging. 2023 Jun;57(6):1813-1814. doi: 10.1002/jmri.28458. Epub 2022 Sep 29. J Magn Reson Imaging. 2023. PMID: 36173385 No abstract available.
References
-
- Guermazi A, Alizai H, Crema MD, Trattnig S, Regatte RR, Roemer FW. Compositional MRI techniques for evaluation of cartilage degeneration in osteoarthritis. Osteoarthritis Cartilage 2015;23(10):1639–1653. - PubMed
-
- MacKay JW, Low SBL, Smith TO, Toms AP, McCaskie AW, Gilbert FJ. Systematic review and meta-analysis of the reliability and discriminative validity of cartilage compositional MRI in knee osteoarthritis. Osteoarthritis Cartilage 2018;26(9):1140–1152. - PubMed
-
- Emanuel KS, Kellner LJ, Peters MJM, Haartmans MJJ, Hooijmans MT, Emans PJ. The relation between the biochemical composition of knee articular cartilage and quantitative MRI: a systematic review and meta-analysis. Osteoarthritis Cartilage 2022;30(5):650–662. - PubMed
Publication types
MeSH terms
Grants and funding
LinkOut - more resources
Full Text Sources
Miscellaneous

