. 2023 Jan 2;35(1):453-468.
doi: 10.1093/plcell/koac297.

The RAC/ROP GTPase activator OsRopGEF10 functions in crown root development by regulating cytokinin signaling in rice

Affiliations

The RAC/ROP GTPase activator OsRopGEF10 functions in crown root development by regulating cytokinin signaling in rice

Huili Liu et al. Plant Cell. .

Abstract

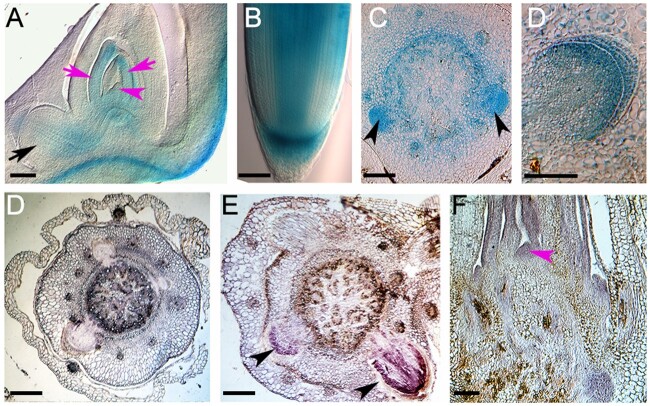
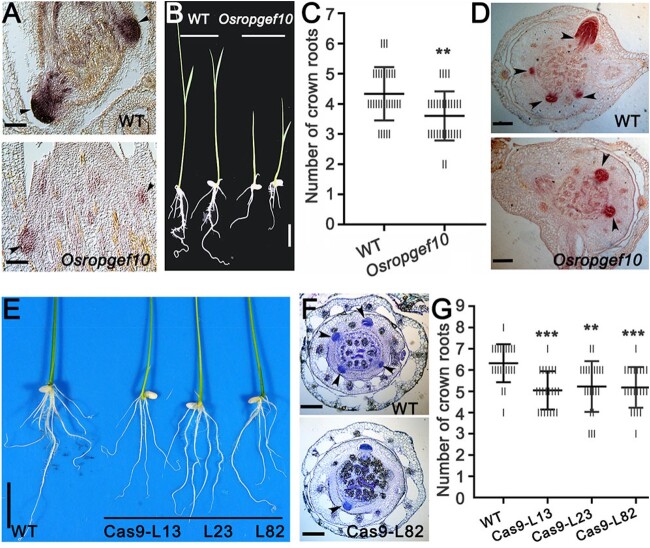
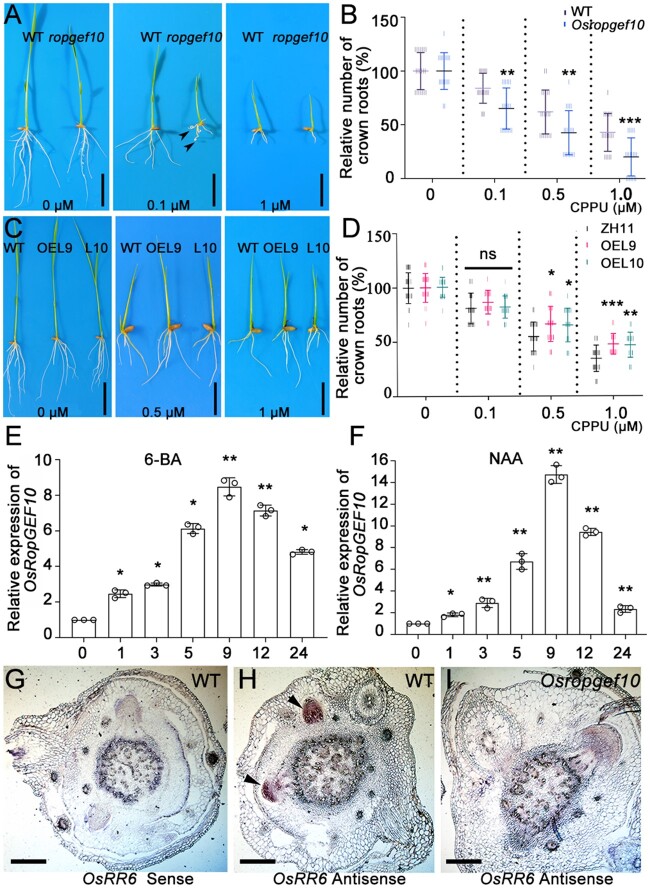
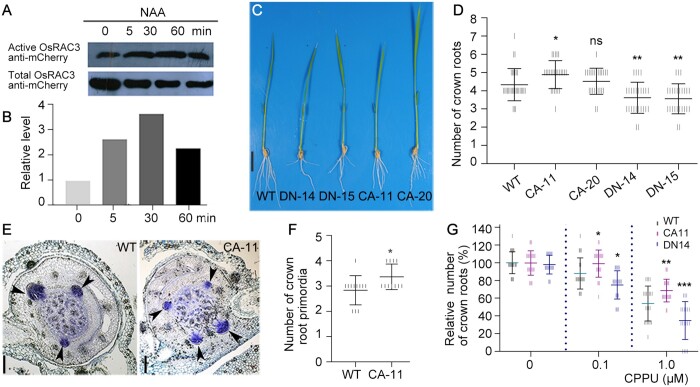
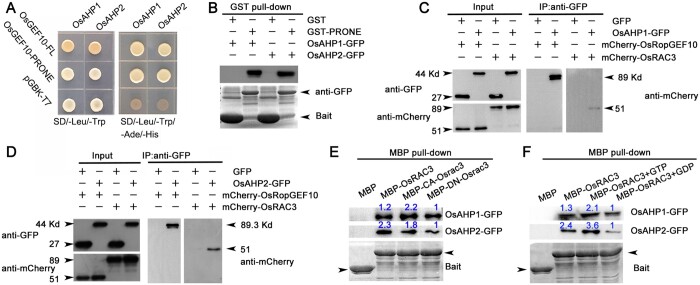
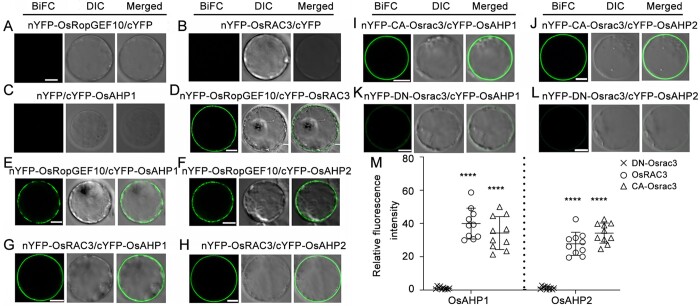
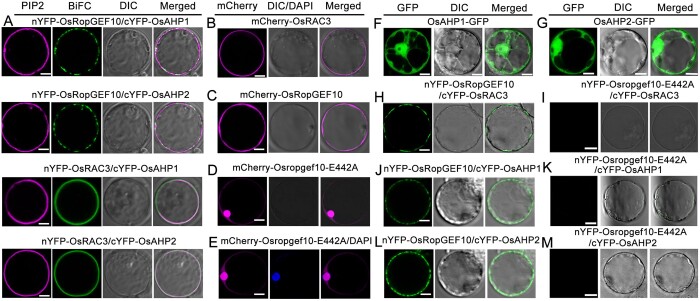
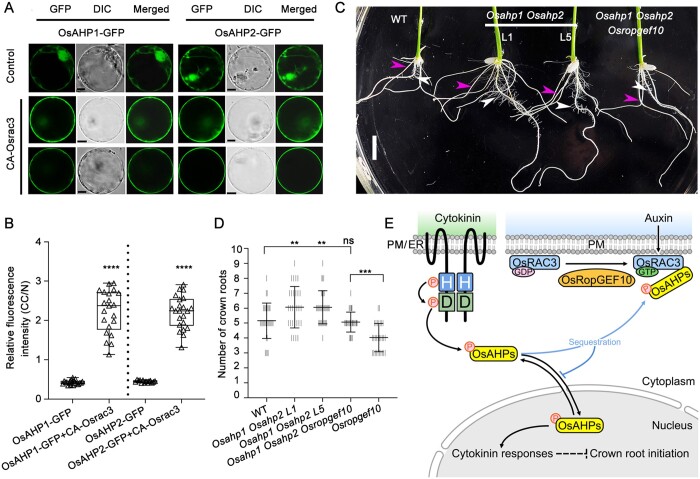
RAC/Rho of plant (ROP) GTPases are major molecular switches that control diverse signaling cascades for plant growth, development, and defense. Here, we discovered a signaling node that connects RAC/ROPs to cytokinins. Rice (Oryza sativa) plants develop a fibrous root system mainly composed of crown roots. Cytokinin signaling via a phosphorelay system is critical for crown root development. We show that OsRopGEF10, which activates RAC/ROPs, acts upstream of the cytoplasmic-nuclear shuttling phosphotransfer proteins AHPs of the cytokinin signaling pathway to promote crown root development. Mutations of OsRopGEF10 induced hypersensitivity to cytokinin, whereas overexpressing this gene reduced the cytokinin response. Loss of OsRopGEF10 function reduced the expression of the response regulator gene OsRR6, a repressor of cytokinin signaling, and impaired crown root development. Mutations in OsAHP1/2 led to increased crown root production and rescued the crown root defect of Osropgef10. Furthermore, auxin activates the ROP GTPase OsRAC3, which attenuates cytokinin signaling for crown root initiation. Molecular interactions between OsRopGEF10, OsRAC3, and OsAHP1/2 implicate a mechanism whereby OsRopGEF10-activated OsRAC3 recruits OsAHP1/2 to the cortical cytoplasm, sequestering them from their phosphorelay function in the nucleus. Together, our findings uncover the OsRopGEF10-OsRAC3-OsAHP1/2 signaling module, establish a link between RAC/ROPs and cytokinin, and reveal molecular crosstalk between auxin and cytokinin during crown root development.


Figures

Figure 1
Figure 1
Tissue-specific expression of OsRopGEF10. A–D, GUS staining of OsRopGEF10 pro:GUS transgenic plants. Semi-thin section of a mature embryo (A), whole mount of a primary root tip (B), semi-thin cross sections of crown root initials of 5-day-old seedlings (C) and growing crown root primordia (D). E–G, In situ hybridization of OsRopGEF10 transcripts in sections of 9-day-old seedlings. Cross sections showing crown root initiation with sense (E) and antisense (F) probes. Longitudinal section of a SAM with an antisense probe (G). Bars = 100 μm. Magenta arrows indicate young leaves, magenta arrowheads indicate shoot apical meristems, black arrow indicates a root apical meristem, and black arrowheads indicate crown root primordia.
Figure 2
Figure 2
Phenotypes of Osropgef10 mutants. A, OsRopGEF10 expression is reduced in 7-day-old Osropgef10 seedlings, as determined by in situ hybridization. Upper panel shows the WT (Dongjin) and lower panel shows an Osropgef10 seedling. B, Comparison of WT and Osropgef10 seedlings at 7 days after germination. Bar = 2 cm. C, Comparison of crown root number between 7-day-old WT and Osropgef10 seedlings. For each plant line, a tally is also shown indicating the number of plants with each crown root number. Data are means ± sd (n = 30). Significant differences were detected by Student’s t test, **P < 0.01. D, Cross sections through the cotyledonary nodes of 7-day-old WT and Osropgef10. E, Root phenotypes of 9-day-old WT and Osropgef10-cas9 seedlings. Bar = 3 cm. F, Cross sections through the cotyledonary nodes of 9-day-old WT and Osropgef10-cas9 seedlings. G, Comparison of crown root number between 9-day-old WT and Osropgef10-cas9 seedlings. Data are means ± sd (n > 20). Significant differences from WT were determined by one-way ANOVA, **P < 0.01, ***P < 0.001. Arrowheads (A, D, F) indicate the crown root primordia; bars = 100 µm.
Figure 3
Figure 3
OsRopGEF10 negatively regulates cytokinin responses and affects the expression of OsRR6. A, The inhibitory effects of CPPU on crown root initiation in 7-day-old WT (Dongjin) and Osropgef10 seedlings. Black arrowheads indicate curling roots of Osropgef10. Bars = 2 cm. B, Comparison of crown root number between 7-day-old WT and mutant seedlings upon CPPU treatment. Data are means ± sd (n > 20 seedlings). Significant differences from WT were determined by Student’s t test, **P < 0.01, ***P < 0.001. C, The inhibitory effects of CPPU on crown root initiation in 7-day-old WT (Zhonghua11, ZH11) and two OE lines. D, Relative number of crown roots in 7-day-old WT (ZH11) and OE lines upon CPPU treatment compared with untreated seedlings (set to 100%). Data are means ± sd (n > 20 seedlings). Significant differences from WT were determined by two-way ANOVA, *P < 0.05, **P < 0.01, ***P < 0.001. ns, not significant. E and F, RT-qPCR analysis showing that OsRopGEF10 expression was induced in roots of 9-day-old seedlings by 5 μM 6-BA (E) and 10 μM NAA (F) treatment. Data are means ± sd (n =3). Significant differences were determined by one-way ANOVA, *P < 0.05, **P < 0.01. G–I, In situ hybridization assay showing OsRR6 transcripts in crown root primordia of WT (G) and Osropgef10 (H) and crown root initiation in sections probed with OsRR6 sense probe (I). Bars = 100 μm. Arrowheads indicate the crown root primordia.
Figure 4
Figure 4
OsRAC3 is activated by auxin and positively regulates crown root development. A, Auxin activates OsRAC3 in rice protoplasts. Protoplasts were incubated with 0.1 μM NAA at the indicated time before collection. GTP-bound activated mCherry-OsRAC3 and total mCherry-OsRAC3 were detected by immunoblotting with mCherry antibody. B, Relative level of activated OsRAC3 determined by ImageJ. Relative level of GTP-bound protein was normalized against the amount at 0 min. C, Comparison of phenotypes of the WT (ZH11, left), two DN-Osrac3 lines (middle), and two CA-Osrac3 lines (right) at 7 days after germination. Bars = 3 cm. D, Comparison of crown root number between 7-day-old WT and CA-Osrac3 plants. Data are means ± sd (n > 25). Significant differences were determined by one-way ANOVA. ns, not significant. *P < 0.05, **P < 0.01. E, Cross sections through the cotyledonary nodes of 7-day-old WT and Osrac3 mutant lines. Arrowheads indicate crown root primordia. Bar = 100 μm. F, Number of crown root primordia in 7-day-old WT and CA-Osrac3 seedlings. Data are means ± sd (n > 10). Significant differences were determined by Student’s t test, *P < 0.05. G, Relative number of crown roots in 7-day-old WT and Osrac3 seedlings upon CPPU treatment compared with untreated seedlings (set to 100%). Data are means ± sd (n > 20). Significant differences from WT were determined by two-way ANOVA, *P < 0.05, **P < 0.01; ***P < 0.001.
Figure 5
Figure 5
OsAHP1/2 interact with OsRopGEF10 and OsRAC3 and function as ROP effectors. A, Full-length OsRopGEF10A and the PRONE domain interact with OsAHP1 and OsAHP2 in Y2H assays; pGBK-T7 was used as the empty vector control. B, GST-tagged OsRopGEF10 (PRONE) pulls down OsAHP1-GFP and OsAHP2-GFP from 10-day-old 35Spro:AHP1/2-GFP transgenic plants. Lower panel shows total plant proteins stained with CBB. GST was used as a control. Arrowheads indicate GST and GST-PRONE. C and D, Co-IP of transiently expressed mCherry-OsRopGEF10 or mCherry-OsRAC3 proteins in protoplasts isolated from 10-day-old 35Spro:OsAHP1-GFP (C) or 35Spro:OsAHP2-GFP (D) transgenic plants. GFP antibody was used for IP; co-immunoprecipitated proteins were detected by mCherry antibody; OsAHPs-GFP was detected by GFP antibody. E, Pull-down of OsAHP1/2-GFP from 10-day-old 35Spro:OsAHPs-GFP transgenic plants by MBP-OsRAC3, MBP-CA-Osrac3, and MBP-DN-Osrac3. GFP antibodies were used in these blots. CBB-stained gels show comparable amounts of bait usage. MBP (first lane in each panel) was used as a control. Relative signal intensities are shown in blue numbers; the amount of DN-Osrac3 was set to 1. F, Pull-down of OsAHP1/2-GFP from 10-day-old transgenic plants by MBP-OsRAC3 and GTP- or GDP-saturated MBP-OsRAC3. GFP antibodies were used in these blots. CBB-stained gels showing comparable amounts of bait usage are shown. MBP (first lane for each panel) was used as controls. Relative signal intensities are shown in number: the amount of GDP-bound OsRac3 was set to 1.
Figure 6
Figure 6
BiFC assays of the interactions between OsRopGEF10, OsRAC3, and OsAHP1/2 in rice protoplasts. A–C, nYFP-OsRopGEF10 (A), nYFP-OsRAC3 (B), and cYFP-OsOsAHP1 (C) co-expressed with nYFP or cYFP did not generate visible signal as negative controls. D, Co-expression of the constructs nYFP-OsRopGEF10 and cYFP-OsRAC3 showing that interactions occurred on the cell membrane. E–H, Co-expression of construct pairs nYFP-OsRopGEF10 and cYFP-OsAHP1/2 (E, F) or nYFP-OsRAC3 and cYFP-OsAHP1/2 (G, H) generated YFP signals. I–L, Co-expression of nYFP-CA-Osrac3 and cYFP-OsAHP1/2 (I, J) generated stronger signals as the PM, whereas co-expression of nYFP-DN-Osrac3 and cYFP-OsAHP1/2 generated very weak signals at the PM (K, L). M, Quantitative comparison of fluorescence intensity generated by DN-Osrac3, WT OsRAC3, or CA-Osrac3 with OsAHP1/2. The fluorescence intensity was determined by ImageJ and relative fluorescence intensity was normalized against DN-Osrac3/OsAHP pairs. Data are means ± sd (n = 10). Significant differences from DN-Osrac3 were determined by two-way ANOVA. ****P < 0.0001. Bars (A–L) = 5 μm.
Figure 7
Figure 7
BiFC assays of the interactions between mutated RopGEF10 and OsRAC3 or OsAHPs. A, BiFC assays of the interaction of OsRopGEF10 with OsRAC3 and OsAHP1/2 co-localized with the membrane marker PIP2-mCherry. As indicated by PIP2-mCherry signals, OsRopGEF10 and OsAHP1/2 interactions occur in patches at the cell surface, whereas OsRAC3 and OsAHP1/2 interactions occur on the membrane, precisely colocalizing with PIP2-mCherry. B–G, Localization of mCherry-OsRAC3 (B), mCherry-OsRopGEF10 (C), mCherry-Osropgef10-E442A (D), and mCherry-Osropgef10-E442A colocalized with DAPI signal (E) and OsAHP1/2-GFP (F, G) when expressed alone in rice protoplasts. H and I, nYFP-OsRopGEF10 interacted with cYFP-OsRAC3 at the PM (H), but nYFP-Osropgef10-E442A failed to interact with cYFP-OsRAC3 (I). J and K, The interaction of nYFP-OsRopGEF10 with cYFP-OsAHP1 generated BIFC signals (J), whereas co-expression of the constructs nYFP-Osropgef10-E442A and cYFP-OsAHP1 failed to generate BiFC signals (K). L and M, The interaction of nYFP-OsRopGEF10 with cYFP-OsAHP2 generated BIFC signals (L), whereas co-expression of the constructs nYFP-Osropgef10-E442A and cYFP-OsAHP2 failed to generate BiFC signals (M). Bars = 5 μm.
Figure 8
Figure 8
The OsRopGEF10–OsRAC3 module targets OsAHP proteins to regulate crown root development in rice. A, Co-expression of Myc-CA-Osrac3 or empty vector (Control) with OsAHP1/2-GFP in rice protoplasts. The CA-Osrac3 image panels show two representative categories of protoplasts. Scale bars = 10 µm. B, Quantitative analysis of the ratio of cortical cytoplasm signal (CC) to nucleus-localized signal (N) showing that co-expression of activated OsRAC3 reduced OsAHP1/2-GFP signal in the nuclei. Data are means ± sd (n > 15). Significant differences were detected by Student’s t test, ****P < 0.0001. C, Root morphology of 7-day-old WT, Osahp1 Osahp2-cas9 lines (L1 and L5), and Osahp1 Osahp2-L5 Osropgef10 triple mutant seedlings. Bar = 2 cm. Magenta arrowheads indicate crown roots; white arrowheads indicate lateral roots. D, Comparison of crown root number of WT, Osahp1 Osahp2-L1, Osahp1 Osahp2-L5, Osahp1 Osahp2-L5 Osropgef10 triple mutant, and Osropgef10 seedlings. Data are means ± sd (n > 20 seedlings). Significant differences were determined by one-way ANOVA, ns, not significant, **P < 0.01, ***P < 0.001. E, A proposed working model for OsRopGEF10-regulated crown root development in rice. Auxin activates ROP signaling and the OsRopGEF10–OsRAC3 module recruits OsAHPs to the PM to counteract cytokinin signaling to promote crown root initiation. The OsRopGEF10–OsRAC3 module integrates auxin and cytokinin signaling to regulate crown root development by the OsAHP node.

Similar articles

Cited by

References

    1. Akamatsu A, Wong HL, Fujiwara M, Okuda J, Nishide K, Uno K, Imai K, Umemura K, Kawasaki T, Kawano Y, et al. (2013) An OsCEBiP/OsCERK1–OsRacGEF1–OsRac1 module is an essential early component of chitin-induced rice immunity. Cell Host Microbe 13: 465–476 - PubMed
    1. Argueso CT, Ferreira FJ, Kieber JJ (2009) Environmental perception avenues: the interaction of cytokinin and environmental response pathways. Plant Cell Environ 32: 1147–1160 - PubMed
    1. Argyros RD, Mathews DE, Chiang YH, Palmer CM, Thibault DM, Etheridge N, Argyros DA, Mason MG, Kieber JJ, Schaller GE (2008) Type B response regulators of Arabidopsis play key roles in cytokinin signaling and plant development. Plant Cell 20: 2102–2116 - PMC - PubMed
    1. Berken A, Wittinghofer A (2008) Structure and function of Rho-type molecular switches in plants. Plant Physiol Biochem 46: 380–393 - PubMed
    1. Berken A, Thomas C, Wittinghofer A (2005) A new family of RhoGEFs activates the Rop molecular switch in plants. Nature 436: 1176–1180 - PubMed

Publication types

MeSH terms

LinkOut - more resources