

Parasitemia Levels in Trypanosoma cruzi Infection in Spain, an Area Where the Disease Is Not Endemic: Trends by Different Molecular Approaches
- PMID: 36190410
- PMCID: PMC9603785
- DOI: 10.1128/spectrum.02628-22
Parasitemia Levels in Trypanosoma cruzi Infection in Spain, an Area Where the Disease Is Not Endemic: Trends by Different Molecular Approaches
Abstract
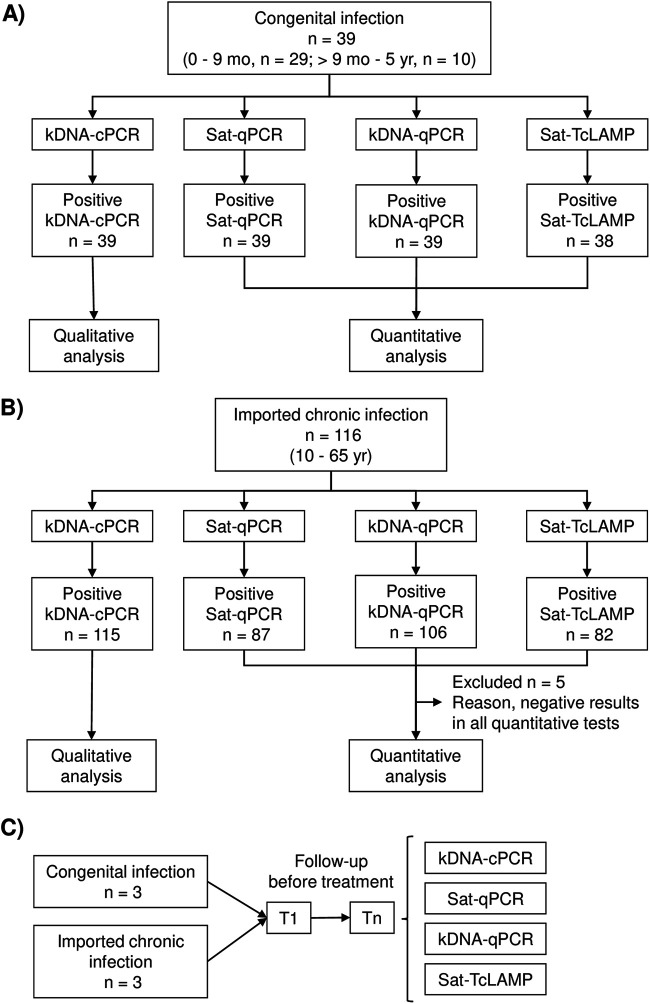
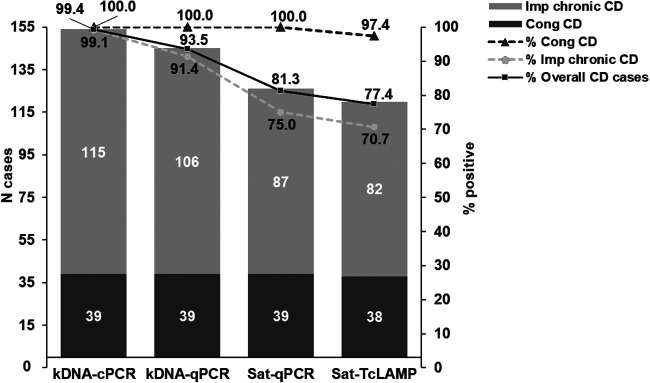
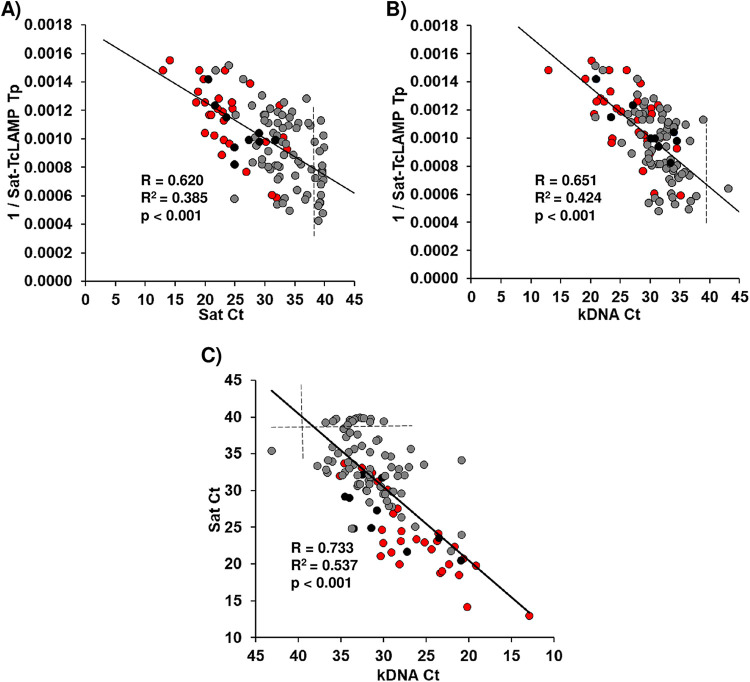
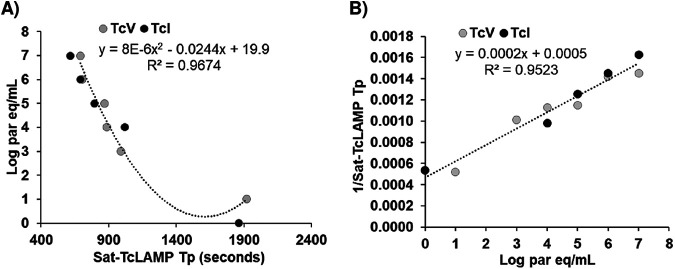
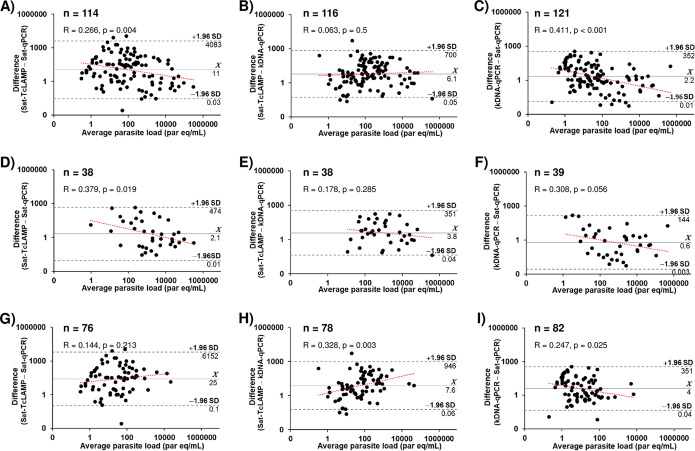
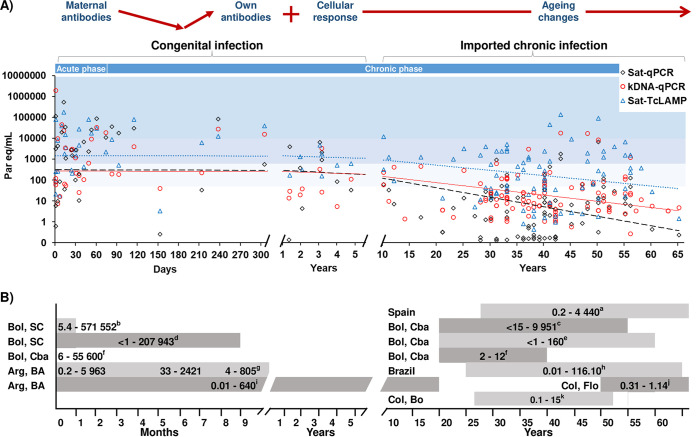
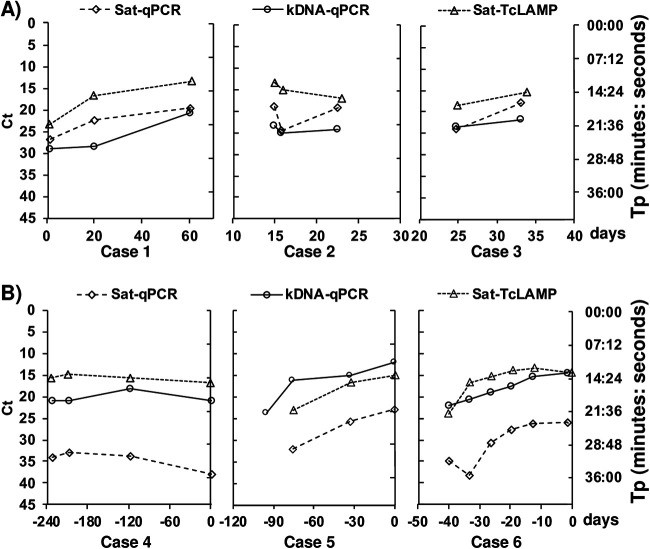
Trypanosoma cruzi infection has expanded globally through human migration. In Spain, the mother-to-child route is the mode of transmission contributing to autochthonous Chagas disease (CD); however, most people acquired the infection in their country of origin and were diagnosed in the chronic phase (imported chronic CD). In this context, we assessed the quantitative potential of the Loopamp Trypanosoma cruzi detection kit (Sat-TcLAMP) based on satellite DNA (Sat-DNA) to determine parasitemia levels compared to those detected by real-time quantitative PCRs (qPCRs) targeting Sat-DNA (Sat-qPCR) and kinetoplast DNA minicircles (kDNA-qPCR). This study included 173 specimens from 39 autochthonous congenital and 116 imported chronic CD cases diagnosed in Spain. kDNA-qPCR showed higher sensitivity than Sat-qPCR and Sat-TcLAMP. According to all quantitative approaches, parasitemia levels were significantly higher in congenital infection than in chronic CD (1 × 10⁻¹ to 5 × 10⁵ versus >1 × 10⁻¹ to 6 × 10³ parasite equivalents/mL, respectively [P < 0.001]). Sat-TcLAMP, Sat-qPCR, and kDNA-qPCR results were equivalent at high levels of parasitemia (P = 0.381). Discrepancies were significant for low levels of parasitemia and older individuals. Differences between Sat-TcLAMP and Sat-qPCR were not qualitatively significant, but estimations of parasitemia using Sat-TcLAMP were closer to those by kDNA-qPCR. Parasitemia changes were assessed in 6 individual cases in follow-up, in which trends showed similar patterns by all quantitative approaches. At high levels of parasitemia, Sat-TcLAMP, Sat-qPCR, and kDNA-qPCR worked similarly, but significant differences were found for the low levels characteristic of late chronic CD. A suitable harmonization strategy needs to be developed for low-level parasitemia detection using Sat-DNA- and kDNA-based tests. IMPORTANCE Currently, molecular equipment has been introduced into many health care centers, even in low-income countries. PCR, qPCR, and loop-mediated isothermal amplification (LAMP) are becoming more accessible for the diagnosis of neglected infectious diseases. Chagas disease (CD) is spreading worldwide, and in countries where the disease is not endemic, such as Spain, the parasite Trypanosoma cruzi is transmitted from mother to child (congenital CD). Here, we explore why LAMP, aimed at detecting T. cruzi parasite DNA, is a reliable option for the diagnosis of congenital CD and the early detection of reactivation in chronic infection. When the parasite load is high, LAMP is equivalent to any qPCR. In addition, the estimations of T. cruzi parasitemia in patients living in Spain, a country where the disease is not endemic, resemble natural evolution in areas of endemicity. If molecular tests are introduced into the diagnostic algorithm for congenital infection, early diagnosis and timely treatment would be accomplished, so the interruption of vertical transmission can be an achievable goal.
Keywords: Chagas disease; LAMP; Trypanosoma cruzi; acute reactivation; chronic infection; congenital infection; molecular diagnosis; parasite load; parasitemia quantification; qPCR.
Conflict of interest statement
The authors declare no conflict of interest.
Figures


Similar articles
-
Mitochondrial and satellite real time-PCR for detecting T. cruzi DTU II strain in blood and organs of experimentally infected mice presenting different levels of parasite load.Exp Parasitol. 2019 May;200:13-15. doi: 10.1016/j.exppara.2019.03.007. Epub 2019 Mar 20. Exp Parasitol. 2019. PMID: 30904696 Review.
-
Towards the establishment of a consensus real-time qPCR to monitor Trypanosoma cruzi parasitemia in patients with chronic Chagas disease cardiomyopathy: a substudy from the BENEFIT trial.Acta Trop. 2013 Jan;125(1):23-31. doi: 10.1016/j.actatropica.2012.08.020. Epub 2012 Sep 12. Acta Trop. 2013. PMID: 22982466
-
Development of conventional and real-time multiplex PCR-based assays for estimation of natural infection rates and Trypanosoma cruzi load in triatomine vectors.Parasit Vectors. 2017 Aug 29;10(1):404. doi: 10.1186/s13071-017-2343-x. Parasit Vectors. 2017. PMID: 28851417 Free PMC article.
-
Analytical Validation of Quantitative Real-Time PCR Methods for Quantification of Trypanosoma cruzi DNA in Blood Samples from Chagas Disease Patients.J Mol Diagn. 2015 Sep;17(5):605-15. doi: 10.1016/j.jmoldx.2015.04.010. J Mol Diagn. 2015. PMID: 26320872 Free PMC article.
-
Molecular diagnosis of Trypanosoma cruzi.Acta Trop. 2018 Aug;184:59-66. doi: 10.1016/j.actatropica.2018.02.019. Epub 2018 Feb 21. Acta Trop. 2018. PMID: 29476727 Review.
Cited by
-
Molecular diagnosis of Chagas disease: a systematic review and meta-analysis.Infect Dis Poverty. 2023 Oct 16;12(1):95. doi: 10.1186/s40249-023-01143-7. Infect Dis Poverty. 2023. PMID: 37845734 Free PMC article.
References
-
- Bayona-i-Carrasco J, Avila-Tàpies R. 2020. Latin Americans and Caribbeans in Europe: a cross-country analysis. Int Migr 58:198–218. doi:10.1111/imig.12565. - DOI
-
- BOE, Ministerio de Sanidad y Consumo. 2005. Real decreto 1088/2005, de 16 de Septiembre, por el que se establecen los requisitos técnicos y condiciones mínimas de la hemodonación y de los centros y servicios de transfusión. BOE, Ministerio de Sanidad y Consumo, Madrid, Spain. https://www.boe.es/boe/dias/2005/09/20/pdfs/A31288-31304.pdf. Accessed 31 March 2022.
-
- Grupo de Estudio de la Infección en el Trasplante, Sociedad Española de Enfermedades Infecciosas y Microbiología Clínica, Organización Nacional de Trasplantes. 2019. Documento de consenso del Grupo de Estudio de la Infección en el Trasplante (GESITRA) perteneciente a la Sociedad Española de Enfermedades Infecciosas y Microbiología Clínica (SEIMC) y la Organización Nacional de Trasplantes (ONT) sobre los criterios de selección del donante de órganos sólidos en relación a las enfermedades infecciosas. http://www.ont.es/infesp/DocumentosDeConsenso/GESITRA_ONT_SEIMC_WEB_mayo.... Accessed 31 March 2022.
-
- Abras A, Ballart C, Fernández-Arévalo A, Pinazo M-J, Gascón J, Muñoz C, Gállego M. 2022. Worldwide control and management of Chagas disease in a new era of globalization: a close look at congenital Trypanosoma cruzi infection. Clin Microbiol Rev 35:e00152-21. doi:10.1128/cmr.00152-21. - DOI - PMC - PubMed
Publication types
MeSH terms
Substances
LinkOut - more resources
Full Text Sources
Medical
Research Materials
