Association of UV Radiation Exposure, Diagnostic Scrutiny, and Melanoma Incidence in US Counties
- PMID: 36190719
- PMCID: PMC9531098
- DOI: 10.1001/jamainternmed.2022.4342
Association of UV Radiation Exposure, Diagnostic Scrutiny, and Melanoma Incidence in US Counties
Abstract
Importance: Although UV radiation exposure is the conventionally reported risk factor for cutaneous melanoma, an alternative exposure is diagnostic scrutiny: the more physicians look for and biopsy moles, the more melanoma they find.
Objective: To assess the association of proxies for UV radiation exposure and diagnostic scrutiny with geographical patterns of melanoma incidence.
Design, setting, and participants: This was a cross-sectional ecological analysis of the 727 continental US counties reporting to the Surveillance, Epidemiology, and End Results (SEER) Program (among a total of 3108 counties). Environmental data relevant to UV radiation exposure (from a variety of sources), Health Resources and Services Administration data relevant to diagnostic scrutiny, and SEER data on melanoma incidence among the non-Hispanic White population diagnosed with melanoma from 2012 through 2016 were combined. Data analysis was performed between January 2020 and July 2022.
Exposures: Three UV radiation proxies (UV daily dose, cloud variability, and temperature variability) and 3 diagnostic scrutiny proxies (median household income, dermatologists, and primary care physician supply).
Main outcomes and measures: Melanoma incidence (in situ and invasive cancers).
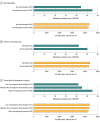
Results: In total, 235 333 melanomas were diagnosed. Proxies for UV radiation exposure changed gradually across geography, while melanoma incidence and proxies for diagnostic scrutiny changed abruptly across contiguous counties. The UV daily dose, a variable the National Cancer Institute specifically developed for melanoma analyses, was uncorrelated with incidence (r = 0.03; P = .42). For context, smoking prevalence was highly correlated with lung cancer incidence in the same counties (r = 0.81; P < .001). Melanoma incidence was correlated with median household income (r = 0.43; P < .001). Counties with no dermatologists and shortages of primary care physicians had the lowest incidence, while counties amply supplied with both had the highest, despite having lower mean UV daily dose. There was little association between melanoma incidence and melanoma mortality (r = 0.09; P = .05), while the analogous association in lung cancer was strong (r = 0.96; P < .001).
Conclusions and relevance: In this cross-sectional ecological study, the current geographical pattern of melanoma incidence across US counties was less associated with proxies for UV radiation exposure and more so with proxies for diagnostic scrutiny. Incidence-the fundamental epidemiologic measure of disease frequency-now had little association with the feared outcome of melanoma: death.
Conflict of interest statement
Figures


Comment in
-
Melanoma Incidence by Sex, Indoor Tanning, and Body Site.JAMA Intern Med. 2023 Apr 1;183(4):390. doi: 10.1001/jamainternmed.2022.6737. JAMA Intern Med. 2023. PMID: 36780181 No abstract available.
-
Melanoma Incidence by Sex, Indoor Tanning, and Body Site-Reply.JAMA Intern Med. 2023 Apr 1;183(4):390-391. doi: 10.1001/jamainternmed.2022.6734. JAMA Intern Med. 2023. PMID: 36780182 No abstract available.
Similar articles
-
Examining the relationship between incidence and mortality for commonly diagnosed cancers in the USA: an observational study using population-based SEER database.BMJ Open. 2025 Feb 7;15(2):e084955. doi: 10.1136/bmjopen-2024-084955. BMJ Open. 2025. PMID: 39920045 Free PMC article.
-
Association of UV index, latitude, and melanoma incidence in nonwhite populations--US Surveillance, Epidemiology, and End Results (SEER) Program, 1992 to 2001.Arch Dermatol. 2005 Apr;141(4):477-81. doi: 10.1001/archderm.141.4.477. Arch Dermatol. 2005. PMID: 15837865
-
Higher melanoma incidence in coastal versus inland counties in California.Melanoma Res. 2014 Jun;24(3):280-5. doi: 10.1097/CMR.0000000000000067. Melanoma Res. 2014. PMID: 24681542
-
Optimal surveillance strategies for patients with stage 1 cutaneous melanoma post primary tumour excision: three systematic reviews and an economic model.Health Technol Assess. 2021 Nov;25(64):1-178. doi: 10.3310/hta25640. Health Technol Assess. 2021. PMID: 34792018
-
Cutaneous Melanoma: Sheep in Wolves Clothing?Anticancer Res. 2022 Oct;42(10):5021-5025. doi: 10.21873/anticanres.16010. Anticancer Res. 2022. PMID: 36191966 Review.
Cited by
-
Assessment of the Influence of UVR in Cutaneous Melanoma.Photodermatol Photoimmunol Photomed. 2025 May;41(3):e70024. doi: 10.1111/phpp.70024. Photodermatol Photoimmunol Photomed. 2025. PMID: 40396496 Free PMC article. Review.
-
Changes in skin cancer screening rates in the United States from 2005 to 2015.J Am Acad Dermatol. 2023 Jul;89(1):142-145. doi: 10.1016/j.jaad.2023.02.011. Epub 2023 Feb 18. J Am Acad Dermatol. 2023. PMID: 36804574 Free PMC article. No abstract available.
-
Examining the relationship between incidence and mortality for commonly diagnosed cancers in the USA: an observational study using population-based SEER database.BMJ Open. 2025 Feb 7;15(2):e084955. doi: 10.1136/bmjopen-2024-084955. BMJ Open. 2025. PMID: 39920045 Free PMC article.
-
Effect of Telenursing on Supportive Care Needs in Patients with Melanoma and Lung Cancer on Targeted Therapies: A Randomised Controlled Trial Study Protocol.Methods Protoc. 2024 Oct 3;7(5):78. doi: 10.3390/mps7050078. Methods Protoc. 2024. PMID: 39452792 Free PMC article.
-
Beneficial health effects of ultraviolet radiation: expert review and conference report.Photochem Photobiol Sci. 2025 Jun;24(6):867-893. doi: 10.1007/s43630-025-00743-6. Epub 2025 Jun 4. Photochem Photobiol Sci. 2025. PMID: 40465176 Review.
References
-
- Howlader N, Noone AM, Krapcho M, et al. , eds. SEER Cancer Statistics Review, 1975-2017. National Cancer Institute; April 2020. Accessed September 6, 2022. https://seer.cancer.gov/archive/csr/1975_2017/browse_csr.php?sectionSEL=...

