. 2022 Oct 3;18(10):e1010314.
doi: 10.1371/journal.pgen.1010314. eCollection 2022 Oct.

A pals-25 gain-of-function allele triggers systemic resistance against natural pathogens of C. elegans

Affiliations

A pals-25 gain-of-function allele triggers systemic resistance against natural pathogens of C. elegans

Spencer S Gang et al. PLoS Genet. .

Abstract

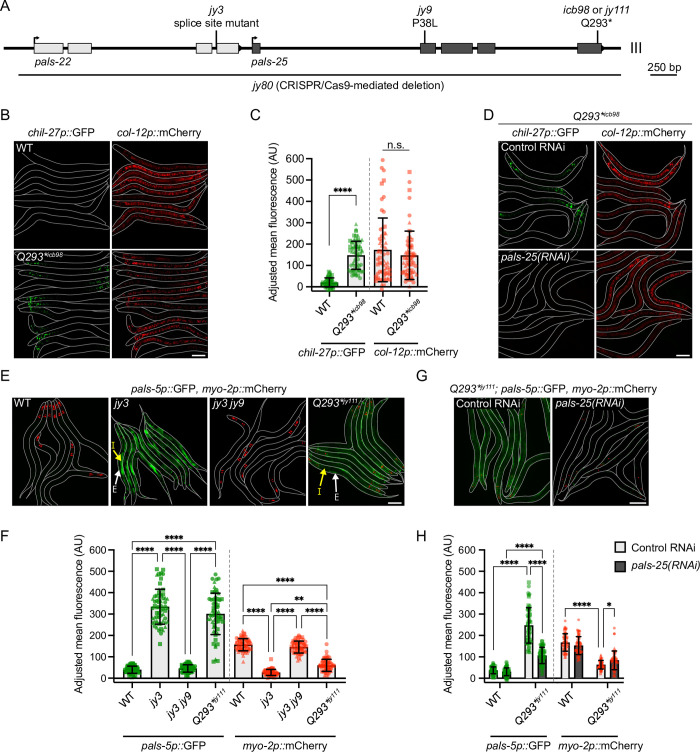
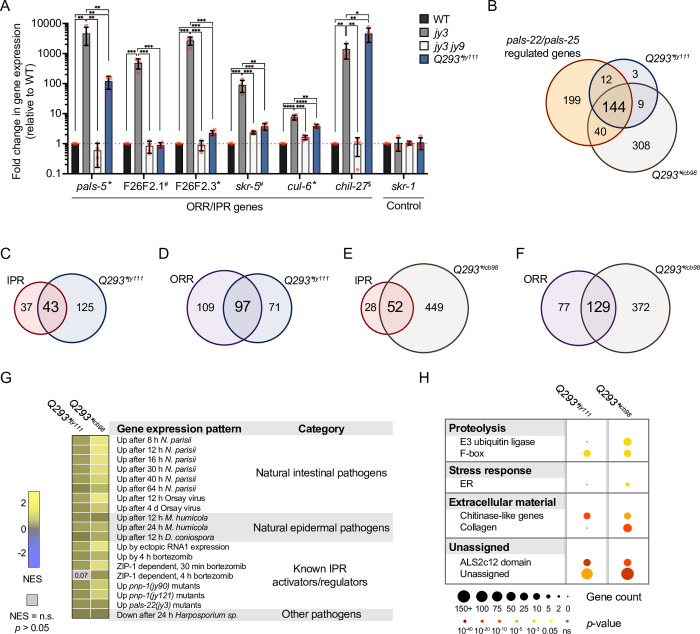
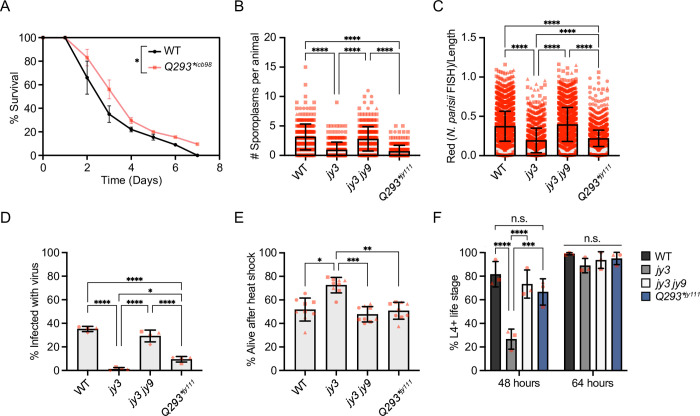
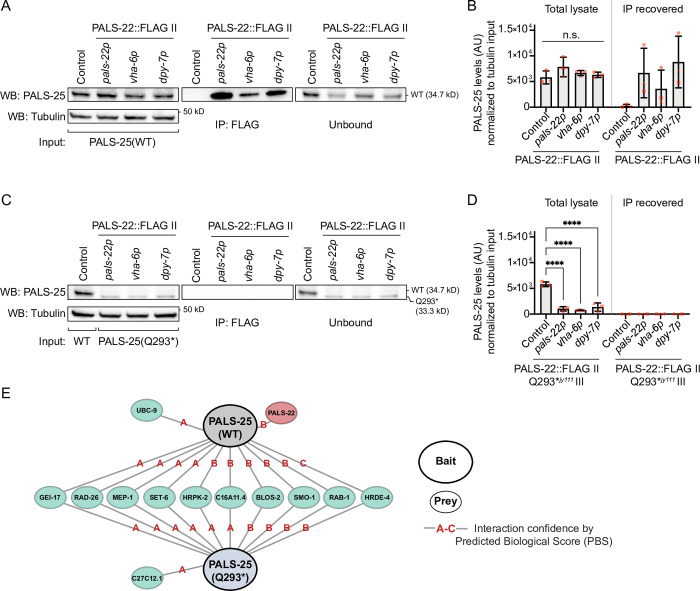
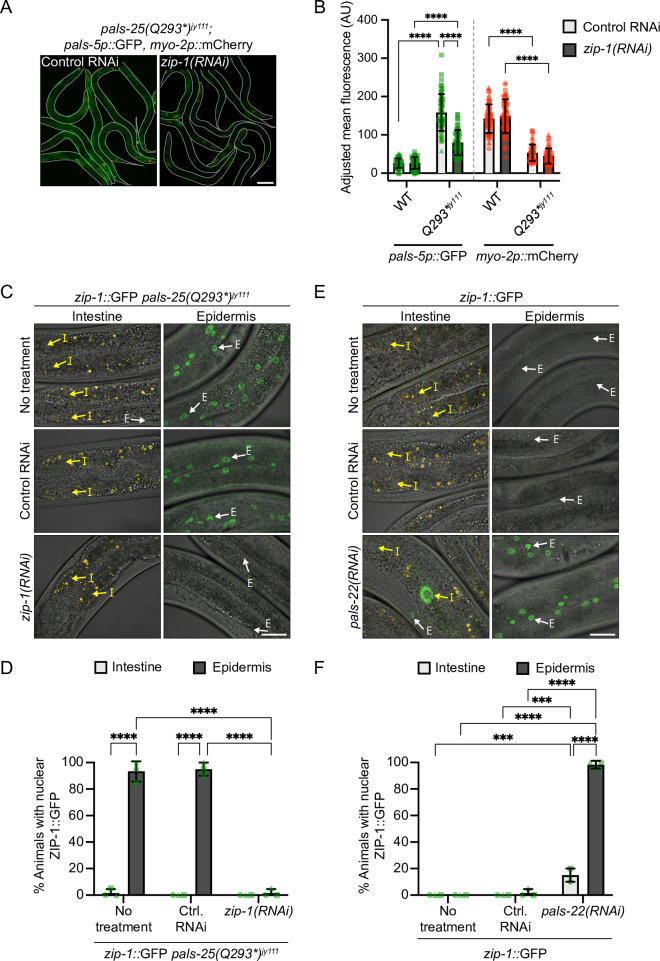
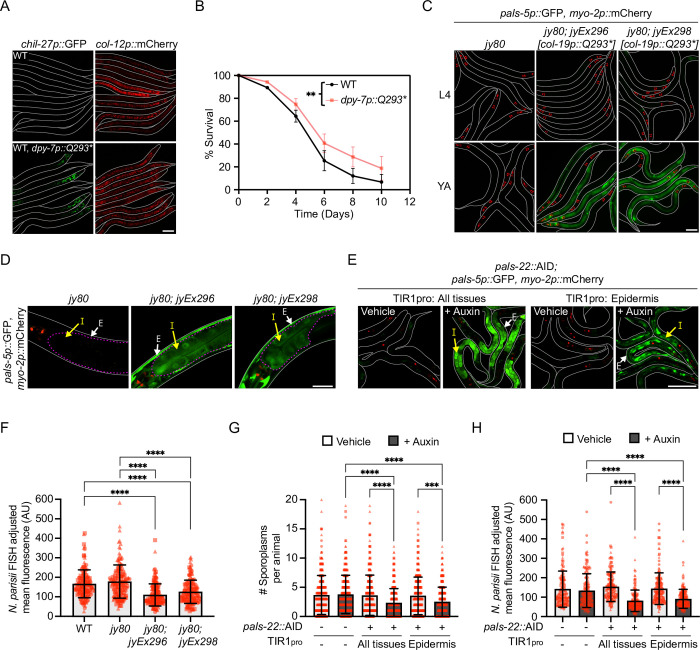
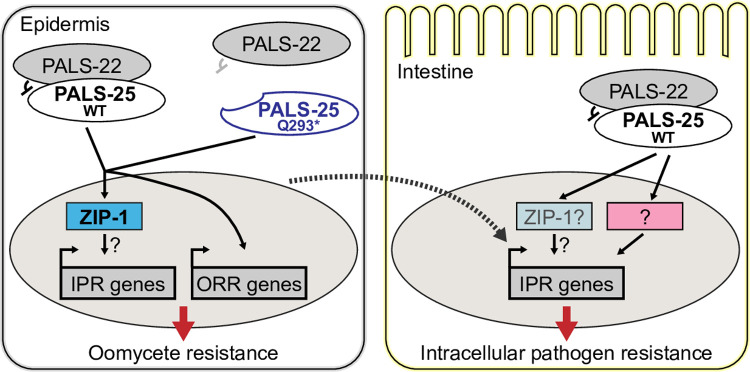
Regulation of immunity throughout an organism is critical for host defense. Previous studies in the nematode Caenorhabditis elegans have described an "ON/OFF" immune switch comprised of the antagonistic paralogs PALS-25 and PALS-22, which regulate resistance against intestinal and epidermal pathogens. Here, we identify and characterize a PALS-25 gain-of-function mutant protein with a premature stop (Q293*), which we find is freed from physical repression by its negative regulator, the PALS-22 protein. PALS-25(Q293*) activates two related gene expression programs, the Oomycete Recognition Response (ORR) against natural pathogens of the epidermis, and the Intracellular Pathogen Response (IPR) against natural intracellular pathogens of the intestine. A subset of ORR/IPR genes is upregulated in pals-25(Q293*) mutants, and they are resistant to oomycete infection in the epidermis, and microsporidia and virus infection in the intestine, but without compromising growth. Surprisingly, we find that activation of PALS-25 seems to primarily stimulate the downstream bZIP transcription factor ZIP-1 in the epidermis, with upregulation of gene expression in both the epidermis and in the intestine. Interestingly, we find that PALS-22/25-regulated epidermal-to-intestinal signaling promotes resistance to the N. parisii intestinal pathogen, demonstrating cross-tissue protective immune induction from one epithelial tissue to another in C. elegans.


Conflict of interest statement

The authors have declared that no competing interests exist.

Figures

Fig 1
Fig 1. A gain-of-function allele of pals-25 activates immune responses in the absence of infection.
A) The pals-22 and pals-25 gene coding structure, which comprises an operon. pals-22 exons are shown in light grey boxes and pals-25 exons are dark grey, UTR regions not shown. Positions of mutant alleles in this study are indicated and residues altered are described in S2 Table. Due to space constraints, pals-22(jy3) and pals-25(jy9, jy111 and icb98) allele names will be used without gene names in this and subsequent figures. icb98 and jy111 are independently isolated pals-25 gain-of-function alleles with the same Q293* mutation, and will be designated in figures as Q293*icb98 and Q293*jy111, respectively. B) pals-25(Q293*)icb98 mutants show upregulated expression of chil-27p::GFP compared to wild-type (WT) in the absence of infection. col-12p::mCherry is part of the same transgene and is constitutively expressed in both WT and pals-25(Q293*)icb98. L4 animals are shown, with lines denoting the outline of the body. C) Quantification of chil-27p::GFP and col-12p::mCherry mean fluorescence signal normalized to body area at L4. pals-25(Q293*)icb98 mutants exhibit chil-27p::GFP induction that is significantly different from WT. Mann-Whitney test with each reporter analyzed independently. D) Expression of chil-27p::GFP in pals-25(Q293*)icb98 is lost upon treatment with pals-25 RNAi. L4 animals are shown. E) pals-22(jy3) and pals-25(Q293*)jy111 mutants show constitutive expression of pals-5p::GFP. myo-2p::mCherry is part of the same transgene and is constitutively expressed in the pharynx of transgenic animals at all life stages. pals-22(jy3) mutants show pals-5p::GFP expression in both the intestine and epidermis while pals-25(Q293*)jy111 mutants show expression more prominently in the epidermis. Yellow arrows indicate intestinal tissue (I) and white arrows indicate epidermal tissue (E). L4s are shown for all genotypes. F) Quantification of pals-5p::GFP and myo-2p::mCherry mean fluorescence signal normalized to body area at L4. pals-22(jy3) and pals-25(Q293*)jy111 mutants exhibit both pals-5p::GFP induction, and transgene silencing as measured by myo-2p::mCherry fluorescence, which is significantly different from WT. Kruskal-Wallis test with Dunn’s multiple comparisons test with each reporter analyzed independently. G) Expression of pals-5p::GFP in pals-25(Q293*)jy111 mutants is suppressed upon treatment with pals-25 RNAi. L4s animals are shown. H) Quantification of pals-5p::GFP and myo-2p::mCherry mean fluorescence signal normalized to body area at L4 for different RNAi treatments. Two-way ANOVA with Sidak’s multiple comparisons test with each reporter analyzed independently. For C, F and H, n = 60 animals per genotype or treatment, three experimental replicates. Symbols represent fluorescence measurements for individual animals and different symbol shapes represent animals from experimental replicates performed on different days. Bar heights indicate mean values and error bars represent standard deviations. **** p < 0.0001, ** p < 0.01, * p < 0.05. For B, D, E and G scale bar = 100 μm.
Fig 2
Fig 2. A subset of immune response genes is upregulated in pals-25(Q293*) mutants.
A) qRT-PCR of select ORR and IPR genes. * = Gene belongs to ORR and IPR, # = Gene belongs to only IPR, $ = Gene belongs to only ORR. The results shown are fold change in gene expression relative to WT. **** p < 0.0001, *** p < 0.001, ** p < 0.01, * p < 0.05, One-tailed t-test. n = 4 independent experimental replicates, different symbol shapes represent the expression values for replicates performed on different days. Bar heights indicate mean values and error bars represent standard deviations. B) Upregulated genes in both pals-25(Q293*)jy111 and pals-25(Q293*)icb98 mutants have significant overlap with genes regulated by wild-type pals-22 and pals-25. Hypergeometric test, RF = 34.5; p < 5.39e-243 and RF = 15.6; p < 1.994e-182 for pals-25(Q293*)jy111 and pals-25(Q293*)icb98, respectively. C-D) Upregulated genes in pals-25(Q293*)jy111 mutants have significant overlap with the IPR and ORR. Hypergeometric test, IPR: RF = 46.9; p < 6.215e-64, ORR: RF = 41.1; p < 6.883e-144. E-F) Upregulated genes in pals-25(Q293*)icb98 mutants have significant overlap with the IPR and ORR. Hypergeometric test, IPR: RF = 21.8; p < 4.529e-60, ORR: RF = 21; p < 5.122e-148. G) Correlation of differentially expressed genes in pals-25(Q293*)jy111 and pals-25(Q293*)icb98 mutants with those expressed during pathogen infection and regulated by known activators of the IPR. Correlation of gene sets quantified as Normalized Enrichment Score (NES) as defined by GSEAPreranked module analysis (Materials and Methods). Blue indicates significant correlation of downregulated genes in pals-25(Q293*)jy111 or pals-25(Q293*)icb98 mutants with the gene sets tested, and yellow indicates significant correlation of upregulated genes in pals-25(Q293*)jy111 or pals-25(Q293*)icb98 mutants with the gene sets tested. Grey indicates no significant correlation (p > 0.05 or False Discovery Rate > 0.25). GSEA analysis of 93 gene sets tested can be found in S7 Table. H) WormCat analysis shows significantly enriched gene categories represented in upregulated genes of pals-25(Q293*)jy111 and pals-25(Q293*)icb98 mutants. Bold text indicates broad “Category 1” biological processes enriched while nested text indicates more specific “Category 2 or 3” processes enriched. p values were determined using Fisher’s exact test with Bonferroni correction from minimum hypergeometric scores calculated in the WormCat software. A summary of WormCat analysis can be found in S8 Table.
Fig 3
Fig 3. pals-25(Q293*) mutants have increased resistance to natural pathogens but not increased resistance to proteotoxic stress, nor developmental delay.
A) pals-25(Q293*)icb98 mutants have increased survival upon infection with M. humicola as compared to WT animals at 25°C. Log-rank test. n = 270 animals per genotype, 90 animals per replicate across three experimental replicates. B-C) pals-22(jy3) and pals-25(Q293*)jy111 mutants exhibit resistance to N. parisii compared to WT at 3 hours post infection (hpi) (B) and 30 hpi (C). Kruskal-Wallis test with Dunn’s multiple comparisons test. 3 hpi: n = 300 animals per genotype, three experimental replicates. Symbols represent the number of N. parisii sporoplasms infecting an individual animal, as determined by N. parisii-specific fluorescent FISH signal. 30 hpi: n = WT: 2,972, pals-22(jy3): 1,151, pals-22(jy3) pals-25(jy9): 1,837, pals-25(Q293*)jy111: 3,204 animals, three experimental replicates. Symbols represent the infected area of individual worms by FISH fluorescent signal normalized to time-of-flight quantified on a COPAS Biosort machine. D) pals-22(jy3) and pals-25(Q293*)jy111 mutants exhibit resistance to Orsay virus compared to WT at 18 hpi. One-way ANOVA with Tukey’s multiple comparisons test. n = 4 experimental replicates, 100 animals scored in each replicate per genotype. E) pals-22(jy3) mutants exhibit increased survival compared to WT after 2 h of heat shock at 37.5°C, followed by 24 h at 20°C, but pals-25(Q293*)jy111 mutants do not. Kruskal-Wallis test with Dunn’s multiple comparisons test. n = 9 plates, 30 animals per plate, tested in triplicate. F) pals-22(jy3) mutants, but not pals-25(Q293*)jy111 mutants, exhibit developmental delay compared to WT. Two-way ANOVA with Sidak’s multiple comparisons test for simple effects within a timepoint. For A-F, **** p < 0.0001, *** p < 0.001, ** p < 0.01, * p < 0.05. For B-F, bar heights indicate mean values and error bars represent standard deviations. Different symbol shapes represent data points from assays performed on different days.
Fig 4
Fig 4. PALS-25(Q293*) protein is not physically associated with PALS-22 protein.
A) Co-immunoprecipitation (co-IP) of FLAG-tagged PALS-22 and Western blot (WB) analysis for PALS-25(WT) in different tissues. PALS-22::GFP::3xFLAG expressed from its endogenous promoter (pals-22p), intestinal promoter (vha-6p), or epidermal promoter (dpy-7p) captured by FLAG-IP interacts with endogenously expressed PALS-25(WT). A GFP::3xFLAG control expressed from the spp-5p promoter does not interact with PALS-25(WT). B) Quantification of PALS-25(WT) lysate levels and amount collected from IP for each sample, normalized to tubulin. PALS-25 lysate levels are similar for the strains used in A for co-IP/WB. p > 0.05, one-way ANOVA with Dunnett’s multiple comparisons test with respect to the GFP::FLAG control strain. n = 3 independent co-IP/WB experimental replicates. C) co-IP of FLAG-tagged PALS-22 expressed in different tissues, as described in A, and WB analysis for PALS-25(Q293*). PALS-22 captured by FLAG-IP does not interact with endogenously expressed PALS-25(Q293*). The GFP::3xFLAG control does not interact with PALS-25(Q293*). D) Quantification of PALS-25(WT) and PALS-25(Q293*) lysate levels and amount collected from IP for each sample, normalized to tubulin. PALS-25(Q293*) protein lysate levels are decreased relative to control for the strains used in C for co-IP/WB. **** p < 0.0001, one-way ANOVA with Dunnett’s multiple comparisons test to GFP::FLAG control strain. n = 3 independent co-IP/WB experimental replicates. E) Yeast two-hybrid analysis of PALS-25(WT) and PALS-25(Q293*) baits with interacting prey proteins from a proteome-wide screen. PALS-25(WT) interacts with PALS-22 but PALS-25(Q293*) does not. Lines indicate significant interaction between bait and prey. Red letters indicate confidence of interaction from A (highest) to C (lowest) as determined by Predicted Biological Score (PBS). A detailed description of PBS analysis and complete bait-prey interactions is listed in the Materials and Methods and S10 Table.
Fig 5
Fig 5. PALS-25(Q293*) and loss of PALS-22 both increase ZIP-1 nuclear localization in the epidermis.
A) Constitutive expression of pals-5p::GFP in pals-25(Q293*)jy111 mutants is suppressed upon treatment with zip-1 RNAi. L4s are shown, with lines denoting the outline of the body. Scale bar = 100 μm. B) Quantification of pals-5p::GFP and myo-2p::mCherry mean fluorescence signal normalized to body area for RNAi-treated L4s. Symbols represent fluorescence measurements for individual animals, n = 60 animals per treatment. C, D) ZIP-1::GFP is constitutively expressed in the epidermis but not the intestine of pals-25(Q293*)jy111 animals. E, F) ZIP-1::GFP is expressed in epidermal nuclei following pals-22 RNAi but rarely in intestinal nuclei, and almost never in untreated or control RNAi-treated worms. For C and E, yellow arrows highlight intestinal nuclei ‘I’ and white arrows highlight epidermal nuclei ‘E’. Images are a composite of differential interference contrast, GFP, and RFP fluorescence channels and auto-fluorescent intestinal gut granules appear as yellow signal. Scale bar = 20 μm. For B, D and F bar heights indicate mean values and error bars represent standard deviations. **** p < 0.0001, *** p < 0.001, two-way ANOVA with Sidak’s multiple comparisons test (for B, each reporter analyzed independently). For D and F, n = 3 experimental replicates, 20 animals per treatment and replicate assessed for both intestinal and epidermal ZIP-1::GFP expression for each replicate. Different symbols represent replicates performed on different days.
Fig 6
Fig 6. A PALS-22/25-mediated immune response in the epidermis triggers protective immunity in the epidermis and intestine.
A) Epidermal (dpy-7p)-specific expression of pals-25(Q293*) leads to constitutive expression of chil-27p::GFP. col-12p::mCherry is part of the same transgene and is constitutively expressed starting from the L4 stage. L4 animals are shown with lines denoting the outline of the body. Scale bar = 100 μm. B) dpy-7p::pals-25(Q293*) animals have increased survival upon infection with M. humicola as compared to WT animals at 20°C. ** p < 0.01, Log-rank test. n = 270 animals per genotype, 90 animals per replicate across three experimental replicates. C) Adult-specific expression of pals-25(Q293*) in the epidermis induces pals-5p::GFP expression. Staged L4 and young adult (YA) animals are shown for each genotype. Scale bar = 100 μm. D) Higher magnification imaging shows that epidermis-specific expression of pals-25(Q293*) in young adults induces pals-5p::GFP expression in both the epidermis (white arrows ‘E’) and intestine (yellow arrows ‘I’). Scale bar = 20 μm. Exposure time was set to optimize intestinal pals-5p::GFP expression (dashed magenta lines). E) Auxin-mediated depletion of PALS-22 in all tissues, or specifically in the epidermis, induces pals-5p::GFP expression in both the epidermis (white arrows ‘E’) and intestine (yellow arrows ‘I’). L1 animals treated with either auxin or vehicle control for 24 h at 20°C are shown. Scale bar = 50 μm. F) Epidermis-specific expression of pals-25(Q293*) results in increased resistance to N. parisii at 30 hpi of young adult animals compared to both WT and a pals-22 pals-25(jy80) background without the pals-25(Q293*) transgene. Kruskal-Wallis test with Dunn’s multiple comparisons test. n = 150 animals per genotype, three experimental replicates. Symbols represent N. parisii FISH fluorescence signal normalized to body area for individual worms; head regions excluded because of expression of the myo-2p::mCherry co-injection marker. G-H) Auxin-mediated depletion of PALS-22 in all tissues, or specifically in the epidermis, increases resistance to N. parisii at 3 hpi (G) or 30 hpi (H) when compared to vehicle control. Two-way ANOVA with Sidak’s multiple comparisons test. 3 hpi: n = 300 animals per genotype, three experimental replicates. Symbols represent the number of N. parisii sporoplasms that infected an individual animal, as determined by N. parisii-specific fluorescent FISH signal. 30 hpi: n = 150 animals per genotype, three experimental replicates. Symbols represent N. parisii FISH fluorescence signal normalized to body area for individual worms; head regions excluded because of expression of the myo-2p::mCherry co-injection marker. For F-H, bar heights indicate mean values and error bars represent standard deviations. Different symbol shapes represent animals from infections performed on different days. **** p < 0.0001, *** p < 0.001.
Fig 7
Fig 7. Model for PALS-22/25-mediated activation of the ORR and IPR.
PALS-25(WT) is normally repressed by PALS-22; in pals-22 mutants the ORR and IPR are induced and mutant animals are resistant to natural pathogens. In pals-25(Q293*)icb98 and pals-25(Q293*)jy111 mutants, PALS-25(Q293*) is constitutively released from repression by PALS-22 to induce the ORR, IPR, and resistance to natural pathogens. PALS-25(WT) or PALS-25(Q293*)-mediated induction of the IPR in the epidermis can signal cell non-autonomously to induce IPR gene expression and intracellular pathogen resistance in the intestine.

Similar articles

Cited by

References

    1. Jacobson A, Yang D, Vella M, Chiu IM. The intestinal neuro-immune axis: crosstalk between neurons, immune cells, and microbes. Mucosal Immunol. 2021;14(3):555–65. Epub 20210204. doi: 10.1038/s41385-020-00368-1 ; PubMed Central PMCID: PMC8075967. - DOI - PMC - PubMed
    1. Wani KA, Goswamy D, Irazoqui JE. Nervous system control of intestinal host defense in C. elegans. Curr Opin Neurobiol. 2020;62:1–9. Epub 20191129. doi: 10.1016/j.conb.2019.11.007 ; PubMed Central PMCID: PMC7255937. - DOI - PMC - PubMed
    1. Paus R, Theoharides TC, Arck PC. Neuroimmunoendocrine circuitry of the ’brain-skin connection’. Trends Immunol. 2006;27(1):32–9. Epub 20051102. doi: 10.1016/j.it.2005.10.002 . - DOI - PubMed
    1. Pavlovsky L, Friedman A. Pathogenesis of stress-associated skin disorders: exploring the brain-skin axis. Curr Probl Dermatol. 2007;35:136–45. doi: 10.1159/000106420 . - DOI - PubMed
    1. Hoffman C, Aballay A. Role of neurons in the control of immune defense. Curr Opin Immunol. 2019;60:30–6. Epub 20190519. doi: 10.1016/j.coi.2019.04.005 ; PubMed Central PMCID: PMC6800625. - DOI - PMC - PubMed

Publication types

MeSH terms

Substances