. 2022 Oct 11;119(41):e2206986119.
doi: 10.1073/pnas.2206986119. Epub 2022 Oct 3.

A single helix repression domain is functional across diverse eukaryotes

Affiliations

A single helix repression domain is functional across diverse eukaryotes

Alexander R Leydon et al. Proc Natl Acad Sci U S A. .

Abstract

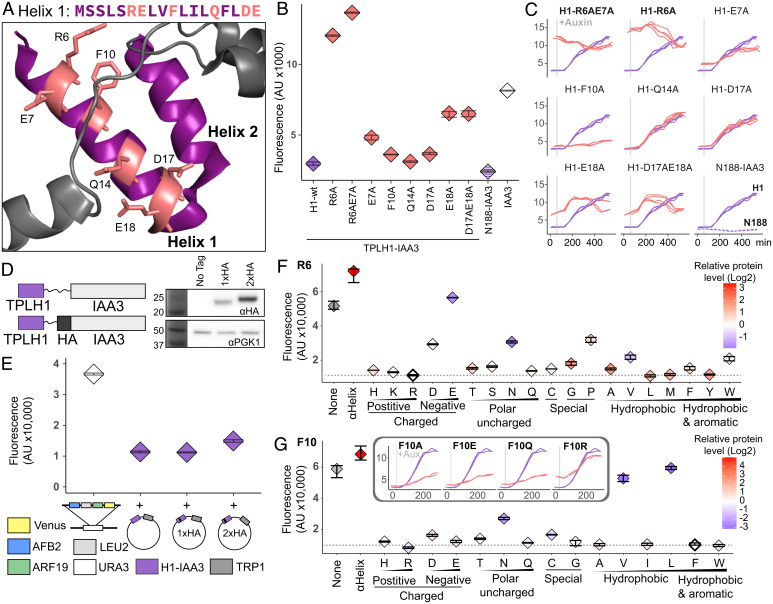
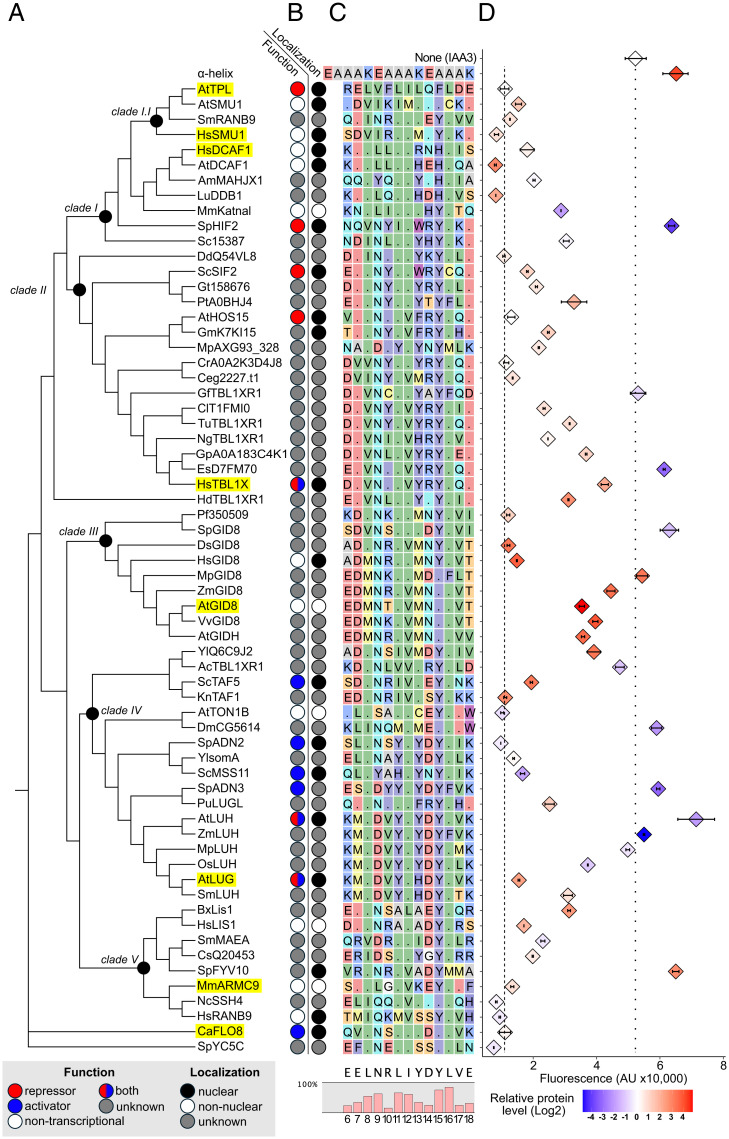
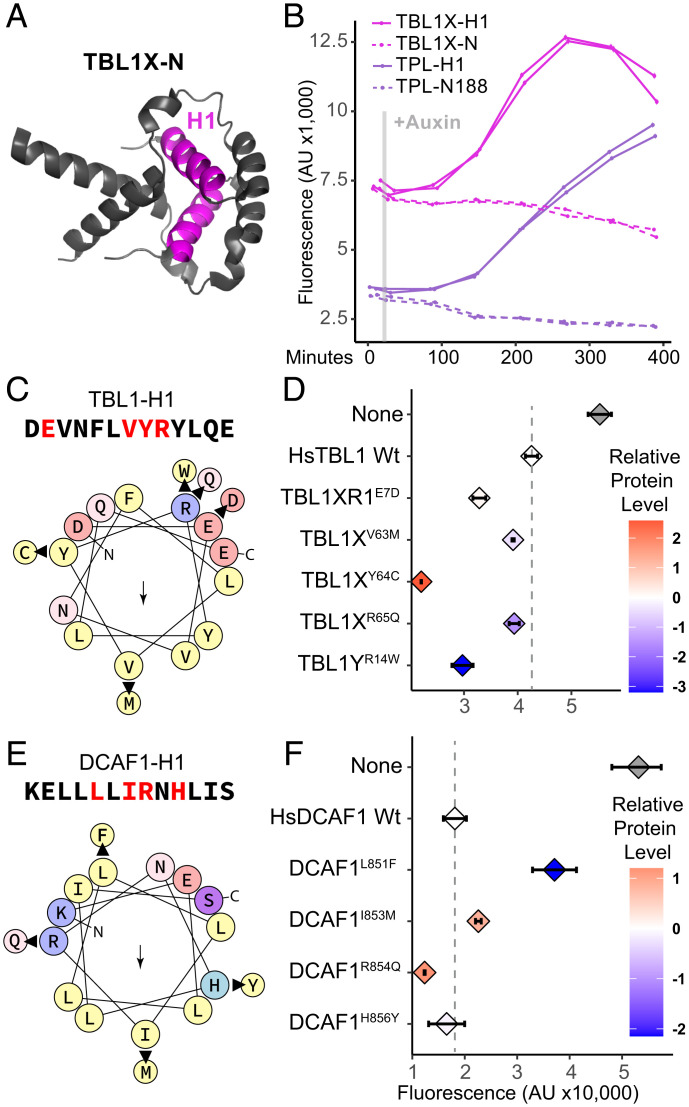
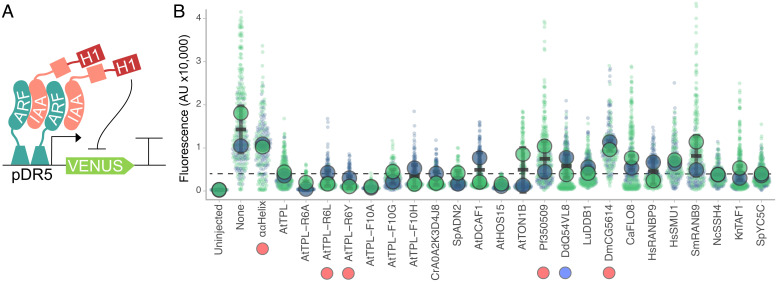
The corepressor TOPLESS (TPL) and its paralogs coordinately regulate a large number of genes critical to plant development and immunity. As in many members of the larger pan-eukaryotic Tup1/TLE/Groucho corepressor family, TPL contains a Lis1 Homology domain (LisH), whose function is not well understood. We have previously found that the LisH in TPL-and specifically the N-terminal 18 amino acid alpha-helical region (TPL-H1)-can act as an autonomous repression domain. We hypothesized that homologous domains across diverse LisH-containing proteins could share the same function. To test that hypothesis, we built a library of H1s that broadly sampled the sequence and evolutionary space of LisH domains, and tested their activity in a synthetic transcriptional repression assay in Saccharomyces cerevisiae. Using this approach, we found that repression activity was highly conserved and likely the ancestral function of this motif. We also identified key residues that contribute to repressive function. We leveraged this new knowledge for two applications. First, we tested the role of mutations found in somatic cancers on repression function in two human LisH-containing proteins. Second, we validated function of many of our repression domains in plants, confirming that these sequences should be of use to synthetic biology applications across many eukaryotes.

Keywords: LisH co-repressor; TPL; transcriptional repression.


Conflict of interest statement

The authors declare no competing interest.

Figures

Fig. 1.
Fig. 1.
AtTPL LisH H1 is a very short autonomous repression domain. (A) Sequence and structure of Helix 1 (AtTPL-H1) (PDB: 5NQS). The LisH domain is colored purple, and amino acids chosen for mutation are highlighted in both the sequence and the structure with pink. (B) An alanine scan of residues predicted to be solvent-facing. Repression activity of indicated alanine substitutions is in red, and wild-type H1 sequence is in blue. AtTPLN188-IAA3 (blue hatch), the first 188 amino acids of AtTPL fused to AtIAA3, and IAA3 with no corepressor (white) are included for reference. (C) Time course flow cytometry of selected H1 mutations. Auxin (10µM IAA) was added at the time indicated by the gray bar. (D) Schematic of HA epitope placement and Western blots of tagged constructs. (E) Repression activity of HA-tagged AtTPL-H1 constructs. All components of the AtARCSc that were held constant across experiments (auxin promoter::Venus, ARF19, AFB2) were integrated at the URA3 locus. The variable H1-HA-IAA3 constructs were expressed from a plasmid carrying the TRP1 prototrophic gene. (F and G) Flow cytometry was used to measure the repression activity of AtTPL-H1 constructs with a range of amino acid substitutions at position R6 (F) and F10 (G), as alanine substitutions at these positions strongly inhibited and enhanced repression activity, respectively. Constructs with wild-type residues are indicated with a bold outline, and the dotted lines represent their repression strength. Protein accumulation was assayed by Western blot using an α-HA antibody and normalized to yeast PGK1. Levels of AtTPL-H1 mutants are shown relative to wild-type AtTPL-H1 with each data point color coded from blue (low) to red (high) expression on a log2 scale. (G, Inset) Specified variants were tested in the more sensitive, fully integrated AtARCSc. The blue line in each graph is the wild-type TPL-H1 sequence. (B, C, EG) Each panel represents two independent time course flow cytometry experiments of the AtTPL-H1 constructs indicated, all fused to IAA3. For all cytometry, every point represents the median fluorescence of at least 10,000 individually measured yeast cells (AU, arbitrary units) and error bars represent 95% CI. In many cases, intervals are small enough that they appear as a single line.
Fig. 2.
Fig. 2.
The repressive function of the LisH domain is likely ancestral. (A) A Maximum Likelihood (46) phylogeny of LisH-H1 sequences from diverse eukaryotes. Ancestral sequences of interest were inferred (42) at nodes of interest (black dot). A representative protein was selected for each sequence. (B) Published function and subcellular localization for each protein were annotated and sources cited (SI Appendix, Table S1). The first column marks whether a protein is a transcriptional repressor (red), transcriptional activator (blue), has another function (white), or an uncharacterized function (gray). The second column marks proteins as nuclearly localized (black), nonnuclear (white), or uncharacterized (gray). (C) LisH-H1 sequences were aligned and residues colored by their physicochemical class [RASMOL color scheme (49)]. Residues that are the same as those in the AtTPL-H1 sequence at the top of the alignment are indicated with a period. The consensus sequence for H1, and the relative conservation rate of different residues along the helix, are displayed below the alignment. (D) Flow cytometry and a modified AtARCSc depicted in Fig. 1E was used to quantify the relative repressive function of different LisH-H1s. We have marked the fluorescence levels detected by the positive AtTPL-H1-HA-IAA3 control (dashed line) and negative IAA3 repression control (dotted line). Protein accumulation was measured by Western blot and normalized to yeast PGK1. Levels of protein expression are shown relative to AtTPL-H1 with each data point color coded from blue (low) to red (high) expression on a log2 scale. For all cytometry, every point represents the median fluorescence of at least 10,000 individually measured yeast cells (AU, arbitrary units) and error bars represent 95% CI. In many cases, intervals are small enough that they appear as a single line.
Fig. 3.
Fig. 3.
LisH domains are important for human disease. (A) The dimerized protein structure of the N-terminal domain of Hs TBL1X, with H1 highlighted (pink, 2XTD). (B) Time course flow cytometry of H1 and N-termini of HsTBL1X-IAA3 and AtTPL-IAA3 following auxin addition. Auxin (IAA-10µM) was added at the indicated time (gray bar, + Aux). HsTBL1X (pink) and AtTPL (purple), isolated H1 (solid line), N-terminal region (dotted line). Yeast strains are grown and measured after 400 min, with auxin added to some samples (solid lines) at the time indicated by the gray line. (C) and (E) Helical wheel depiction of HsTBL1X and HsDCAF1 H1 sequences colored by their physicochemical class (yellow, hydrophobic; red/blue, charged; pink/purple, polar uncharged; arrow indicates hydrophobic face) produced by HeliQuest (55). Arrows show the mutations found in these loci in the COSMIC library (52), and where they occur. (D, F) Effects on protein repressive function of these mutations in HsTBL1 and HsDCAF1 sequences are measured using flow cytometry. Each panel represents two independent time course flow cytometry experiments of the H1s indicated. For all cytometry, every point represents the median fluorescence of at least 10,000 individually measured yeast cells (AU, arbitrary units) and error bars represent 95% CI. In many cases, intervals are small enough that they appear as a single line. Protein accumulation was measured by Western blot and normalized to yeast PGK1. Levels of mutant protein constructs are shown relative to wild-type H1s (HsTBL1-H1 and HsDCAF1-H1, respectively, dotted line) with each data point color coded from blue (low) to red (high) expression on a log2 scale.
Fig. 4.
Fig. 4.
The H1 can act as a synthetic repressor domain in planta. (A) Schematic of components injected in transient repression assays in Nicotiana benthamiana. pDR5:Venus reporter is based on a highly sensitive synthetic auxin promoter (57). Asterisk indicates EAR motif mutation. (B) Repression activity of a range of H1 sequences are shown. Reporter activation was measured in four separate leaf injections (biological replicates) in 2 d of injection (large circles are pooled data from 1 d). Dashed line indicates AtTPL-H1 repression level. Circles below the construct names indicate protein levels that are 5-fold higher (red) or 5-fold lower (blue) than those of H1-IAA3 constructs.

Similar articles

Cited by

References

    1. Reynolds N., O’Shaughnessy A., Hendrich B., Transcriptional repressors: Multifaceted regulators of gene expression. Development 140, 505–512 (2013). - PubMed
    1. Courey A. J., Jia S., Transcriptional repression: The long and the short of it. Genes Dev. 15, 2786–2796 (2001). - PubMed
    1. Payankaulam S., Li L. M., Arnosti D. N., Transcriptional repression: Conserved and evolved features. Curr. Biol. 20, R764–R771 (2010). - PMC - PubMed
    1. Perissi V., Jepsen K., Glass C. K., Rosenfeld M. G., Deconstructing repression: Evolving models of co-repressor action. Nat. Rev. Genet. 11, 109–123 (2010). - PubMed
    1. Mottis A., Mouchiroud L., Auwerx J., Emerging roles of the corepressors NCoR1 and SMRT in homeostasis. Genes Dev. 27, 819–835 (2013). - PMC - PubMed

Publication types

MeSH terms

LinkOut - more resources