

Metallic support films reduce optical heating in cryogenic correlative light and electron tomography
- PMID: 36191745
- PMCID: PMC9729463
- DOI: 10.1016/j.jsb.2022.107901
Metallic support films reduce optical heating in cryogenic correlative light and electron tomography
Abstract
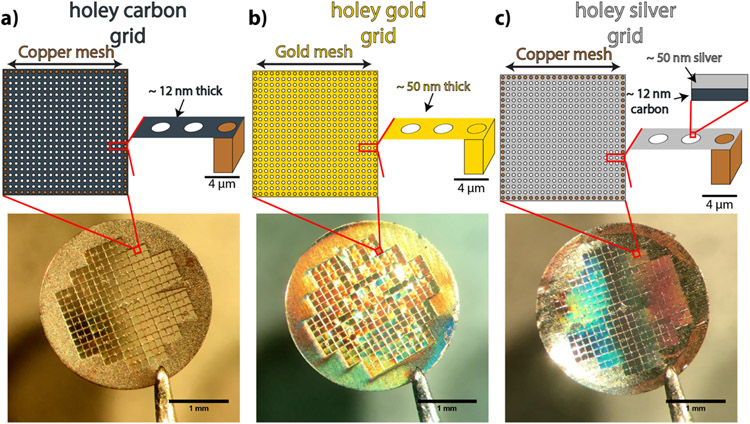
Super-resolved cryogenic correlative light and electron tomography is an emerging method that provides both the single-molecule sensitivity and specificity of fluorescence imaging, and the molecular scale resolution and detailed cellular context of tomography, all in vitrified cells preserved in their native hydrated state. Technical hurdles that limit these correlative experiments need to be overcome for the full potential of this approach to be realized. Chief among these is sample heating due to optical excitation which leads to devitrification, a phase transition from amorphous to crystalline ice. Here we show that much of this heating is due to the material properties of the support film of the electron microscopy grid, specifically the absorptivity and thermal conductivity. We demonstrate through experiment and simulation that the properties of the standard holey carbon electron microscopy grid lead to substantial heating under optical excitation. In order to avoid devitrification, optical excitation intensities must be kept orders of magnitude lower than the intensities commonly employed in room temperature super-resolution experiments. We further show that the use of metallic films, either holey gold grids, or custom made holey silver grids, alleviate much of this heating. For example, the holey silver grids permit 20× the optical intensities used on the standard holey carbon grids. Super-resolution correlative experiments conducted on holey silver grids under these increased optical excitation intensities have a corresponding increase in the rate of single-molecule fluorescence localizations. This results in an increased density of localizations and improved correlative imaging without deleterious effects from sample heating.
Keywords: CLEM; Cryogenic electron tomography; Fluorescence microscopy; Single-molecule; Super-resolution.
Published by Elsevier Inc.
Conflict of interest statement
Declaration of Competing Interest The authors declare that they have no known competing financial interests or personal relationships that could have appeared to influence the work reported in this paper.
Figures


Similar articles
-
Effects of base temperature, immersion medium, and EM grid material on devitrification thresholds in cryogenic optical super-resolution microscopy.J Struct Biol. 2025 Jul 17;217(3):108231. doi: 10.1016/j.jsb.2025.108231. Online ahead of print. J Struct Biol. 2025. PMID: 40683427
-
Correlative super-resolution fluorescence and electron cryo-microscopy based on cryo-SOFI.Methods Cell Biol. 2021;162:253-271. doi: 10.1016/bs.mcb.2020.10.021. Epub 2020 Dec 19. Methods Cell Biol. 2021. PMID: 33707015
-
Cryogenic Super-Resolution Fluorescence and Electron Microscopy Correlated at the Nanoscale.Annu Rev Phys Chem. 2021 Apr 20;72:253-278. doi: 10.1146/annurev-physchem-090319-051546. Epub 2021 Jan 13. Annu Rev Phys Chem. 2021. PMID: 33441030 Free PMC article. Review.
-
Minimizing Crinkling of Soft Specimens Using Holey Gold Films on Molybdenum Grids for Cryogenic Electron Microscopy.Microsc Microanal. 2021 Aug;27(4):767-775. doi: 10.1017/S1431927621000520. Microsc Microanal. 2021. PMID: 34085628
-
Developing Graphene Grids for Cryoelectron Microscopy.Front Mol Biosci. 2022 Jul 13;9:937253. doi: 10.3389/fmolb.2022.937253. eCollection 2022. Front Mol Biosci. 2022. PMID: 35911962 Free PMC article. Review.
Cited by
-
Characterization of mApple as a Red Fluorescent Protein for Cryogenic Single-Molecule Imaging with Turn-Off and Turn-On Active Control Mechanisms.J Phys Chem B. 2023 Mar 30;127(12):2690-2700. doi: 10.1021/acs.jpcb.2c08995. Epub 2023 Mar 21. J Phys Chem B. 2023. PMID: 36943356 Free PMC article.
-
Exploring transient states of PAmKate to enable improved cryogenic single-molecule imaging.bioRxiv [Preprint]. 2024 Aug 31:2024.04.24.590965. doi: 10.1101/2024.04.24.590965. bioRxiv. 2024. Update in: J Am Chem Soc. 2024 Oct 23;146(42):28707-28716. doi: 10.1021/jacs.4c05632. PMID: 38712218 Free PMC article. Updated. Preprint.
-
Bringing Structure to Cell Biology with Cryo-Electron Tomography.Annu Rev Biophys. 2023 May 9;52:573-595. doi: 10.1146/annurev-biophys-111622-091327. Annu Rev Biophys. 2023. PMID: 37159298 Free PMC article. Review.
-
Insights into protein structure using cryogenic light microscopy.Biochem Soc Trans. 2023 Dec 20;51(6):2041-2059. doi: 10.1042/BST20221246. Biochem Soc Trans. 2023. PMID: 38015555 Free PMC article. Review.
-
The advent of preventive high-resolution structural histopathology by artificial-intelligence-powered cryogenic electron tomography.Front Mol Biosci. 2024 May 29;11:1390858. doi: 10.3389/fmolb.2024.1390858. eCollection 2024. Front Mol Biosci. 2024. PMID: 38868297 Free PMC article. Review.
References
-
- Albert S, Wietrzynski W, Lee CW, Schaffer M, Beck F, Schuller JM, Salome PA, Plitzko JM, Baumeister W, and Engel BD, Direct visualization of degradation microcompartments at the ER membrane. Proceedings of the National Academy of Sciences of the United States of America, 2020. 117(2): p. 1069–1080. - PMC - PubMed
-
- Wang Q, Mercogliano CP, and Löwe J, A Ferritin-Based Label for Cellular Electron Cryotomography. Structure, 2011. 19(2): p. 147–154. - PubMed
-
- Mercogliano CP and DeRosier DJ, Gold nanocluster formation using metallothionein: mass spectrometry and electron microscopy. Journal of Molecular Biology, 2006. 355(2): p. 211–223. - PubMed
Publication types
MeSH terms
Substances
Grants and funding
LinkOut - more resources
Full Text Sources
