. 2023 Jan:117:43-61.
doi: 10.1016/j.exphem.2022.09.004. Epub 2022 Oct 1.

Preclinical studies on the use of a P-selectin-blocking monoclonal antibody to halt progression of myelofibrosis in the Gata1low mouse model

Affiliations

Preclinical studies on the use of a P-selectin-blocking monoclonal antibody to halt progression of myelofibrosis in the Gata1low mouse model

Paola Verachi et al. Exp Hematol. 2023 Jan.

Abstract

The bone marrow (BM) and spleen from patients with myelofibrosis (MF), as well as those from the Gata1low mouse model of the disease contain increased number of abnormal megakaryocytes. These cells express high levels of the adhesion receptor P-selectin on their surface, which triggers a pathologic neutrophil emperipolesis, leading to increased bioavailability of transforming growth factor-β (TGF-β) in the microenvironment and disease progression. With age, Gata1low mice develop a phenotype similar to that of patients with MF, which is the most severe of the Philadelphia-negative myeloproliferative neoplasms. We previously demonstrated that Gata1low mice lacking the P-selectin gene do not develop MF. In the current study, we tested the hypothesis that pharmacologic inhibition of P-selectin may normalize the phenotype of Gata1low mice that have already developed MF. To test this hypothesis, we have investigated the phenotype expressed by aged Gata1low mice treated with the antimouse monoclonal antibody RB40.34, alone and also in combination with ruxolitinib. The results indicated that RB40.34 in combination with ruxolitinib normalizes the phenotype of Gata1low mice with limited toxicity by reducing fibrosis and the content of TGF-β and CXCL1 (two drivers of fibrosis in this model) in the BM and spleen and by restoring hematopoiesis in the BM and the architecture of the spleen. In conclusion, we provide preclinical evidence that treatment with an antibody against P-selectin in combination with ruxolitinib may be more effective than ruxolitinib alone to treat MF in patients.


Conflict of interest statement

Conflict of Interest

PV, FG, FM, MF, AV, GS and MZ declare no conflict. CW, AB and AP are employee of Novartis Pharmaceutical Corporation. ARM received research funds from Novartis Pharmaceutical Corporation.

Figures

Figure 1.
Figure 1.. At day 5, RB40.34 is readily detected on the platelets present in the blood and on sections of bone marrow from Gata1low mice.
(A) Flow cytometry analyses with APC-Cy7-streptavidin of platelets present in the blood from Gata1low mice after 5 days of treatment. The mice had been treated 5hr earlier with vehicle, biotinylated-RB40.34, Rux or the two drugs in combination, as indicated. Platelets are recognized based on size (FS: forward scatter) and internal cell complexity (SS: side scatter). Representative FS/SS gating and histograms of the APC-Cy7-streptavidin staining are presented on the left. Mean Fluorescence Intensity (MFI) (±SD) of APC-Cy7-streptavidin staining and values in individual mice (each symbol a mouse) are presented on the right. p values are calculated with Tukey multiple comparison test and significant differences are indicated in the panels. (B) Representative sections of BM from Gata1low mice treated with either vehicle (first panel) or biotinylated-RB40.34, Rux and Rux+ biotinylated-RB40.34 incubated with APC-Cy7-streptavidin (top panels). The panel on the bottom shows the computer-generated signal specific for mAb RB40.34 obtained by subtracting the background from vehicle with the ImageJ program. Areas exciding the threshold are artificially labeled in red. Detail of the ImageJ processing of the images are provided in Figure S2. Magnification 40x. The intensity of APC-Cy7 staining as percent of areas above the threshold in sections from the BM of multiple mice are presented on the right.
Figure 2.
Figure 2.. Treatment with RB40.34 in combination with Rux restores the abnormal canonical and non-canonical TGF-β signaling observed in the bone marrow from Gata1low mice.
(A-C) Western blot analyses for the content of elements downstream to the canonical and non-canonical TGF-β signaling of the BM of untreated wild-type (WT) and Gata1low mice and from Gata1low treated with vehicle, RB40.34, Rux or the two drugs in combination, as indicated. Blots are presented on the right and quantifications on the left. Quantitative values are presented as Means (± SD) and as individual values for each mouse. Total protein levels are normalized toward the corresponding GPDH levels while, to take into account differences in total protein, the levels of the phosphoproteins are expressed stoichiometrically as a ratio with the total level of the corresponding protein. p values were calculated with Tukey multiple comparison test and statistically significant differences are indicated in the panels.
Figure 3.
Figure 3.. Treatment with RB40.34 in combination with Rux restores the abnormal JAK2/STAT5 signaling observed in the spleen from Gata1low mice.
Western blot analyses for JAK2, STAT5 and GAPDH (as loading control) of BM (A,C) and spleen (B,D) from untreated wild-type (WT) and Gata1low mice and from Gata1low mice treated with vehicle, RB40.34 and Rux, alone or in combination. Blots are presented on the right and quantifications on the left. In C and D, quantitative values are presented as Means (± SD) and as individual values for each mouse. p values are calculated with Tukey multiple comparison test and statistically significant differences are indicated in the panels.
Figure 4.
Figure 4.. Treatment for 54 days with RB40.34 in combination with Rux reduces the frequency of red blood cell anisocytosis and lymphocyte counts in the blood from Gata1low mice.
(A) Red blood cell distribution width (RDW, in %) detected in the blood from Gata1low mice treated with vehicle, RB40.34, Rux or the two drugs in combination for 54 days, as indicated. Data are presented as Mean (±SD) and as individual values from each mouse. The asterisks indicate the groups containing the deidentified samples flagged for anisocytosis by the accredited laboratory. (B) Lymphocyte counts observed in the blood from Gata1low mice treated with vehicle, RB40.34, Rux or the two drugs in combination for 54 days, as indicated. Data are presented as Mean (± SD) and as individual values from each mouse. p values are calculated with Tukey multiple comparison test and statistically significant differences (p<0.05) are indicated in the panels.
Figure 5.
Figure 5.. Treatment for 54 days with RB40.34 in combination with Rux increases the cellularity, reduces fibrosis and restores hematopoiesis in the bone marrow from Gata1low mice.
A) Photographs of the femur and tibia from representative mice treated for 54 days with either Vehicle or RB40.34 in combination with Rux, as indicated. B) Number of cells per femur observed at day 54 in Gata1low mice treated with either vehicle, RB40.34, Rux or the two drugs in combination. C) Hematoxylin/Eosin (H&E) and Reticulin staining of femurs from representative Gata1low mice treated for 54 days with either vehicle, RB40.34, Rux or the two drugs in combination, as indicated. The femurs are presented as stack images (at 4x) and as representative sections at 4 and 20x magnification, as indicated. D) Levels of fibrosis quantified by image analyses of the reticulin staining of BM sections from Gata1low mice treated for 54 days as indicated above. E) Frequency and total number of Lin-, LSK and SLAM cells in the femur of Gata1low mice treated with the various drug combinations. In B, D and E, results are presented as Mean (±SD) and as values per individual mice (each symbol a mouse) and were analyzed by Tukey’s multiple comparisons test. Statistically significant groups are indicated within the panels.
Figure 6.
Figure 6.. Treatment for 54 days with RB40.34 and Rux, alone or in combination, reduces the vessel density in the bone and spleen from Gata1low mice.
Confocal microscopy with CD34 and Hoechst (to counterstain the nuclei) of bone marrow (A) and spleen (B) sections from Gata1low mice treated for 54 days with either vehicle or with RB40.34 and Rux alone and in combinations. The panels in the first and third lanes are at 20x magnification, and the area depicted in the rectangles are shown at 60x in the corresponding panels in the second and third lanes. At 60x magnification, microvessels (dashed lines) are identified as structures surrounded by CD34pos cells (indicated by arrows) and containing red cells (autofluorescent cells not counterstained by Hoechst, asterisks). Quantitative results are shown on the right as Mean (±SD) and as values per individual mice (each symbol a mouse). Statistical analysis was performed by Tukey’s multiple comparisons test and significant p-values are indicated within the panels.
Figure 7.
Figure 7.. Treatment for 54 days with RB40.34 in combination with Rux decreases hematopoiesis of the spleen from Gata1low mice.
A) Photographs of representative spleens treated for 54 days with the various drug combinations, as indicated. B,C) Spleen size, as weight and ratio between spleen weight and body weight (B), and total cell numbers (C), of mice treated for 54 days with the various drug combinations. D) Frequency and total number of Lin- and LSK cells in the spleen of Gata1low mice treated with the various drug combinations. SLAM cells are not presented because they are almost 100% of the LSK cells detected in the spleen (see Figure S9). In B, C and D, results are presented as Mean (±SD) and as values per individual mice (each symbol a mouse) and are analyzed by Tukey’s multiple comparisons test. Statistically significant groups are indicated within the panels.
Figure 8.
Figure 8.. Treatment for 54 days with RB40.34 in combination with Rux decreases fibrosis and restores the architecture of the spleen from Gata1low mice.
A) Hematoxylin/Eosin (H&E) and reticulin staining of spleen from representative 8–11-months old WT and Gata1low mice. WT spleens are characterized by the presence of large aggregates of lymphoid cells, well developed white pulp, with the presence of red blood cells embedded in reticular connective tissue containing few megakaryocytes and supporting trabeculae. By contrast, Gata1low spleen is characterized by hypoplastic white pulp and red pulp rich of megakaryocytes. Reticulin staining of the consecutive section indicates that fibrosis is localized mostly in the red pulp. Results are representative of those observed in at least three WT and three Gata1low littermates, all 11-months old. B) Triple immunofluorescent analyses for CD3 (as a marker of T cells, red), CD45R (B220, as a marker for B cells, green) and DAPI (nuclei) of spleen sections from representative WT and Gata1low mice, as indicated. As expected (50), the white pulp of WT spleen contains numerous T and B lymphocytes, organized around central arterioles. T lymphocytes form a sleeve around the central arteriole, the periarteriolar lymphoid sheath while B cells are mainly localized in the outer white pulp region, the marginal zone. In Gata1low spleens the white pulp is smaller than that in the WT organ and the periarteriolar lymphoid sheath contain a markedly reduced number of T cells. Magnification 4x, 10x and 20x, as indicated. C) Hematoxylin/Eosin (H&E), reticulin staining and triple staining with CD45R (green), CD3 (red) and DAPI (blue) of sections from the spleen of representative Gata1low mice treated for 54 days with the various drug combinations, as indicated. Images are presented at 4x and 20x magnification. D) Levels of fibrosis quantified by image analyses of the reticulin staining of spleen sections from untreated 8–11-months old WT and Gata1low littermates, as indicated. E) Levels of fibrosis, quantified by image analyses of the reticulin staining, in spleen sections, from Gata1low mice treated for 54 days, as indicated. In D and E) results are presented as Mean (±SD) and as values per individual mice (each symbol a mouse) and were analyzed by t test. Statistically significant groups are indicated within the panels.
Figure 9.
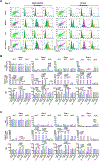
Figure 9.. Treatment for 54 days with RB40.34 and Rux alone in combination improves the maturation profile of the MK from the bone marrow and spleen of Gata1low mice.
A) Representative dot-plots and histograms of MK from the bone marrow (left quadrant) and spleen (right quadrant) of one representative mouse from each experimental group treated for 5 days. MKs were labeled with CD41, CD61 and PE-Cy7-streptavidin. The a, b, c and d gates identify non-MK, immature MK, mature MK and very mature MK, respectively. The levels of APC-Cy7-streptavidin bound to the MKs at their different stage of maturation is presented by histograms. Since P-sel is abnormally expressed at high levels on the surface of Gata1low MK, the APC-Cy7-streptaviddin signal identifies the MK expressing P-sel which have bound the biotinylated RB40.34 injected 5 hr earlier in the mice. B,C) Frequency of cells in the non-MK (a) and immature (b), mature (c) and very mature (d) MK gate (% in percent of total cell number) and percentage and MFI of the events positive for PE-Cy7-streptavidin staining in each gate in the BM (A) and spleen (B) from Gata1low mice treated for 5, 12 and 54 days with either vehicle or the different drug combinations, as indicated. Values were reported as Means (±SD) of those detected in at least three mice per experimental group. Data are analyzed by Tukey’s multiple comparisons and statistically significant differences among groups are indicated within the panels.
Figure 10.
Figure 10.. Treatment for 54 days with RB40.34 or Rux alone, but not in combination, increases the GATA1 content in the MK from the BM of Gata1low mice.
A) Merged GATA1 (FITCH-green) and CD42b (TRITCH-red, as a marker of MKs) images of the confocal microscopy analyses with the corresponding antibodies in BM sections from representative Gata1low mice treated for 54 days with either vehicle, RB40.34 alone, Rux alone, or the two drugs in combination, as indicated. The corresponding images acquired in the single cannels, in the cannel for DAPI (as indication of the nuclear localization of GATA1) and in the bright field (to exclude autofluorescence) are presented in Figure S11. Magnification 40x. B) Frequency of MK (CD42b positive cells) and percentage of MK positive for GATA1 in BM sections from Gata1low mice treated for 54 days as indicated. Data are presented as Mean (±SD) and as values in individual mice (each symbol a mouse). Results were analyzed by Tukey’s multiple comparisons test and significant differences among groups indicated within the panels.
Figure 11.
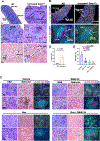
Figure 11.. Treatment for 54 days with RB40.34 and Rux in combination decreases the TGF-β, mainly in the MK, and CXCL1 content of bone marrow from Gata1low mice.
A) BM sections from representative mice treated for 54 days with either vehicle, RB40.34, Rux or the two drugs in combination immune-stained for TGF-β or CXCL1, as indicated. Representative MK are indicated by arrows. Magnification 40x. B) Quantification by computer assisted imaging of the TGF-β1 and CXCL1 content in the BM from Gata1low mice treated for 54 days as indicated. C) Frequency of MK and percentage of MK expressing high levels of TGF-β1 and CXCL1 in BM sections from Gata1low mice treated as indicated. MK were identified on the basis of size (10 times greater than that of any other cell type in the section) and the polylobate morphology of their nuclei. In B and C, data are presented as Mean (±SD) and as values per individual mice (each symbol a different mouse) and are analyzed by Tukey’s multiple comparisons test. Values statistically different are indicated within the panels.

Similar articles

Cited by

References

    1. Zahr AA, Salama ME, Carreau N, Tremblay D, Verstovsek S, Mesa R, et al. Bone marrow fibrosis in myelofibrosis: pathogenesis, prognosis and targeted strategies. Haematologica. 2016;101:660–71. - PMC - PubMed
    1. Barbui T, Tefferi A, Vannucchi AM, Passamonti F, Silver RT, Hoffman R, et al. Philadelphia chromosome-negative classical myeloproliferative neoplasms: revised management recommendations from European LeukemiaNet. Leukemia. 2018;32:1057–69. - PMC - PubMed
    1. Marcellino BK, Verstovsek S, Mascarenhas J. The Myelodepletive Phenotype in Myelofibrosis: Clinical Relevance and Therapeutic Implication. Clin Lymphoma Myeloma Leuk. 2020;20:415–21. - PubMed
    1. Dunbar AJ, Rampal RK, Levine R. Leukemia secondary to myeloproliferative neoplasms. Blood 2020;136:61–70. - PMC - PubMed
    1. Vainchenker W, Constantinescu SN. JAK/STAT signaling in hematological malignancies. Oncogene. 2013;32:2601–13. - PubMed

Publication types