. 2023 Apr;72(4):654-662.
doi: 10.1136/gutjnl-2021-326305. Epub 2022 Oct 3.

NOX1 is essential for TNFα-induced intestinal epithelial ROS secretion and inhibits M cell signatures

Affiliations

NOX1 is essential for TNFα-induced intestinal epithelial ROS secretion and inhibits M cell signatures

Nai-Yun Hsu et al. Gut. 2023 Apr.

Abstract

Objective: Loss-of-function mutations in genes generating reactive oxygen species (ROS), such as NOX1, are associated with IBD. Mechanisms whereby loss of ROS drive IBD are incompletely defined.

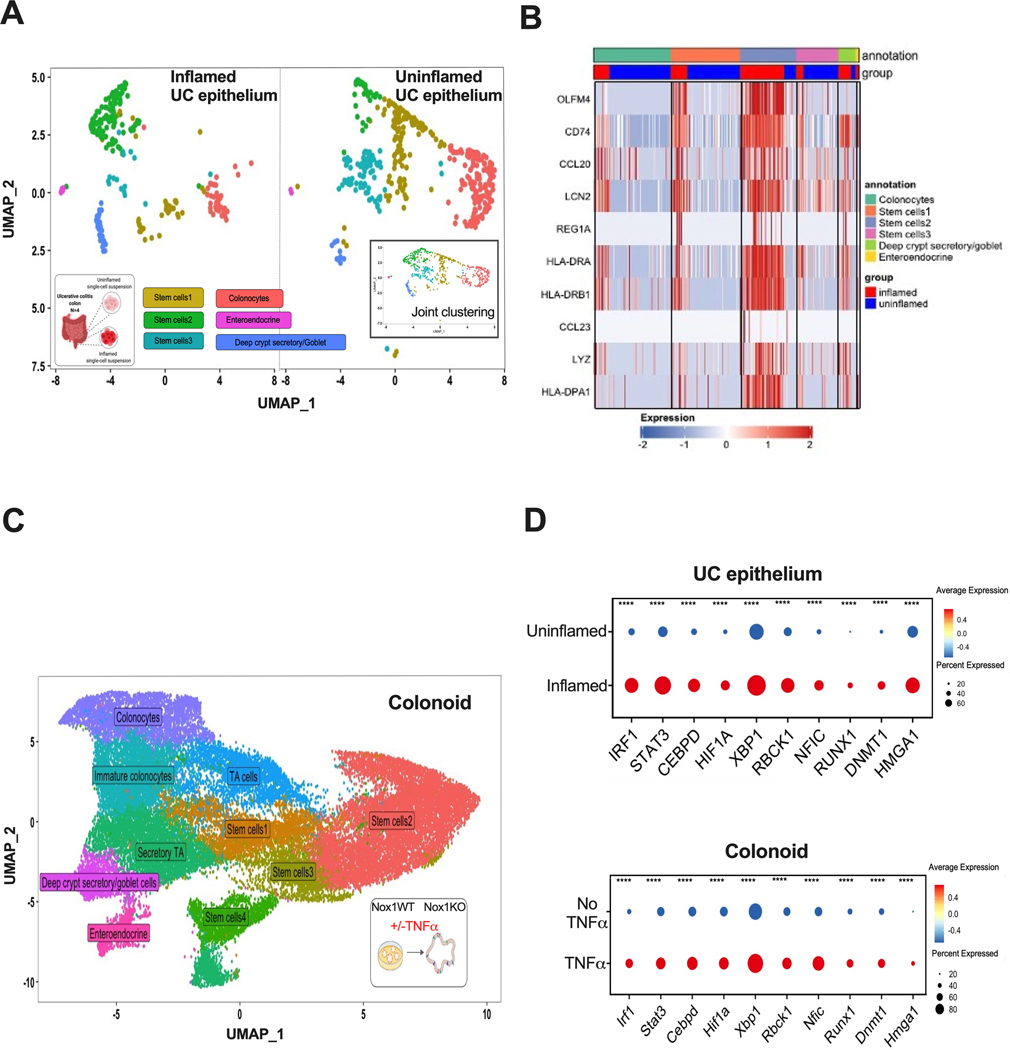
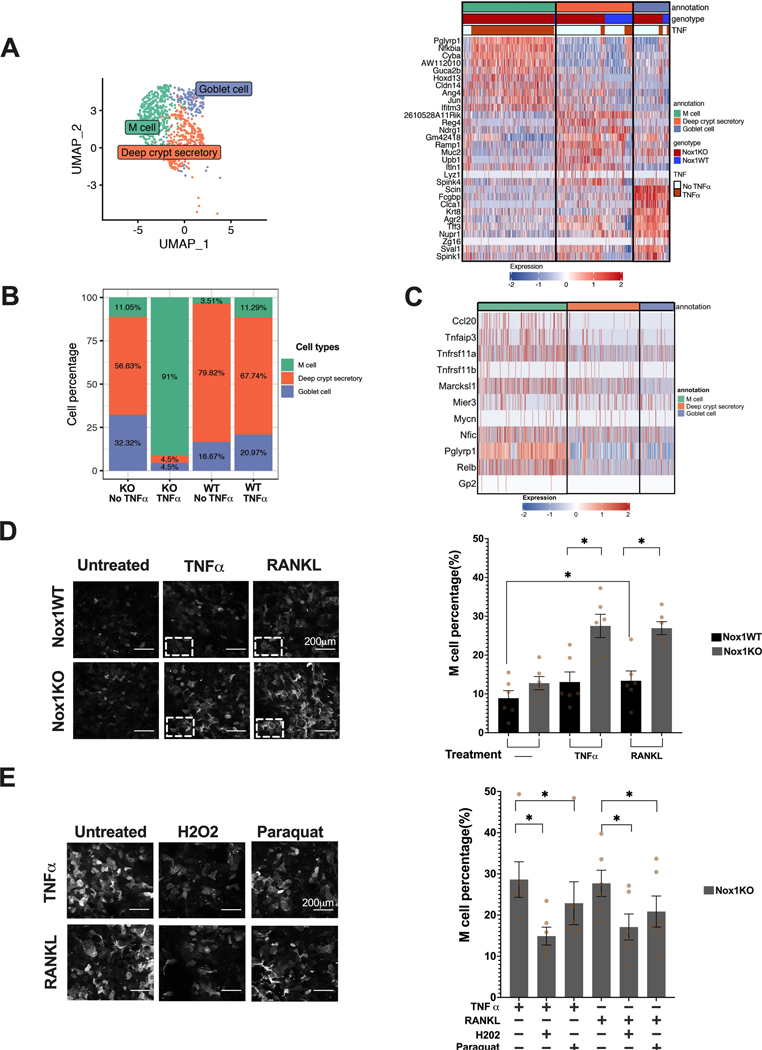
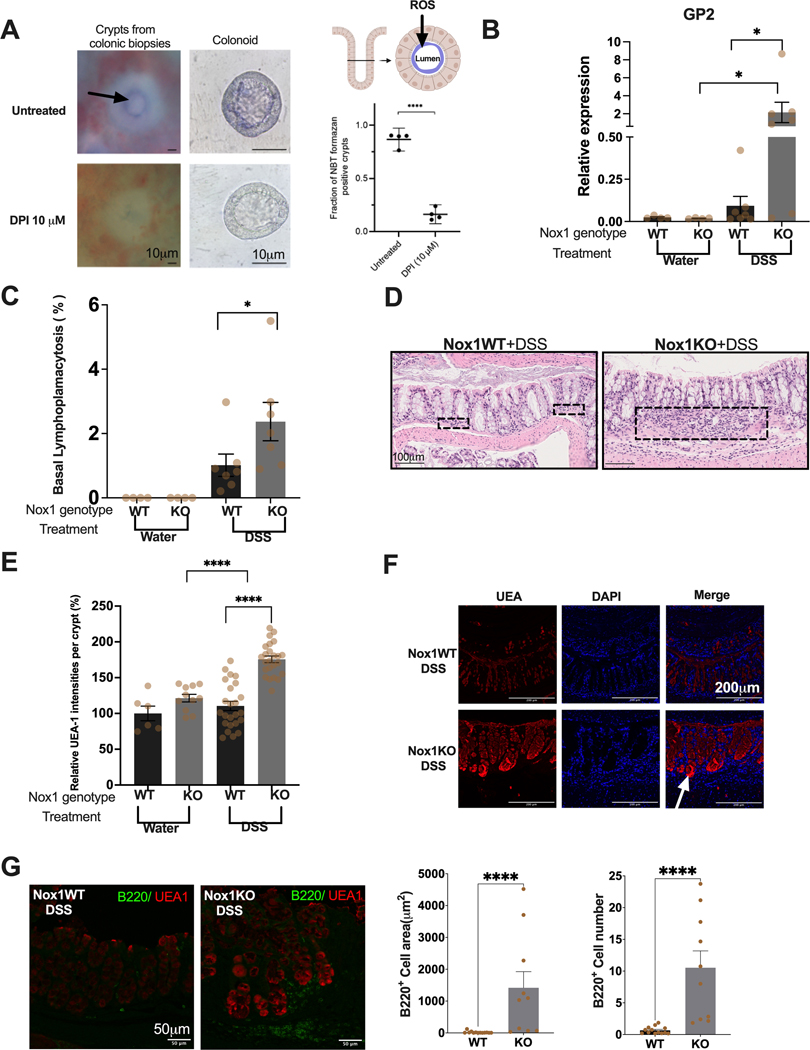
Design: ROS measurements and single-cell transcriptomics were performed on colonoids stratified by NOX1 genotype and TNFα stimulation. Clustering of epithelial cells from human UC (inflamed and uninflamed) scRNASeq was performed. Validation of M cell induction was performed by immunohistochemistry using UEA1 (ulex europaeus agglutin-1 lectin) and in vivo with DSS injury.

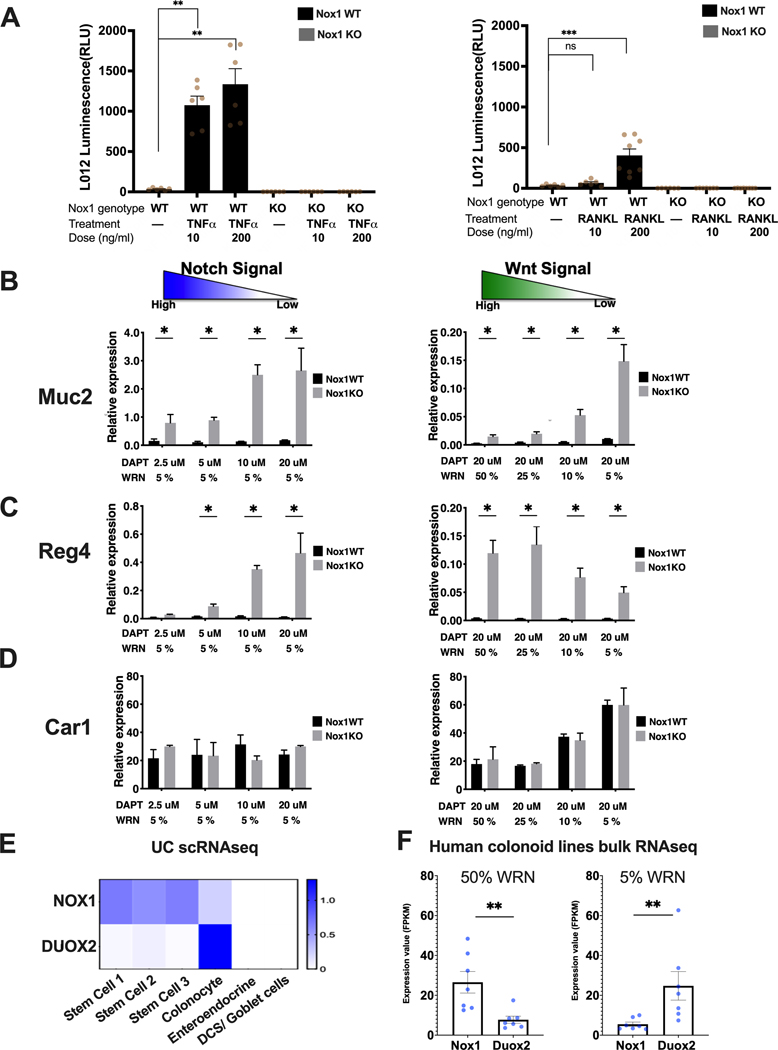
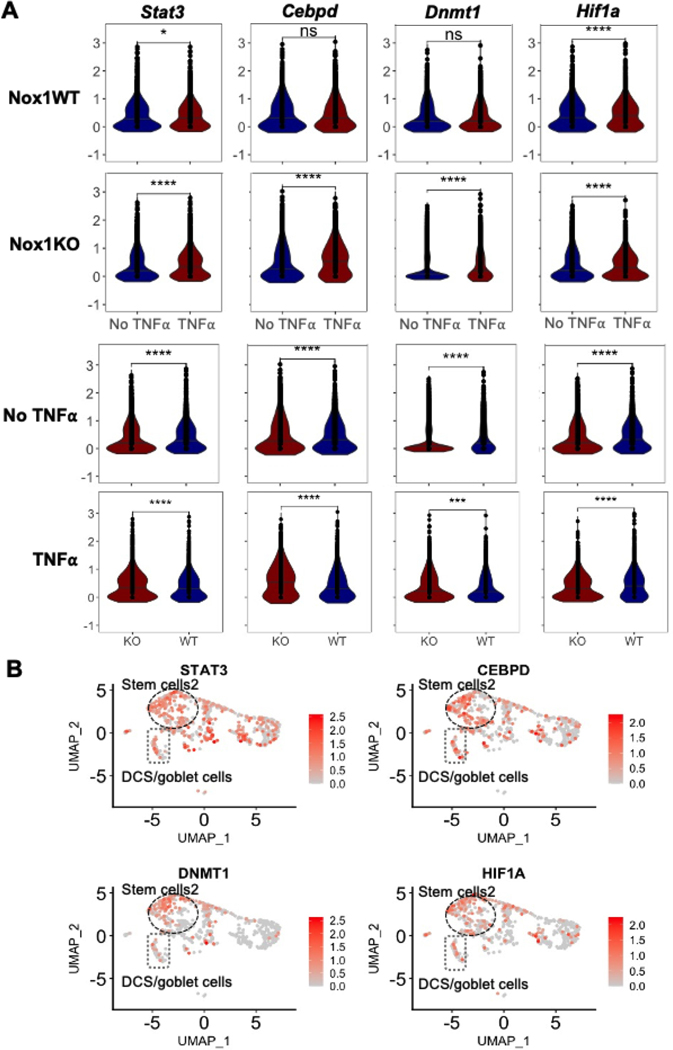
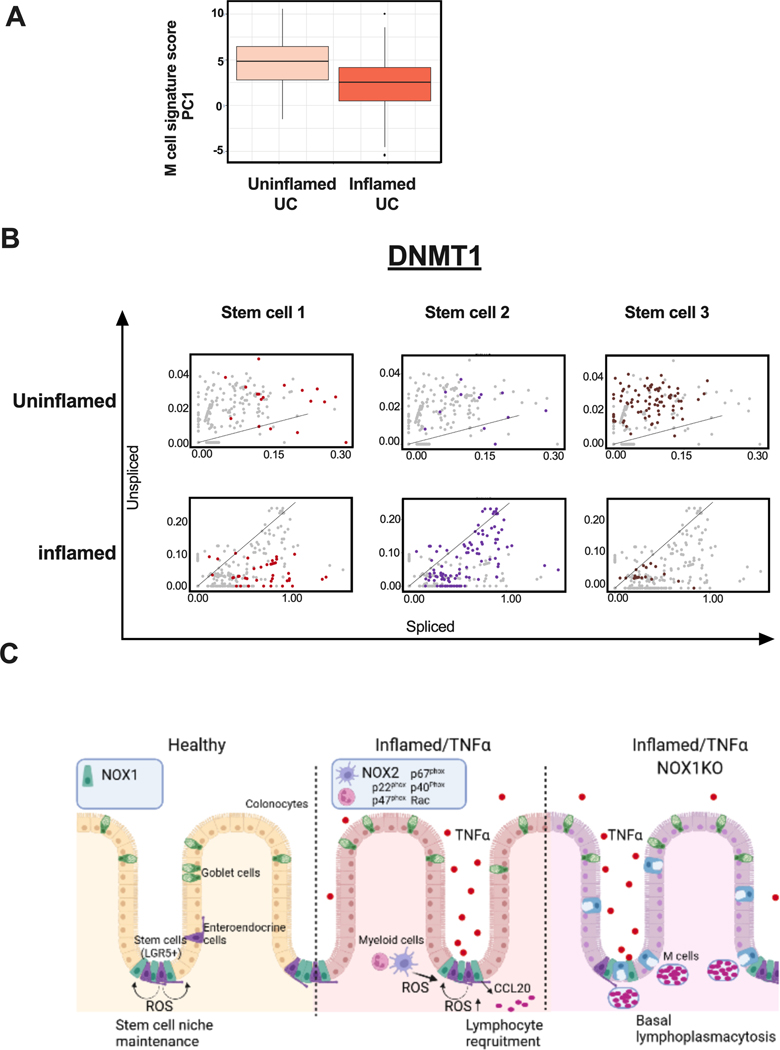
Results: TNFα induces ROS production more in NOX1-WT versus NOX1-deficient murine colonoids under a range of Wnt-mediated and Notch-mediated conditions. scRNASeq from inflamed and uninflamed human colitis versus TNFα stimulated, in vitro colonoids defines substantially shared, induced transcription factors; NOX1-deficient colonoids express substantially lower levels of STAT3 (signal transducer and activator of transcription 3), CEBPD (CCAAT enhancer-binding protein delta), DNMT1 (DNA methyltransferase) and HIF1A (hypoxia-inducible factor) baseline. Subclustering unexpectedly showed marked TNFα-mediated induction of M cells (sentinel cells overlying lymphoid aggregates) in NOX1-deficient colonoids. M cell induction by UEA1 staining is rescued with H2O2 and paraquat, defining extra- and intracellular ROS roles in maintenance of LGR5+ stem cells. DSS injury demonstrated GP2 (glycoprotein-2), basal lymphoplasmacytosis and UEA1 induction in NOX1-deficiency. Principal components analyses of M cell genes and decreased DNMT1 RNA velocity correlate with UC inflammation.

Conclusions: NOX1 deficiency plus TNFα stimulation contribute to colitis through dysregulation of the stem cell niche and altered cell differentiation, enhancing basal lymphoplasmacytosis. Our findings prioritise ROS modulation for future therapies.

Keywords: IBD - genetics; epithelial cells; intestinal stem cell; ulcerative colitis.


Conflict of interest statement

Competing interests: None declared.

Figures

Figure 1
Figure 1. Stem cell expressed NOX1 is required for TNFα induced ROS production and NOX1 deficiency results in secretory precursor enhancement.
A. TNFα (left) and RANKL (right) induced ROS levels in Nox1WT and Nox1KO cells (25% WRN, 20 μM DAPT, measured 3 days after plating). Ns, non-significant. **, P < 0.01. ***, P < 0.001. (Mann-Whitney test, n = 6 to 8 per group). B, C, D. Cell type specific gene expression changes with decreasing Notch (left) and Wnt (right) culture conditions stratified by Nox1 genotype. RT-PCR results for Muc2 (B--goblet cells), Reg4 (C--deep crypt secretory cells) and Car1 (D--colonocytes) for Nox1WT (black) and Nox1KO (gray) colonoids normalized to a house keeping gene, Hprt1 (n=4 per group). *, P < 0.05 (Mann-Whitney test) E. Heatmap of average NOX1 and DUOX2 expression from uninflamed biopsy human (scRNAseq) of UC. F. NOX1 and DUOX2 expression from uninflamed human colonoid lines bulk RNA seq data. human colonoid lines (n = 7 lines) were cultured under 50%WRN (stem cells are the major cell type) or 5% WRN (colonocytes are major cell type). **, P < 0.01 (Mann-Whitney test).
Figure 2
Figure 2. Single cell transcription factor gene expression comparing inflamed vs. uninflamed UC is similar in TNFα-induction in colonoids.
A. UMAP of joint clustering from epithelial cell clusters of UC scRNAseq stratified by inflammation status. The UMAP of the combined inflamed and uninflamed cells are shown in the inserted right panel. N=4 UC patients. B. Heatmap of the top 10 upregulated genes in the stem cell 2 cluster from UC epithelium scRNAseq. Expression is log2 normalized. C. UMAP showing joint clustering of colonoid cells from scRNAseq of untreated and TNFα-stimulated Nox1WT and Nox1KO cultured mice colonoids. D. Dot plots of inflammation or TNFα induced transcription factors in inflamed vs. uninflamed UC epithelial cells (top) similarly upregulated upon TNFα stimulation in colonoids (bottom). ****, P < 0.0001 (two-sided Wilcoxon signed-rank test).
Figure 3
Figure 3. NOX1- and TNFα-modulated transcription factor expression is predominant in UC stem cells.
A. Violin plot of transcription factors showing differential expression in inflamed vs. uninflamed tissue and being differentially expressed (without TNFα) by genotype. TNFα-stimulated differences for Nox1WT (first row) and Nox1KO (second row) colonoids. Genotype dependent differences without (third row) and with (forth row) TNFα stimulation. Ns, non-significant. *, P<0.05. ****, P < 0.0001 (two-sided Wilcoxon signed-rank test). B. Feature plot of induced transcription factors projected onto UMAP from UC epithelial cells (see Figure 2A for cell annotation).
Figure 4
Figure 4. scRNASeq identifies marked M cell induction with Nox1-deficiency plus TNFα stimulation, rescued by H2O2 and paraquat.
A. UMAP of joint subclustering (left) of putative colonoid DCS/goblet cells clustering. Heatmap (Right) of top 10 upregulated genes in each cluster from sub-clustering of putative DCS/goblet cells from colonoid scRNAseq shows unexpected presence of M cells. B. Stacked bar graph of subcluster percentages stratified by Nox1 genotype and TNFα treatment. C. Heatmap of known M cell markers of putative colonoid DCS/goblet cells. D. UEA1 staining of Nox1WT and deficient monolayer cells stimulated with TNFα or RANKL for 72 hours. Representative images of each group are shown. Scale bar denotes 200μm. Quantification of M cell percentage was performed on 42 images for each treatment group. *, P < 0.05 (two-sided Wilcoxon signed-rank test). E. Representative UEA1 staining of TNFα or RANKL stimulated NOX1KO colonoids co-treated with H2O2 or Paraquat. M cell percentages were quantitated on 42 images per treatment group. *, P <0.05 (two-sided Wilcoxon signed-rank test).
Figure 5.
Figure 5.. Isolated crypt ROS secretion and in vivo validation of NOX1 genotype effects.
A. Representative images of ROS production via NBT formazan (blue) from direct ex vivo colonic biopsies and colonic organoids (left and middle panels). The black arrows indicate NBT formazan. Scale bars 10 μm. ROS (Blue) is localized to the lumen of crypt. Quantification of NBT positive crypts fraction of untreated and DPI treated direct ex vivo colonic biopsies from 4 biopsies (901 crypts in total) (Right Panel, Bottom). ****, p<0.0001 (Paired t-test). B. RT-PCR results of GP2 from 5% DSS or water-treated mice for 5 days (n=4 Nox1WT+water; n=4 Nox1KO+water; n=7 Nox1WT+ 5%DSS; n=7 Nox1KO+5%DSS). *, p<0.05 (Mann-Whitney test). C. Fraction of colonic area with basal lymphoplasmacytosis of 5% DSS or water treated mice. (n=4 Nox1WT+water; n=4 Nox1KO+water; n=7 Nox1WT+ 5%DSS; n=7 Nox1KO+5%DSS). * p<0.05 (Mann-Whitney test). D. Representative H&E images of Nox1WT+DSS and Nox1KO+DSS. Black rectangles demonstrate expansion of basal lymphoplasmacytosis with the Nox1KO. Scale bars 100 μm. E. Quantitation of UEA1 intensity of 65 crypts (n=6 Nox1WT+water; n=11 Nox1KO+water; n=24 Nox1WT+5%DSS; n=24 Nox1KO+ 5%DSS). ****, p<0.0001 (Mann-Whitney test) F. Representative immunofluorescence images of UEA1 in Nox1WT-DSS and Nox1KO-DSS. Scale bars 200 μm. White arrow indicates crypt base. G. Representative immunofluorescence images of B220 and UEA1 (Left Panel). Scale bars 50 μm. Quantification of B220 positive area and cell number (Middle and Right Panel) from 23 images (n=13 Nox1WT+5%DSS; n=10 Nox1KO+5%DSS). ****, p<0.0001 (Mann-Whitney test).
Figure 6
Figure 6. M cell signatures and DNMT1 RNA velocity correlated to UC inflammation status, implicating ROS-mediated mechanisms driving chronic inflammation.
A. Box whisker plot of UC patients’ M cell gene signature scores comparing bulk RNASeq (144 inflamed vs. 167 uninflamed rectal UC)-derived composite scores for PC1 (36.7% variance explained). Supplementary table 5 includes scores for the first 10 PCs. B. RNA velocity of DNMT1 in UC stem cells. C. Model for ROS-mediated, genotype-dependent differences in generating lymphoid aggregates, contributing to UC inflammation. i) Healthy: wild-type NOX1-mediated maintenance of the stem cell niche, ii) Inflamed/TNFα: expansion of CCL20+ cells generally, recruiting CCR6+ lymphocytes, and iii) Inflamed/TNFα/Nox1KO: ROS deficiency, together with TNFα treatment, induces M cells expansion and leads to basal lymphoplasmacytosis.

References

    1. Rae J, Newburger PE, Dinauer MC, et al. X-Linked chronic granulomatous disease: mutations in the CYBB gene encoding the gp91-phox component of respiratory-burst oxidase. Am J Hum Genet 1998;62:1320–31. doi:10.1086/301874 - DOI - PMC - PubMed
    1. Matute JD, Arias AA, Wright NAM, et al. A new genetic subgroup of chronic granulomatous disease with autosomal recessive mutations in p40 phox and selective defects in neutrophil NADPH oxidase activity. Blood 2009;114:3309–15. doi:10.1182/blood-2009-07-231498 - DOI - PMC - PubMed
    1. Winkelstein JA, Marino MC, Johnston RB, et al. Chronic granulomatous disease. Report on a national registry of 368 patients. Medicine (Baltimore) 2000;79:155–69. doi:10.1097/00005792-200005000-00003 - DOI - PubMed
    1. Segal BH, Leto TL, Gallin JI, et al. Genetic, biochemical, and clinical features of chronic granulomatous disease. Medicine (Baltimore) 2000;79:170–200. doi:10.1097/00005792-200005000-00004 - DOI - PubMed
    1. Huang C, De Ravin SS, Paul AR, et al. Genetic Risk for Inflammatory Bowel Disease Is a Determinant of Crohn’s Disease Development in Chronic Granulomatous Disease. Inflamm Bowel Dis 2016;22:2794–801. doi:10.1097/MIB.0000000000000966 - DOI - PMC - PubMed

Publication types