. 2022 Oct;10(10):e005020.
doi: 10.1136/jitc-2022-005020.

Blockades of effector T cell senescence and exhaustion synergistically enhance antitumor immunity and immunotherapy

Affiliations

Blockades of effector T cell senescence and exhaustion synergistically enhance antitumor immunity and immunotherapy

Xia Liu et al. J Immunother Cancer. 2022 Oct.

Abstract

Background: Current immunotherapies still have limited successful rates among cancers. It is now recognized that T cell functional state in the tumor microenvironment (TME) is a key determinant for effective antitumor immunity and immunotherapy. In addition to exhaustion, cellular senescence in tumor-infiltrating T cells (TILs) has recently been identified as an important T cell dysfunctional state induced by various malignant tumors. Therefore, a better understanding of the molecular mechanism responsible for T cell senescence in the TME and development of novel strategies to prevent effector T cell senescence are urgently needed for cancer immunotherapy.

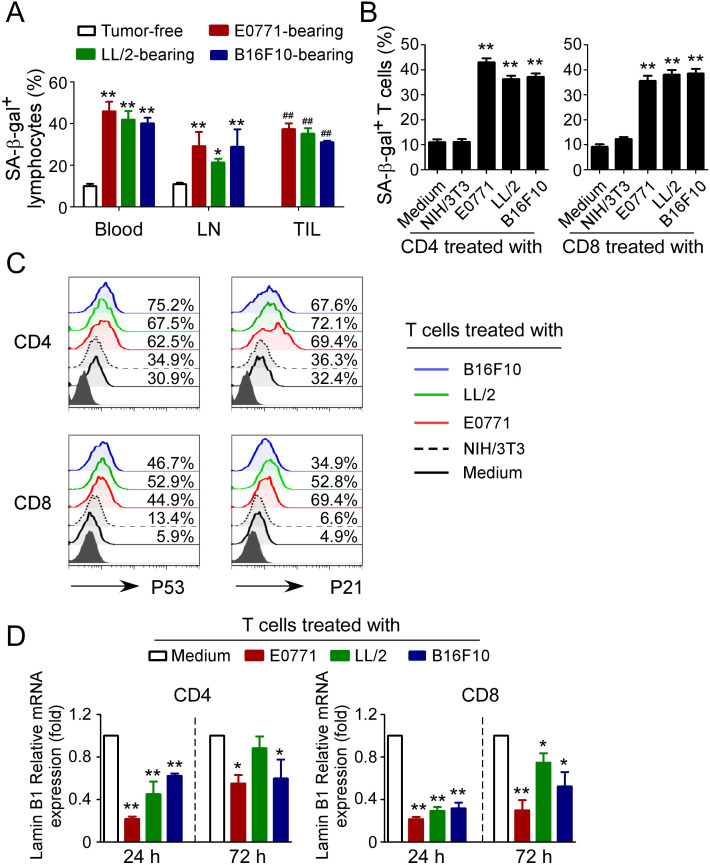
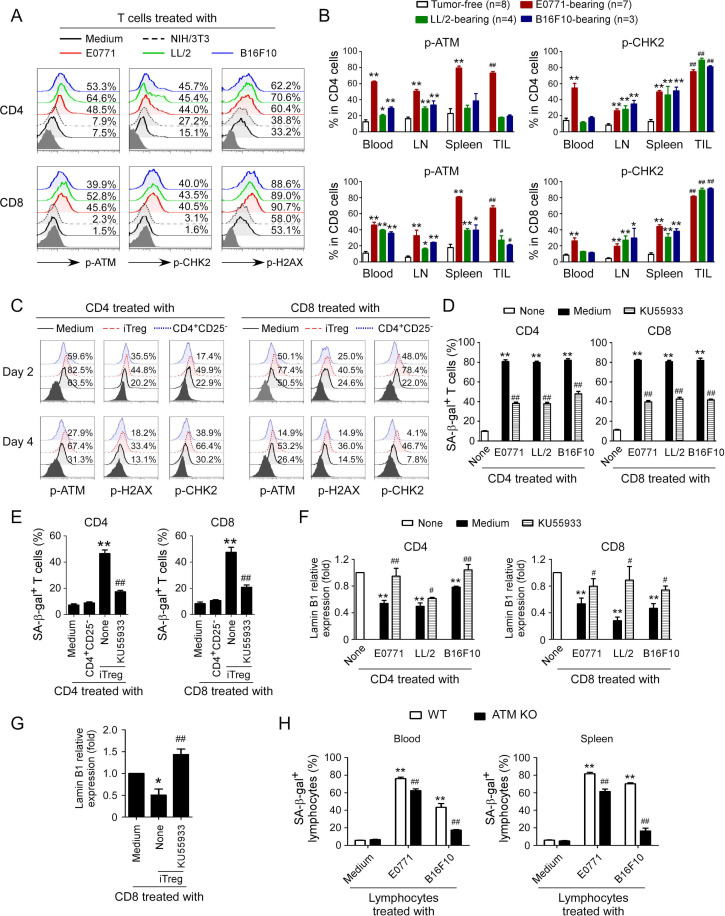
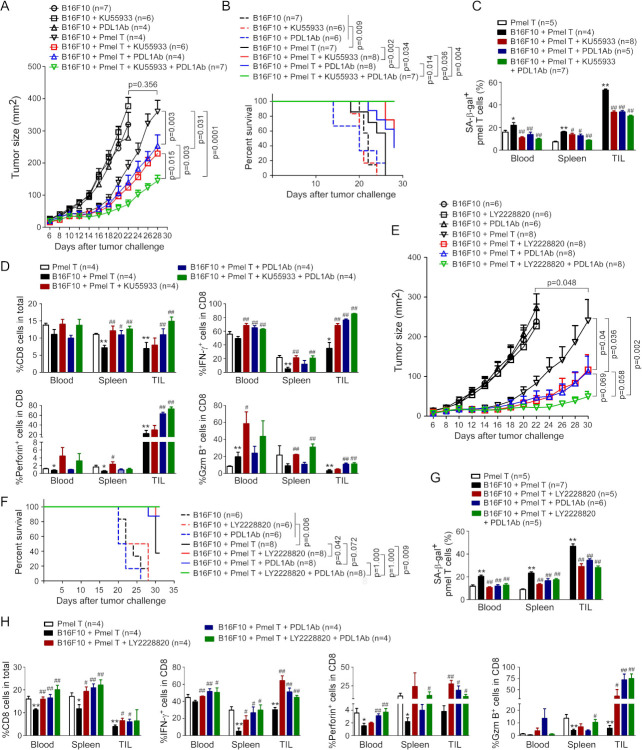
Methods: Senescent T cell populations in the TMEs in mouse lung cancer, breast cancer, and melanoma tumor models were evaluated. Furthermore, T cell senescence induced by mouse tumor and regulatory T (Treg) cells in vitro was determined with multiple markers and assays, including real-time PCR, flow cytometry, and histochemistry staining. Loss-of-function strategies with pharmacological inhibitors and the knockout mouse model were used to identify the potential molecules and pathways involved in T cell senescence. In addition, melanoma mouse tumor immunotherapy models were performed to explore the synergistical efficacy of antitumor immunity via prevention of tumor-specific T cell senescence combined with anti-programmed death-ligand 1 (anti-PD-L1) checkpoint blockade therapy.

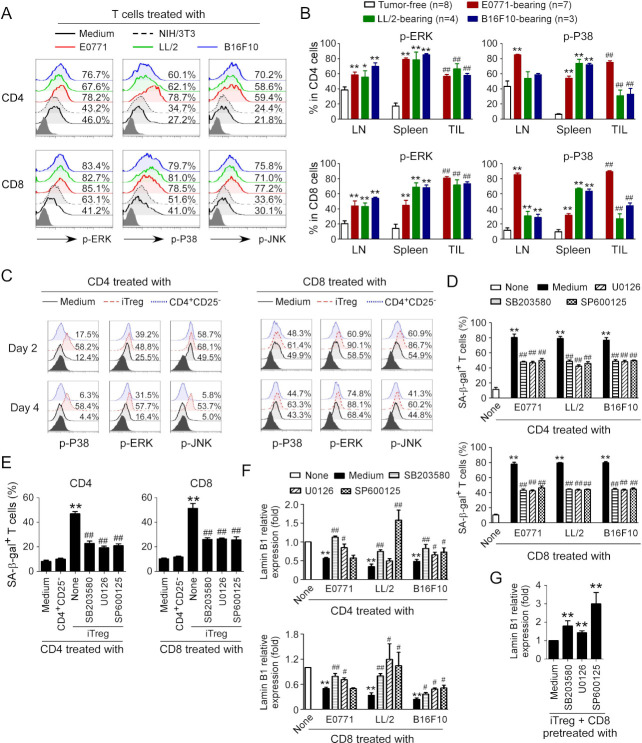
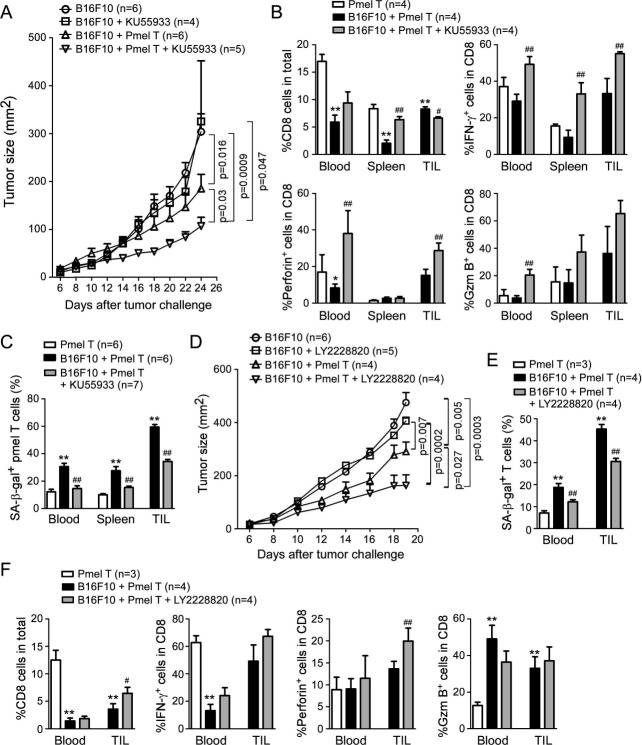
Results: We report that both mouse malignant tumor cells and Treg cells can induce responder T cell senescence, similar as shown in human Treg and tumor cells. Accumulated senescent T cells also exist in the TME in tumor models of lung cancer, breast cancer and melanoma. Induction of ataxia-telangiectasia mutated protein (ATM)-associated DNA damage is the cause for T cell senescence induced by both mouse tumor cells and Treg cells, which is also regulated by mitogen-activated protein kinase (MAPK) signaling. Furthermore, blockages of ATM-associated DNA damage and/or MAPK signaling pathways in T cells can prevent T cell senescence mediated by tumor cells and Treg cells in vitro and enhance antitumor immunity and immunotherapy in vivo in adoptive transfer T cell therapy melanoma models. Importantly, prevention of tumor-specific T cell senescence via ATM and/or MAPK signaling inhibition combined with anti-PD-L1 checkpoint blockade can synergistically enhance antitumor immunity and immunotherapy in vivo.

Conclusions: These studies prove the novel concept that targeting both effector T cell senescence and exhaustion is an effective strategy and can synergistically enhance cancer immunotherapy.

Keywords: Immunotherapy; Melanoma; T-Lymphocytes; Tumor Escape; Tumor Microenvironment.


Conflict of interest statement

Competing interests: None declared.

Figures

Figure 1
Figure 1
Mouse tumor cells promote senescence development in T cells. (A) Accumulated senescent lymphocytes existed in different organs and tumor tissues in E0771, LL/2, and B16F10 tumor-bearing mice. Blood, lymph nodes (LNs), and tumor tissues were harvested from the tumor-bearing mice when primary tumors reached 10–15 mm in diameter. Lymphocytes were purified and stained for SA-β-gal. Lymphocytes purified from tumor-free littermates included as controls. Data shown are mean±SD from 3 to 8 mice in each group. *P<0.05 and **p<0.01, compared with the respective lymphocytes from tumor-free mice. ##P<0.01, compared with the lymphocytes purified from blood in tumor-free mice. (B) Different mouse tumor cell lines (E0771, LL/2, and B16F10) induced SA-β-gal expression in T cells in vitro. Anti-CD3/CD28-activated CD4+ or CD8+ T cells were cocultured with mouse breast cancer (E0771), lung cancer (LL/2), melanoma (B16F10) tumor cells, or control embryonic fibroblast cell line (NIH/3T3) at a ratio of 1:1 for 1 day. The treated T cells were then separated and stained for SA-β-gal after culture for additional 3 days. Data shown are mean±SD from three independent experiments. **P<0.01, compared with the medium only group. (C) Mouse tumor cell treatment upregulated expression of cell cycle regulatory molecules P53 and P21 in responder T cells. Cell treatments and procedures were identical to the experiments in figure part B. Expression levels of P53 and P21 were determined by flow cytometry analysis. (D) Mouse tumor cell treatment promoted the loss of Lamin B1 expression in senescent T cells. Cell treatments and ratios were identical to the experiments in (B). Treated T cells were further cocultured for additional 24 hours or 72 hours. mRNA expression levels of Lamin B1 were determined by real-time PCR analysis. The expression level was normalized to HPRT expression and adjusted to the level in the T cell alone group. Data shown are mean±SD from three independent experiments. *P<0.05 and **p<0.01, compared with the respective medium only group. One-way analysis of variance was performed in figure parts A, B, and D. SA-β-gal, senescence-associated β-galactosidase.
Figure 2
Figure 2
Mouse Treg cells induce T cell senescence. (A) Mouse iTreg cells did not induce T cell apoptosis. CD4+ and CD8+ T cells purified from normal mouse spleens were cocultured with iTregs or control CD4+CD25 cells at a ratio of 4:1 in the presence of plate-bound anti-CD3/CD28 antibodies for 2 days or 4 days. Apoptosis in T cells was analyzed after staining with PE-labeled annexin V and 7-AAD. iTreg cells were established with T cells purified from spleens of Foxp3eGFP reporter mice in the presence of rhTGF-β and rhIL-2. (B) iTreg cells promoted expression of cell cycle regulatory molecules P53 and P21 in mouse T cells. Cell treatments and procedures were identical to the experiments in (A). Expression levels of P53 and P21 were determined by flow cytometry analysis. (C) iTreg cell treatment increased SA-β-gal+ T cell populations in responder T cells. Cell treatments and ratios were identical to the experiments in (A). The treated T cells were stained for SA-β-gal. The SA-β-gal+ T cells were identified with dark blue granules indicated by the arrows. Data shown in histograms are mean±SD from three independent experiments. **P<0.01, compared with the medium only group. (D) Mouse iTreg cell treatment induced the loss of Lamin B1 expression in responder T cells. Cell treatments and ratios were identical to the experiments in figure part A. mRNA expression levels of Lamin B1 in treated CD8+ T cells were determined by real-time PCR analysis. The expression level was normalized to HPRT expression and adjusted to the levels in the T cell alone group. Data are mean±SD from three independent experiments. *P<0.05 and **p<0.01, compared with the respective medium only group. (E and F) nTreg cell treatment increased SA-β-gal expression and decreased Lamin B1 expression in responder mouse T cells. CD4+ and CD8+ T cells were cocultured with nTreg cells or control CD4+CD25 cells at a ratio of 4:1 or 2:1 in the presence of plate-bound anti-CD3/CD28 antibodies for 3 days. The treated T cells were stained for SA-β-gal (in figure part E). mRNA expression levels of Lamin B1 were determined by real-time PCR analysis (in figure part F). The expression level was normalized to HPRT expression and adjusted to the levels in the T cell alone group. Data are mean±SD from three independent experiments. *P<0.05 and **p<0.01, compared with the respective medium only group. One-way analysis of variance was performed in figure parts C, E, and F. Paired Student’s t-test was performed in D. 7-AAD, 7-amino-actinomycin; SA-β-gal, senescence-associated β-galactosidase.
Figure 3
Figure 3
ATM-associated DNA damage response involves T cell senescence induced by Treg and tumor cells. (A) Phosphorylated activation of ATM and other associated molecules H2AX and CHK2 in both CD4+ and CD8+ T cells treated with different mouse tumor cell lines. Preactivated mouse CD4+ and CD8+ T cells were cocultured with E0771, LL/2, and B16F10 tumor cells, or NIH/3T3 fibroblasts at a ratio of 1:1 for 1 day. The treated T cells were then separated and cultured for additional 3 days. The p-ATM, p-H2AX, and p-CHK2 expression in treated T cells were analyzed by flow cytometry. (B) T cells purified from different organs and tumors in E0771, LL/2, and B16F10 tumor-bearing mice had activated phosphorylation of ATM and CHK2. Blood, LNs, spleens, and tumor tissues were harvested from the tumor-bearing mice when primary tumors reached 10–15 mm in diameter. T cells purified from tumor-free littermates included as controls. The p-ATM and p-CHK2 expression levels in T cells were analyzed by flow cytometry. Data shown are mean±SD from 3 to 8 mice in each group. *P<0.05 and **p<0.01, compared with the respective T cells in tumor-free mice. ##P<0.01, compared with the T cells purified from blood in tumor-free mice. (C) Phosphorylated activation of ATM, H2AX, and CHK2 in both CD4+ T and CD8+ T cells treated with iTreg cells. CD4+ and CD8+ T cells were cocultured with iTregs or control CD4+CD25 cells at a ratio of 4:1 in the presence of plate-bound anti-CD3/CD28 antibodies for 2 days or 4 days. The p-ATM, p-H2AX, and p-CHK2 expression levels in treated T cells were analyzed by flow cytometry. (D) Treatment with KU55933 dramatically prevented T cell senescence induced by tumor cells. Preactivated CD4+ and CD8+ T cells were treated with ATM inhibitor KU55933 (10 μM) for 24 hours and then cocultured with different types of tumor cells at a ratio of 1:1 for 1 day. The treated T cells were separated and stained for SA-β-gal after culture for additional 3 days. Data shown are mean±SD from three independent experiments with similar results. **P<0.01, compared with the T cells in medium only group. ##P<0.01, compared with T cell and tumor cell coculture group without KU55933 treatment. (E) Treatment with KU55933 markedly reduced senescent T cell populations in responder T cells induced by iTreg cells. Naïve CD4+ and CD8+ T cells were pretreated with ATM inhibitor KU55933 (10 μM) for 24 hours and then cocultured with iTreg cells at a ratio of 4:1 in anti-CD3/CD28 coated (2 µg/mL) plates for 3 days. The treated T cells were purified and stained for SA-β-gal. Data shown are mean±SD from three independent experiments with similar results. **P<0.01, compared with the T cells in medium only group. ##P<0.01, compared with T cells and the Treg coculture group without KU55933 treatment. (F and G) KU55933 treatment reversed the loss of Lamin B1 expression in responder T cells mediated by tumor cells and iTreg cells. Cell treatment and procedures were identical to the experiments in figure parts D or E. The treated T cells were then purified, and Lamin B1 mRNA expression levels in senescent T cells induced by tumor cells (F) or iTreg cells (G) were evaluated with the real-time qPCR and then normalized to HPRT expression level and adjusted to the levels in T cell in medium only (served as 1). Data shown are mean±SD from three independent experiments with similar results. *P<0.05 and **p<0.01, compared with the T cells in the medium only group. ##P<0.01, compared with the T cell coculture group without KU55933 treatment. (H) ATM knockout in lymphocytes prevented cell senescence induced by tumor cells. Anti-CD3/CD28 antibodies preactivated lymphocytes purified from the blood and spleens of ATM−/− mice or wild-type (WT) mice were cocultured with mouse E0771 or B16F10 cells at a ratio of 1:1 for 1 day. The treated lymphocytes were then separated and stained for SA-β-gal after culture for additional 3 days. Data shown are mean±SD from three independent experiments. **P<0.01, compared with lymphocyte only group from WT mice, and ##p<0.01, compared with lymphocytes from WT mice cocultured with tumor cells. One-way analysis of variance was performed in B, D, E, F, G, and H. Paired Student’s t-test was also performed in D, E, F, G, and H. SA-β-gal, senescence-associated β-galactosidase.
Figure 4
Figure 4
MAPK signaling controls T cell senescence induced by Treg and tumor cells. (A) Phosphorylated activation of ERK, P38, and JNK in both CD4+ T and CD8+ T cells treated with different types of mouse tumor cell lines. Anti-CD3/CD28 preactivated mouse CD4+ T and CD8+ T cells were cocultured with E0771, LL/2, and B16F10 tumor cells, or control NIH/3T3 cells at a ratio of 1:1 for 1 day. The treated T cells were then separated and cultured for additional 3 days. Expression of p-ERK, p-P38, and p-JNK in treated T cells was analyzed by flow cytometry. (B) T cells purified from different organs and tumors in E0771, LL/2, and B16F10 tumor-bearing mice had increased phosphorylation levels of ERK and P38. LNs, spleens, and tumor tissues were harvested from the indicated tumor-bearing mice when primary tumors reached 10–15 mm in diameters. T cells purified from tumor-free littermates served as controls. The p-ERK and p-P38 expression levels in T cells were analyzed by flow cytometry. Data shown are mean±SD from 3 to 8 mice in each group. *P<0.05 and **p<0.01, compared with the respective T cells in tumor-free mice. ##P<0.01 compared with the T cells from spleen in tumor-free mice. (C) Phosphorylated activation of ERK, P38, and JNK in both CD4+ T and CD8+ T cells treated with iTreg cells. CD4+ and CD8+ T cells were cocultured with iTregs or control CD4+CD25- T cells at a ratio of 4:1 in the presence of plate-bound anti-CD3/CD28 antibodies for 2 days or 4 days. The p-ERK, p-P38, and p-JNK expression levels in treated T cells were analyzed by flow cytometry. (D and E) Treatment with MAPK signaling inhibitors dramatically reduced senescent T cell induction in responder T cells mediated by tumor cells (in figure part D) and iTreg cells (in figure part E). Preactivated CD4+ and CD8+ T cells were treated with ERK inhibitor U0126 (10 μM), P38 inhibitor SB203580 (10 μM), or JNK inhibitor SP600125 (10 μM) for 24 hours and then cocultured with different types of tumor cells (in figure part D) or iTreg cells (in figure part E). The cell coculture and procedures were identical to experiments in figure parts A or C, respectively. The treated T cells were separated and stained for SA-β-gal. Data shown are mean±SD from three independent experiments with similar results. **P<0.01, compared with the T cells in medium only group. ##P<0.01, compared with the respective cell coculture group without inhibitor treatment. (F and G) Inhibition of MAPK signaling pathways reversed the loss of Lamin B1 expression in responder T cells mediated by tumor cells (in figure part F) and iTreg cells (in figure part G). Cell treatment and procedures were identical as in figure parts D and E. Treated T cells were purified, and Lamin B1 mRNA expression levels in senescent T cells induced by tumor cells (F) or iTreg cells (G) were evaluated with real-time qPCR and then normalized to HPRT expression level and adjusted to the levels in T cells in medium only (served as 1). Data shown are mean±SD from three independent experiments with similar results. **P<0.01, compared with the T cells in medium only group. #P<0.05 and ##p<0.01, compared with the respective T cell coculture group without inhibitor treatment. One-way analysis of variance was performed in B, D, E, F, and G. LNs, lymph nodes; SA-β-gal, senescence-associated β-galactosidase.
Figure 5
Figure 5
Prevention of tumor-specific T cell senescence by blocking DNA damage and/or MAPK signaling enhances antitumor immunity in vivo. (A) Administration of ATM inhibitor KU55933 enhanced antitumor immunity against melanoma mediated by Pmel-1 T cells. Mouse B1610 tumor cells (2×10⁵/mouse) were subcutaneously injected into C57BL/6 mice. The activated Pmel-1 T cells (2×10⁶) were adoptively transferred through intravenous injection into B16F10-bearing mice at day 6 post-tumor inoculation. KU55933 (10 mg/kg/mouse) was injected intraperitoneally into the mice at day 1, 4, 7, and 10 after T cell transfer. Tumor volumes were measured and presented as mean±SD (n=4–6 mice/group). (B) KU55933 treatment significantly increased IFN-γ+, granzyme B+, perforin+, and CD8+ cell populations in lymphocytes from different organs and tumor tissues in B16F10-bearing mice. Cell treatment and adoptive transfer procedures were identical as in figure part A. Blood, spleens, and tumors were harvested at day 24 post-tumor injection. Lymphocytes were separated from different organs and tumor tissues, and T cell subpopulations were analyzed by flow cytometry. Data shown are mean±SD from different groups (n=4 mice/group). *P<0.05 and **p<0.01, compared with the T cell adoptive transfer only group. #P<0.05 and ##p<0.01, compared with the adoptive transfer T cells in tumor-bearing mice without KU55933 treatment group. (C) Injection of KU55933 markedly prevented induction of senescence in transferred Pmel-1 T cells in B16F10-bearing mice. Cell treatment and adoptive transfer procedures were identical as in figure parts A and B. The transferred Pmel-1 T cells in different organs and tumors were isolated and stained for SA-β-gal. Data shown are mean±SD from 6 to 7 mice each group. **P<0.01, compared with the T cell adoptive transfer only group. ##p<0.01, compared with the adoptive transfer T cells in tumor-bearing mice without KU55933 treatment group. (D) Administration of P38 inhibitor LY2228820 enhanced antitumor immunity against melanoma mediated by Pmel-1 T cells. Mouse B1610 tumor cells (2×10⁵/mouse) were subcutaneously injected into Rag1−/− mice. The activated Pmel-1 T cells (2×10⁶) were adoptively transferred through intravenous injection into B16F10-bearing mice at day 6 post-tumor inoculation. LY2228820 (2 mg/kg/mouse) was injected intraperitoneally into the mice at day 1, 4, 7, and 10 after T cell transfer. Tumor volumes were measured and presented as mean±SD (n=4–6 mice per group). (E) Inhibition of P38 signaling with LY2228820 markedly blocked the induction of senescence in transferred Pmel-1 T cells in B16F10-bearing mice. Cell treatment and adoptive transfer procedures were identical as in figure part D. Blood and tumors were harvested at day 19 post-tumor injection. The transferred Pmel-1 T cells in blood and tumors were isolated and stained for SA-β-gal expression. Data shown are mean±SD from 3 to 4 mice each group. **P<0.01, compared with the T cell adoptive transfer only group. ##P<0.01, compared with the adoptive transfer T cells in tumor-bearing mice without LY2228820 treatment group. (F) LY2228820 treatment significantly increased IFN-γ+, granzyme B+, perforin+, and CD8+ cell populations in lymphocytes in B16F10-bearing mice. Cell treatment and adoptive transfer procedures were identical as in figure parts D and E. The transferred Pmel-1 T cells in blood and tumors were isolated, and T cell subpopulations were analyzed by flow cytometry. Data shown are mean±SD from different groups (n=3–4 mice/group). **P<0.01, compared with the T cell adoptive transfer only group. #P<0.05 and ##p<0.01, compared with the adoptive transfer T cells in tumor-bearing mice without LY2228820 treatment group. One-way analysis of variance was performed in figure parts A, B, C, D, E, and F. SA-β-gal, senescence-associated β-galactosidase.
Figure 6
Figure 6
Reversal of tumor-specific T cell senescence combined with anti-PD-L1 checkpoint blockade therapy synergistically enhance antitumor immunity in vivo. (A) Combination treatments with KU55933 and anti-PD-L1 antibody synergistically enhanced antitumor immunity against melanoma mediated by Pmel-1 T cells. Mouse B1610 tumor cells (2×10⁵/mouse) were subcutaneously injected into C57BL/6 mice. The preactivated Pmel-1 T cells (2×10⁶/mouse) were adoptively transferred through intravenous injection into B16F10-bearing mice at day 6 post-tumor inoculation. KU55933 (10 mg/kg/mouse) and/or anti-PD-L1 antibody (50 µg/mouse) were injected intraperitoneally into the mice at day 1, 4, 7, and 10 after T cell adoptively transfer. Tumor volumes were measured and presented as mean±SD (n=4–7 mice per group). (B) Combination treatments with KU55933 and anti-PD-L1 antibody prolonged survival of tumor-bearing mice mediated by Pmel-1 T cells. Cell treatment and adoptive transfer procedure were identical to the experiments in figure part A. Mouse survival was determined based on the ethical consideration of tumor size (tumor volume >2000 mm3) and evaluated with Kaplan-Meier analysis. (C) Administration of KU55933 combined with anti-PD-L1 blockade markedly prevented induction of senescence in transferred Pmel-1 T cells in B16F10-bearing mice. Cell treatment and adoptive transfer procedure were identical to figure part A. Blood, spleens, and tumors were harvested at day 28 post-tumor injection. The transferred Pmel-1 T cells in different organs and tumors were isolated and stained for SA-β-gal. Data shown are mean±SD from four to eight mice in each group. *P<0.05 and **p<0.01, compared with the T cell adoptive transfer only group. #P<0.05 and ##p<0.01, compared with the T cell transfer in B16F10 tumor-bearing mice group. (D) Administration of KU55933 combined with anti-PD-L1 blockade significantly increased IFN-γ+, granzyme B+, perforin+, and CD8+ cell populations in transferred Pmel-1 T cells in B16F10-bearing mice. Cell treatment and adoptive transfer procedure were identical to figure part A. Lymphocytes were separated from different organs and tumor tissues, and T cell subpopulations were analyzed by flow cytometry. Data shown are mean±SD from different groups (n=4 mice/group). *P<0.05 and **p<0.01, compared with the T cell adoptive transfer alone group. #P<0.05 and ##p<0.01, compared with the T cell transfer in B16F10 tumor-bearing mice group. (E) Combination treatments with P38 inhibitor LY2228820 and anti-PD-L1 antibody synergistically enhanced antitumor immunity against melanoma mediated by Pmel-1 T cells. Mouse B1610 tumor cells (2×10⁵/mouse) were subcutaneously injected into C57BL/6 mice. The preactivated Pmel-1 T cells (2×10⁶/mouse) were adoptively transferred through intravenous injection into B16F10-bearing mice at day 6 post-tumor inoculation. LY2228820 (2.5 mg/kg/mouse) or/and anti-PD-L1 antibody (50 μg/mouse) were injected intraperitoneally into the mice at day 1, 4, 7, and 10 after T cell adoptively transfer. Tumor volumes were measured and presented as mean±SD (n=6–8 mice per group). (F) Combination treatments with LY2228820 and anti-PD-L1 antibody prolonged survival of tumor-bearing mice mediated by Pmel-1 T cells. Cell treatment and adoptive transfer procedure were identical to the experiments in figure part E. Mouse survival was determined based on the ethical consideration of tumor size (tumor volume >2000 mm3) and evaluated with Kaplan-Meier analysis. (G) Administration of LY2228820 combined with anti-PD-L1 antibody markedly blocked the induction of senescence in transferred Pmel-1 T cells in B16F10-bearing mice. Cell treatment and adoptive transfer procedures were identical to figure part E. Blood, spleens, and tumors were harvested at day 30 post-tumor injection. The transferred Pmel-1 T cells in different organs and tumors were isolated and stained for SA-β-gal. Data shown are mean±SD from five to seven mice in each group. **P<0.01, compared with the T cell adoptive transfer only group. #P<0.05 and ##p<0.01, compared with the T cell transfer in B16F10 tumor-bearing mice group. (H) Administration of LY2228820 combined with anti-PD-L1 antibody blockade increased IFN-γ+, granzyme B+, perforin+, and CD8+ cell populations in transferred Pmel-1 T cells in B16F10-bearing mice. Cell treatment and adoptive transfer procedure were identical to (E). Lymphocytes were separated from different organs and tumor tissues, and T cell subpopulations were analyzed by flow cytometry. Data shown are mean±SD from different groups (n=4 mice/group). *P<0.05 and **p<0.01, compared with the T cell adoptive transfer alone group. #P<0.05 and ##p<0.01, compared with the T cell transfer in B16F10 tumor-bearing mice group. One-way analysis of variance and unpaired Student’s t-test was performed in A, C, D, E, G, and H. SA-β-gal, senescence-associated β-galactosidase.

Similar articles

Cited by

References

    1. Thommen DS, Schumacher TN. T cell dysfunction in cancer. Cancer Cell 2018;33:547–62. 10.1016/j.ccell.2018.03.012 - DOI - PMC - PubMed
    1. Zhao Y, Shao Q, Peng G. Exhaustion and senescence: two crucial dysfunctional states of T cells in the tumor microenvironment. Cell Mol Immunol 2020;17:27–35. 10.1038/s41423-019-0344-8 - DOI - PMC - PubMed
    1. McLane LM, Abdel-Hakeem MS, Wherry EJ. CD8 T cell exhaustion during chronic viral infection and cancer. Annu Rev Immunol 2019;37:457–95. 10.1146/annurev-immunol-041015-055318 - DOI - PubMed
    1. Sharma P, Allison JP. The future of immune checkpoint therapy. Science 2015;348:56–61. 10.1126/science.aaa8172 - DOI - PubMed
    1. Marin-Acevedo JA, Dholaria B, Soyano AE, et al. . Next generation of immune checkpoint therapy in cancer: new developments and challenges. J Hematol Oncol 2018;11:39. 10.1186/s13045-018-0582-8 - DOI - PMC - PubMed

Publication types

Substances