. 2022 Dec;28(12):1621-1642.
doi: 10.1261/rna.079416.122. Epub 2022 Oct 3.

Ribosome-bound Upf1 forms distinct 80S complexes and conducts mRNA surveillance

Affiliations

Ribosome-bound Upf1 forms distinct 80S complexes and conducts mRNA surveillance

Robin Ganesan et al. RNA. 2022 Dec.

Abstract

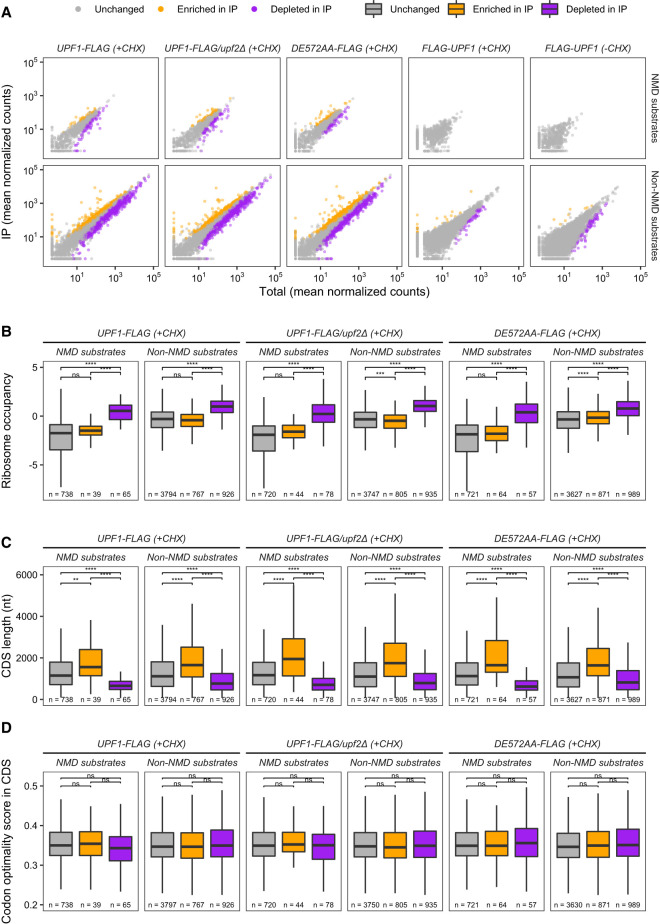
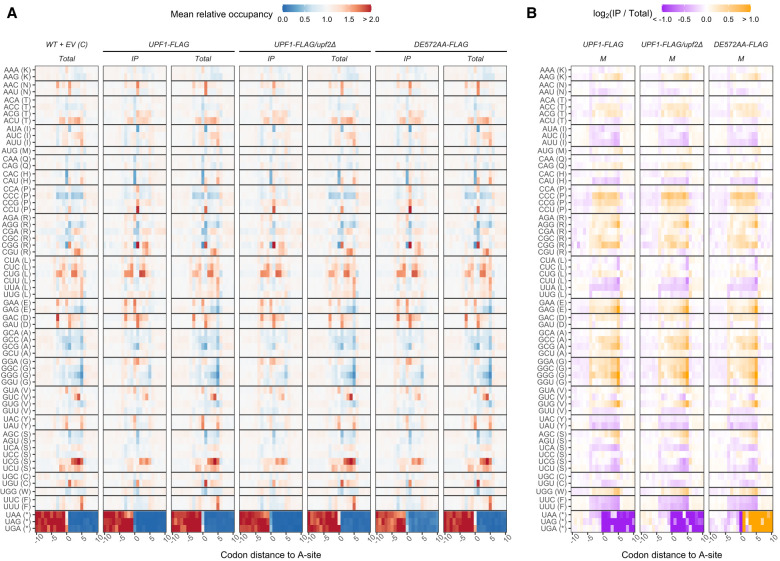
Upf1, Upf2, and Upf3, the central regulators of nonsense-mediated mRNA decay (NMD), appear to exercise their NMD functions while bound to elongating ribosomes, and evidence for this conclusion is particularly compelling for Upf1. Hence, we used selective profiling of yeast Upf1:ribosome association to define that step in greater detail, understand whether the nature of the mRNA being translated influences Upf1:80S interaction, and elucidate the functions of ribosome-associated Upf1. Our approach has allowed us to clarify the timing and specificity of Upf1 association with translating ribosomes, obtain evidence for a Upf1 mRNA surveillance function that precedes the activation of NMD, identify a unique ribosome state that generates 37-43 nt ribosome footprints whose accumulation is dependent on Upf1's ATPase activity, and demonstrate that a mutated form of Upf1 can interfere with normal translation termination and ribosome release. In addition, our results strongly support the existence of at least two distinct functional Upf1 complexes in the NMD pathway.

Keywords: NMD substrates; Upf proteins; selective ribosome profiling.


Figures

FIGURE 1.
FIGURE 1.
Stoichiometric recovery of FLAG-tagged Upf1 with ribosomal proteins. Input (Total) and immunopurified ribosomes (IP) from different lysates were analyzed by mass spectrometry. Intensity-based absolute quantification (iBAQ) was performed and normalized across biosamples. (A) Average iBAQ of biological replicates, log10-transformed, of proteins identified from IP were plotted against those from the Total ribosomes. Proteins exclusively identified in either Total or IP are plotted on the x- or y-axis, respectively. (B) Differential abundance analysis was performed for proteins detected in both IP and Total samples using R package limma (Smyth 2004; Kammers et al. 2015). Negative log10 P-values adjusted by Benjamini–Hochberg method were plotted against log2 fold change in protein abundance in IP over Total. Gray vertical dashed line indicates log2 fold change of zero (no change). Positive log2 fold change (right of vertical line) are proteins enriched in IP. Negative log2 fold change (left of vertical line) are proteins depleted in IP. Gray horizontal dashed line indicates the cutoff of adjusted P-value at 0.05; proteins above this cutoff have significant changes. Two biological replicates of FLAG-UPF1 strains, three biological replicates of UPF1-FLAG strains, and one sample of the negative control experiment (6XHis-UPF1) were analyzed.
FIGURE 2.
FIGURE 2.
Distribution of footprint length for each strain and cycloheximide treatment condition. Fractions of each footprint length (nt) were calculated and averaged among replicates. Green and red lines indicate libraries prepared in the absence and presence of cycloheximide, respectively. Dashed and solid lines represent total and immunopurified (IP) ribosomes, respectively. Gray shaded areas highlight different classes of footprint size: from left to right, 20–23 nt = small (S), 27–32 nt = medium (M), and 37–43 nt = large (L). (A) Data from libraries prepared from two biological replicates of amino-terminally FLAG-tagged strains and their WT + EV control. (B) Data from libraries prepared from three biological replicates of carboxy-terminally FLAG-tagged strains and their WT + EV control.
FIGURE 3.
FIGURE 3.
Atypically large footprints are attributable to a 5′ extension of the mRNA region protected by the ribosome. Mapping of the 5′ and 3′ ends of footprint lengths 25–45 nt relative to the start and stop codons (red dashed lines) from IP libraries of FLAG-UPF1, UPF1-FLAG, and UPF1-FLAG/upf2Δ (+CHX). For each footprint length, footprint count at each nucleotide position relative to the start or stop reference codons were normalized to the total footprint count in the library, and these normalized counts from biological replicates were averaged. Different footprint lengths align at the 3′ ends but diverge at the 5′ ends. L and M fragment size classes are as indicated for each sample. Lines at the bottom of the figure indicate the approximate 5′ and 3′ limits of the L and M fragments over the start and stop reference codons.
FIGURE 4.
FIGURE 4.
Upf1 progressively associates with ribosomes across mRNA coding regions except when Upf1 association forms L footprints. Distribution of footprint abundance across the coding region (CDS) for each footprint size class from total (purple) or IP (orange) ribosomes profiling libraries. (A) Small (S) and medium (M) footprint distribution from strains expressing WT + EV and FLAG-UPF1 in the absence of CHX treatment. (B) Medium (M) and large (L) footprint distribution from strains expressing WT + EV and FLAG-UPF1 in the presence of CHX. (C) Medium (M) and large (L) footprint distribution from CHX-treated cells expressing WT + EV, UPF1-FLAG, UPF1-FLAG/upf2Δ, or upf1DE572AA-FLAG. Each gene's CDS was divided into 100 bins and the percentage of footprints’ P-sites belonging to each bin in all genes was calculated. Gray dashed line signifies a theoretical number where each percentage of CDS contains an equivalent number of footprints for a sum of 100% across all 100 bins. (D) Distribution of dominant footprint (red = Medium, M for +CHX; green = Small, S for −CHX) abundance across the coding region. Data is the same as used in A and B top panels but replotted in such a way to directly observe the differences or similarity in footprint distribution between the absence and presence of CHX during the library preparation of each strain.
FIGURE 5.
FIGURE 5.
Characteristics of mRNAs enriched or depleted for Upf1-associated ribosomes. (A) Results of differential expression analyses by DESeq2 between mRNA abundance in IP versus Total ribosome profiling libraries of each strain and CHX treatment. False discovery rate (FDR) with a threshold of 0.05 was used to determine significant differential expression. mRNAs with adjusted P-value <0.05 and positive log2(IP/Total) were considered enriched in IP libraries (orange), whereas those with adjusted P-value <0.05 and negative log2(IP/Total) were considered depleted in IP libraries (purple); otherwise, their abundance did not differ (“unchanged”) between IP and Total (gray). (BD) Comparative analyses of ribosome occupancy (B), coding sequence length (C), and codon optimality score (D) between mRNA groups identified in A. Two-tailed Wilcoxon's rank sum test with FDR method for multiple testing correction was used to compare each pair of mRNA groups. Symbols for levels of significance are ns: P > 0.05, (*) P < 0.05, (**) P < 0.01, (***) P < 0.001, (****) P < 0.0001. Number of mRNAs in each group is provided. Outlier mRNAs (those beyond the whiskers of box plots) were included in the analyses but omitted from plotting.
FIGURE 6.
FIGURE 6.
Codon occupancy for individual codon identity in the A-site and its surrounding codon positions in carboxy-terminally FLAG-tagged UPF1 libraries. (A) Mean relative occupancy values were calculated as described in Materials and Methods. Briefly, read count of major footprint size (M in this case) at each codon position relative to the codon of interest in the A-site was normalized by the average count in the 60-codon window. Thus, mean relative occupancy of 1 (white) indicates that A-site occupancy at that position is no different from the window average. Mean relative occupancy >1 (red) and <1 (blue), respectively, indicate enrichment and depletion of ribosomal A-site at that position compared to window average. Only codons −10 to 10 were plotted. (B) Differences in mean relative occupancy between IP and total libraries. Ratios of mean relative occupancy (from A) of IP to Total, log2-transformed. Thus, log2(IP/Total) of 0 (white) indicates no difference in mean relative occupancy between IP and Total at that codon position, while positive (orange) and negative (purple) log2(IP/Total) indicate, respectively, higher and lower occupancy in IP compared to total at that codon position.
FIGURE 7.
FIGURE 7.
Percentage of footprints in the 3′-UTR region. (A) Percentage of footprints whose P-sites fall into the 3′-UTR region for each library. (B) Percentage of frame 0 footprints within the 3′-UTR region. Horizontal gray dashed line indicates a theoretical percentage of 33% where all three reading frames would be equally represented. For both A and B, percentage calculated from each replicate was plotted as a gray dot. Bar plot represents the average among the three replicates. Two-tailed paired t-test was used to determine significant differences between percentages from IP and Total libraries.
Robin Ganesan
Robin Ganesan
Kotchaphorn Mangkalaphiban

Similar articles

Cited by

References

    1. Amrani N, Ganesan R, Kervestin S, Mangus DA, Ghosh S, Jacobson A. 2004. A faux 3′-UTR promotes aberrant termination and triggers nonsense-mediated mRNA decay. Nature 432: 112–118. 10.1038/nature03060 - DOI - PubMed
    1. Atkin AL, Altamura N, Leeds P, Culbertson MR. 1995. The majority of yeast UPF1 co-localizes with polyribosomes in the cytoplasm. Mol Biol Cell 6: 611–625. 10.1091/mbc.6.5.611 - DOI - PMC - PubMed
    1. Atkin AL, Schenkman LR, Eastham M, Dahlseid JN, Lelivelt MJ, Culbertson MR. 1997. Relationship between yeast polyribosomes and Upf proteins required for nonsense mRNA decay. J Biol Chem 272: 22163–22172. 10.1074/jbc.272.35.22163 - DOI - PubMed
    1. Becker AH, Oh E, Weissman JS, Kramer G, Bukau B. 2013. Selective ribosome profiling as a tool for studying the interaction of chaperones and targeting factors with nascent polypeptide chains and ribosomes. Nat Protoc 8: 2212–2239. 10.1038/nprot.2013.133 - DOI - PMC - PubMed
    1. Boehm V, Kueckelmann S, Gerbracht JV, Kallabis S, Britto-Borges T, Altmuller J, Kruger M, Dieterich C, Gehring NH. 2021. SMG5-SMG7 authorize nonsense-mediated mRNA decay by enabling SMG6 endonucleolytic activity. Nat Commun 12: 3965. 10.1038/s41467-021-24046-3 - DOI - PMC - PubMed

Publication types

MeSH terms