

Low-Cost Platform for Multianimal Chronic Local Field Potential Video Monitoring with Graphical User Interface (GUI) for Seizure Detection and Behavioral Scoring
- PMID: 36192155
- PMCID: PMC9581574
- DOI: 10.1523/ENEURO.0283-22.2022
Low-Cost Platform for Multianimal Chronic Local Field Potential Video Monitoring with Graphical User Interface (GUI) for Seizure Detection and Behavioral Scoring
Abstract
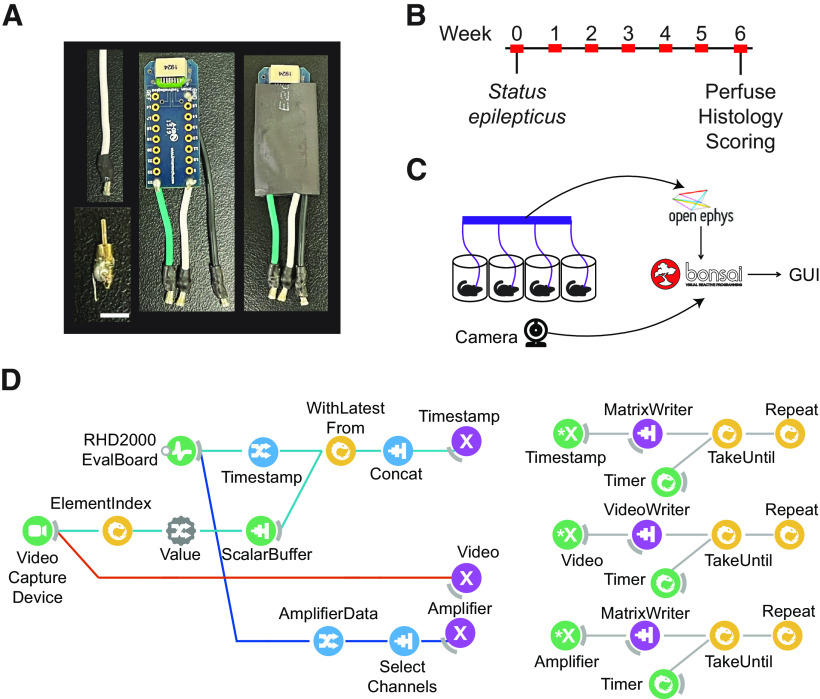
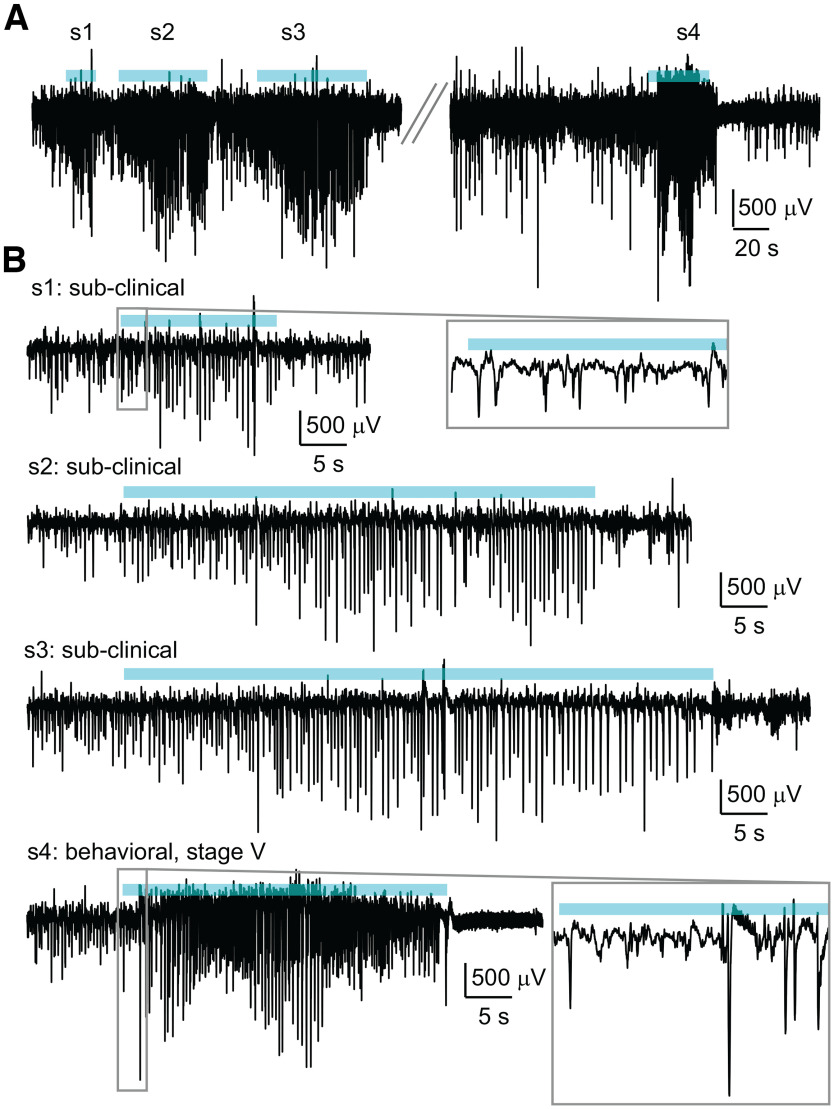
Experiments employing chronic monitoring of neurophysiological signals and video are commonly used in studies of epilepsy to characterize behavioral correlates of seizures. Our objective was to design a low-cost platform that enables chronic monitoring of several animals simultaneously, synchronizes bilateral local field potential (LFP) and video streams in real time, and parses recorded data into manageable file sizes. We present a hardware solution leveraging Intan and Open Ephys acquisition systems and a software solution implemented in Bonsai. The platform was tested in 48-h continuous recordings simultaneously from multiple mice (male and female) with chronic epilepsy. To enable seizure detection and scoring, we developed a graphical user interface (GUI) that reads the data produced by our workflow and allows a user with no coding expertise to analyze events. Our Bonsai workflow was designed to maximize flexibility for a wide variety of experimental applications, and our use of the Open Ephys acquisition board would allow for scaling recordings up to 128 channels per animal.
Keywords: Bonsai-Rx; Intan; Open Ephys; data synchronization; epilepsy; seizure.
Copyright © 2022 Tarcsay et al.
Figures


Similar articles
-
Open source modules for tracking animal behavior and closed-loop stimulation based on Open Ephys and Bonsai.J Neural Eng. 2018 Oct;15(5):055002. doi: 10.1088/1741-2552/aacf45. Epub 2018 Jun 27. J Neural Eng. 2018. PMID: 29946057
-
A portable platform to collect and review behavioral data simultaneously with neurophysiological signals.Annu Int Conf IEEE Eng Med Biol Soc. 2017 Jul;2017:1784-1787. doi: 10.1109/EMBC.2017.8037190. Annu Int Conf IEEE Eng Med Biol Soc. 2017. PMID: 29060234 Review.
-
Open Ephys electroencephalography (Open Ephys + EEG): a modular, low-cost, open-source solution to human neural recording.J Neural Eng. 2017 Jun;14(3):035002. doi: 10.1088/1741-2552/aa651f. Epub 2017 Mar 7. J Neural Eng. 2017. PMID: 28266930 Free PMC article.
-
Recording human electrocorticographic (ECoG) signals for neuroscientific research and real-time functional cortical mapping.J Vis Exp. 2012 Jun 26;(64):3993. doi: 10.3791/3993. J Vis Exp. 2012. PMID: 22782131 Free PMC article.
-
REVEALS: an open-source multi-camera GUI for rodent behavior acquisition.Cereb Cortex. 2024 Oct 3;34(10):bhae421. doi: 10.1093/cercor/bhae421. Cereb Cortex. 2024. PMID: 39420472 Free PMC article.
Cited by
-
Syntalos: a software for precise synchronization of simultaneous multi-modal data acquisition and closed-loop interventions.Nat Commun. 2025 Jan 15;16(1):708. doi: 10.1038/s41467-025-56081-9. Nat Commun. 2025. PMID: 39814800 Free PMC article.
-
Interictal spikes during spatial working memory carry helpful or distracting representations of space and have opposing impacts on performance.bioRxiv [Preprint]. 2024 Nov 14:2024.11.13.623481. doi: 10.1101/2024.11.13.623481. bioRxiv. 2024. PMID: 39605412 Free PMC article. Preprint.
References
-
- Andrade P, Paananen T, Ciszek R, Lapinlampi N, Pitkänen A (2018) Algorithm for automatic detection of spontaneous seizures in rats with post-traumatic epilepsy. J Neurosci Methods 307:37–45. - PubMed
-
- Berger H (1929) Über das elektroenkephalogramm des menschen. Archiv Psychiatrie 87:527–570. 10.1007/BF01797193 - DOI
-
- Buccino AP, Lepperød ME, Dragly SA, Häfliger P, Fyhn M, Hafting T (2018) Open source modules for tracking animal behavior and closed-loop stimulation based on Open Ephys and Bonsai. J Neural Eng 15:e055002. - PubMed
Publication types
MeSH terms
LinkOut - more resources
Full Text Sources