. 2022 Oct 3;13(1):5837.
doi: 10.1038/s41467-022-33543-y.

The mitochondrial calcium uniporter of pulmonary type 2 cells determines severity of acute lung injury

Affiliations

The mitochondrial calcium uniporter of pulmonary type 2 cells determines severity of acute lung injury

Mohammad Naimul Islam et al. Nat Commun. .

Abstract

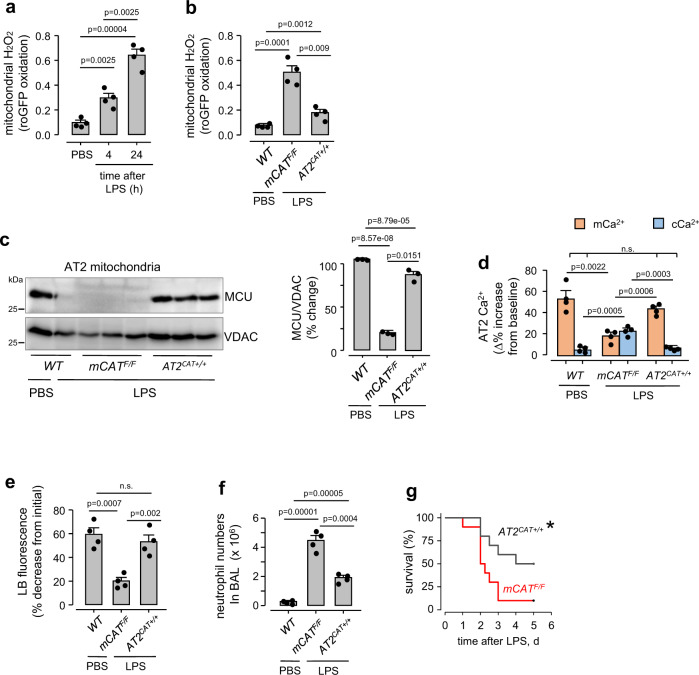
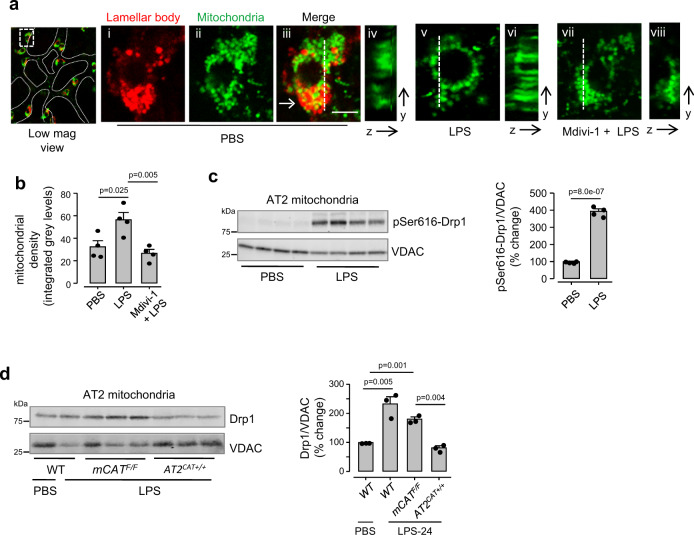
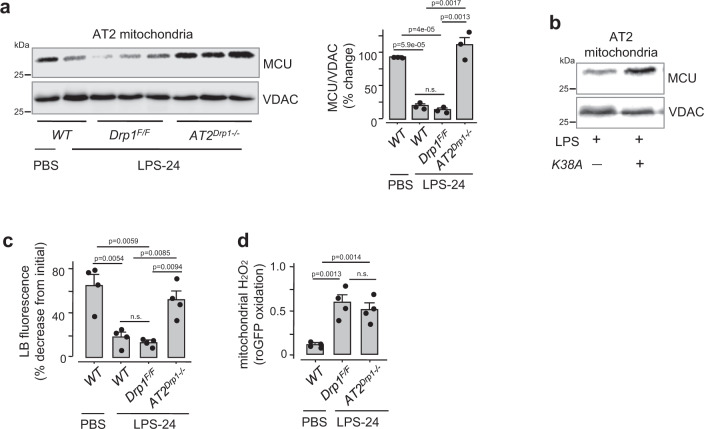
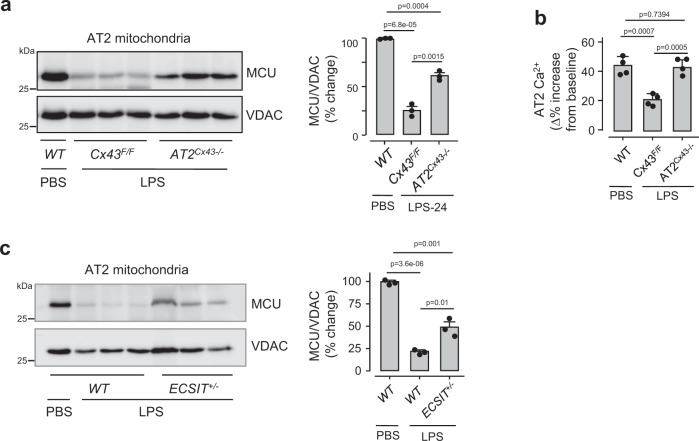
Acute Lung Injury (ALI) due to inhaled pathogens causes high mortality. Underlying mechanisms are inadequately understood. Here, by optical imaging of live mouse lungs we show that a key mechanism is the viability of cytosolic Ca2+ buffering by the mitochondrial Ca2+ uniporter (MCU) in the lung's surfactant-secreting, alveolar type 2 cells (AT2). The buffering increased mitochondrial Ca2+ and induced surfactant secretion in wild-type mice, but not in mice with AT2-specific MCU knockout. In the knockout mice, ALI due to intranasal LPS instillation caused severe pulmonary edema and mortality, which were mitigated by surfactant replenishment prior to LPS instillation, indicating surfactant's protective effect against alveolar edema. In wild-type mice, intranasal LPS, or Pseudomonas aeruginosa decreased AT2 MCU. Loss of MCU abrogated buffering. The resulting mortality was reduced by spontaneous recovery of MCU expression, or by MCU replenishment. Enhancement of AT2 mitochondrial buffering, hence endogenous surfactant secretion, through MCU replenishment might be a therapy against ALI.


Conflict of interest statement

The authors declare no competing interests.

Figures

Fig. 1
Fig. 1. In situ AT2 mitochondrial responses to hyperinflation.
a Confocal images of a live alveolus (alv) show AT2 (arrows) in a septum of the alveolar wall, as identified by Lysotracker Red (LTR) staining. Images show time dependent Ca2+ responses in the cytosol (cCa2+) and mitochondria (mCa2+) of selected AT2 to a single 15-second hyperinflation induced by increasing airway pressure from 5 to 15 cmH2O. Ca2+ dyes were given by alveolar microinfusion. Ca2+ increases are denoted by increases of pseudocolored gray levels. Images were obtained at airway pressure of 5 cmH2O. Scale bar, 10 µm. Repeat images were taken at 3 different locations per lung in 4 lungs per group. b Tracings from an experiment and group data show AT2 Ca2+ responses to hyperinflation (arrow). MCUF/F, mice floxed for the MCU; rtTaCreinactv, mice expressing rtTA-Cre not exposed to doxycycline; rtTaMCU/, mice lacking the MCU in the alveolar epithelium. Bars: mean ± SEM. n = 4 mice per group. Groups were compared using one-way ANOVA with Bonferroni correction. c Group data show hyperinflation-induced surfactant secretion as quantified by loss of AT2 fluorescence of the lamellar body dye, lysotracker red (LTR). Negligible fluorescence loss indicates negligible surfactant secretion. Bars: mean ± SEM. n = 4 lungs for each bar. Groups were compared using one-way ANOVA with Bonferroni correction. n.s., not significant. d, e Group data are determinations of alveolar hyperinflation-induced mitochondrial Ca2+ (d) and surfactant secretion (e) responses in the indicated groups. We crossed the MCUF/F mice with mice bearing an inducible Cre recombinase under the control of an SPC promoter (SPC-Cre-ERT2). Post-partum Cre activation by tamoxifen (i.p.) caused AT2 MCU deletion in these mice. ERT2MCU−/, tamoxifen treated; ERT2Creinactv, tamoxifen untreated. Bars: mean ± SEM. n = 4 lungs for each bar, p-values are for two-tailed Student’s t-test.
Fig. 2
Fig. 2. LPS effects on AT2 mitochondria.
a Group data show quantifications of hyperinflation-induced surfactant secretion for the indicated groups. LPS was given at nonlethal dose (1 mg/kg, Supplementary Table 3). Bars: mean ± SEM. n = 4 lungs each bar. Groups were compared using one-way ANOVA with Bonferroni correction. n.s., not significant. b Tracings from a single experiment and group data show hyperinflation (arrow) -induced AT2 mitochondrial responses following the indicated intranasal instillations. LPS was given at nonlethal dose (1 mg/kg, Supplementary Table 3). LPS-24, 24 h after intranasal LPS. Repeated in 4 independent experiments per group. c Immunoblots are shown for mitochondrial calcium uniporter (MCU) in AT2 mitochondria derived 24 h after indicated treatments. LPS was instilled at a nonlethal dose in Swiss Webster mice. VDAC, voltage dependent anion channel. Tracings show densitometry quantification of MCU/VDAC ratio. Replicated 4 times. *p = 0.004 and ‡p = 3.4e−06 versus corresponding PBS. p-values are for two-tailed Student’s t-test. d Data are quantifications of the MCU RNA in freshly isolated AT2 from mice given the indicated intranasal instillations. Lungs were excised and mRNA extracted at indicated time points after instillations of nonlethal LPS. RNA values were normalized against actin. Bars: mean ± SEM. n = 4 lungs for each bar, p-value is calculated by two-tailed Student’s t-test. e Group data show Ca2+ responses of AT2 mitochondria in live alveoli to a 10-second channelrhodopsin (ChR2) activation. ChR2-GFP plasmid was given by intranasal instillation in liposomal complexes. Lungs were excised 48 h after instillation. ChR2+ and ChR2- are respectively, data for AT2 that were positive or negative for GFP fluorescence in the same lung. Bars: mean ± SEM. n = 4 lungs per group. Groups were compared using one-way ANOVA with Bonferroni correction. f MCU immunoblots in AT2 mitochondria and densitometric quantification of MCU/VDAC ratio after intranasal instillations of nonlethal (LPS-Nonlethal, 1 mg/kg, left) and lethal (LPS-Lethal, 10 mg/kg, right) LPS in Swiss Webster mice. PBS was instilled on Day 0. Supplementary Table 3 gives details of LPS doses. Data are mean ± SEM. n = 3 mice for each time point. p-values for within group comparisons for Day 0 (a) versus the corresponding time points (b-j) are respectively, 1.1e−05, 2.6e−05, 5.6e−06, 0.02, 0.04, 1.08e−05, 1e−05, 8.3e−06 and 1.2e−05. The p-values for between group comparisons, namely h versus c, i versus d, j versus e, are respectively, 0.005, 3.3e−05 and 0.003. Groups were compared using one-way ANOVA with Bonferroni correction. g Group data show changes in body weight at indicated time points following intranasal PBS (black), nonlethal (LPS-Nonlethal, red) and lethal (LPS-Lethal, blue) LPS instillations in Swiss Webster mice. Data are mean ± SEM. n = 4 mice for each time point. p-values for within group comparisons for Day 0 (a) versus the corresponding time points (bj) are respectively, 9.1e−15, 3.2e−17, 8.7e−07, 5.6e−11, 7.8e−06, 1.2e-22, 3.8e−19, 1.6e−16, and 8.6e−16. The p-values for between group comparisons, namely h versus c, i versus d, j versus e, are respectively, 7.7e−05, 6e−06, and 1.1e−08. Groups were compared using one-way ANOVA with Bonferroni correction. h Group data are determinations of neutrophil counts in bronchoalveolar lavage 24 h after intranasal P. aeruginosa instillations. The low and high inoculum concentrations were 1 × 105 and 1 × 106 colony-forming units (CFU), respectively. Bars: mean ± SEM. n = 4 mice per group. Groups were compared using one-way ANOVA with Bonferroni correction. i Immunoblots are shown for the MCU in AT2 mitochondria derived 24 h after indicated instillations. Group data show densitometry quantification of MCU/VDAC ratio. Bars: mean ± SEM. n = 4 mice per group. Groups were compared using one-way ANOVA with Bonferroni correction.
Fig. 3
Fig. 3. Effects of wild-type MCU overexpression in alveolar epithelium.
a Immunoblots are for MCU in AT2 mitochondrial fractions derived from indicated strains. We crossed the MCUF/F mice with mice bearing an inducible Cre recombinase under the control of an SPC promoter (SPC-Cre-ERT2). Post-partum Cre activation by tamoxifen (i.p.) caused AT2 MCU deletion in these mice. MCUF/F, MCU floxed; ERT2MCU/, tamoxifen-treated; ERT2Creinactv, tamoxifen untreated. To addback MCU in ERT2MCU/ mice (ERT2MCU/ + MCUadd), we i.n. instilled plasmid encoding for the wild-type MCU (pMCUwt) in liposomal complex. Lungs were excised 48 h after plasmid instillation. Group data show densitometry quantification of MCU/VDAC ratio. Bars: mean ± SEM. n = 4 mice per group. Groups were compared using one-way ANOVA with Bonferroni correction. b Survival plots in mice exposed to a moderate LPS dose (30 mg/kg). Surf, surfactant (Curosurf, 2 ml/kg body weight) intranasally instilled 1 h prior to LPS in ERT2MCU/ mice; MCUadd, MCU addback 24 h prior to LPS in ERT2MCU/ mice. N = 13 mice in the ERT2MCU/ group and 11 in the other groups. *p = 0.017, ‡p = 0.006, and †p = 0.014 versus ERT2MCU/. p-values are calculated by Log-Rank test. c Immunoblots and densitometric quantifications of AT2 mitochondria from lungs given the indicated intranasal instillations. Liposome-complexed pMCUwt plasmid was given by intranasal instillation. Instillation sequences were: PBS followed 8 h later by pMCUwt for the control group, and pMCUwt followed 24 h later by instillation of nonlethal LPS (1 mg/kg) for the treated group. Lungs were removed for analyses 48 h after the first instillations. Bars: mean ± SEM. n = 3 lungs for each bar, p-value is for two-tailed Student’s t-test. df Responses shown are for Ca2+ (d), lung ATP (e) and surfactant secretion (f) obtained 24 h after intranasal instillations of PBS or nonlethal LPS (1 mg/kg) in wild-type or in pMCUwt expressing mice. pMCUwt-complexed liposomes were intranasally instilled 24 h before instillations of LPS. In d, group data are AT2 Ca2+ responses to hyperinflation. In e, lung ATP was determined by a colorimetric method. In f, surfactant secretion was quantified in terms of loss of AT2 fluorescence of lysotracker red (LTR). Bars: mean ± SEM. n = 4 lungs for each bar. Groups were compared using one-way ANOVA with Bonferroni correction. n.s., not significant. g Survival plots are for Swiss Webster mice following instillations of LPS (10 mg/kg) followed 24 h later with PBS (LPS) or pMCUwt followed 24 h later with LPS (pMCUwt). n = 10 mice in each group, *p = 0.031 versus LPS. p-value is calculated by Log-Rank test. h Immunoblots and densitometric quantifications of AT2 cytosol (upper) and mitochondria (lower) from lungs given the indicated intranasal instillations. Liposome-complexed pMCUwt plasmid was given by intranasal instillation 12 h after instillations of PBS or nonlethal LPS (1 mg/kg). Lungs were removed for analyses 48 h after the first instillations. Bars: mean ± SEM. n = 3 lungs for each bar, p-values are for two-tailed Student’s t-test. i, j Group data are determination of extravascular lung water (i) and BAL protein (j) after i.n. instillation of PBS or LPS (30 mg/kg) in ERT2creinactv and the ERT2MCU/ mice. In i, pre-treatments were: ERT2MCU/ mice given i.n. surfactant (2 ml/kg body weight) or pMCUwt plasmid, 1 and 24 h before LPS, respectively. Quantifications were made 72 h after PBS or LPS instillations. In j, protein determination in BAL were made 72 h after PBS or LPS instillations. Bars: mean ± SEM. n = 5 lungs for each bar. Groups were compared using one-way ANOVA with Bonferroni correction. n.s., not significant.
Fig. 4
Fig. 4. BMSC expression of pMCUwt protects against LPS injury.
a MCU immunoblots in AT2 mitochondria derived from mice given indicated intranasal instillations. BMSCs expressing the wild-type MCU plasmid (BM-MCUwt) were intranasally instilled 4 h after nonlethal LPS instillations. Lungs were excised and AT2 isolated 24 h after LPS (1 mg/kg) instillations. Bars show densitometry. Bars: mean ± SEM. n = 3 lungs for each group. Groups were compared using one-way ANOVA with Bonferroni correction. n.s., not significant. b, c Group data are for AT2 cytosolic (cCa2+) and mitochondrial (mCa2+) calcium (b) and surfactant secretion (c, loss of LTR fluorescence) responses following hyperinflation. Sequence of intranasal instillations is indicated. All determinations were carried out 24 h after the first instillation. BM-MCUmt, BMSCs expressing a mutant MCU. Bars: mean ± SEM. n = 4 lungs each bar. Groups were compared using one-way ANOVA with Bonferroni correction. n.s., not significant. In c, p-values are for two-tailed Student’s t-test, n.s., not significant. d Bars quantify the alveolar inflammatory response to indicated instillations as quantified by neutrophil counts in the bronchioalveolar lavage (BAL) obtained 24 h after the first instillation. Bars: mean ± SEM. n = 4 lungs each bar. Groups were compared using one-way ANOVA with Bonferroni correction. n.s., not significant. e Mouse survival after instillations of lethal LPS (10 mg/kg) in Swiss Webster mice. The groups are: LPS alone (red), LPS followed 4 h later with instillation of BM-MCUwt (green) or BM-MCUmt (black). N = 10 each group, *p = 0.038 versus LPS by Log-Rank test.
Fig. 5
Fig. 5. Inhibition of mitochondrial H2O2 abrogates AT2 MCU depletion.
a, b Group data are for baseline AT2 mitochondrial H2O2 production following nonlethal LPS (1 mg/kg) instillations. mCATF/F, mice floxed for mitochondrial catalase (mCAT): AT2CAT+/+, mice expressing mCAT in AT2. In b, determinations were made 24 h after indicated instillations. LPS was instilled at a nonlethal dose (1 mg/kg). Bars: mean ± SEM. n = 4 lungs for each group. Groups were compared using one-way ANOVA with Bonferroni correction. c MCU immunoblots and densitometry of AT2 mitochondria from lungs given intranasal PBS or nonlethal LPS (1 mg/kg). Lungs were excised and AT2 isolated 24 h after instillations. Bars: mean ± SEM. n = 3 lungs for each group. Groups were compared using one-way ANOVA with Bonferroni correction. d–f Group data show in situ determinations of AT2 cytosolic (cCa2+) and mitochondrial (mCa2+) calcium (d), surfactant secretion (e) and lung inflammation (f). All determinations were made 24 h after intranasal instillations. LPS was instilled at a nonlethal dose (1 mg/kg). Bars: mean ± SEM. n = 4 lungs each bar. Groups were compared using one-way ANOVA with Bonferroni correction. n.s., not significant. g Kaplan-Meier plots are for mouse survival after instillations of ALI-inducing lethal LPS (50 mg/kg). n = 10 mice in each group, *p = 0.027 versus mCATF/F. p-value is calculated by Log-Rank test.
Fig. 6
Fig. 6. LPS causes mitochondrial fragmentation.
a, b In mice expressing mitochondria-targeted dendra-2, we detected AT2 in terms of the lamellar body (LB) localizing dye, LTR. In the PBS-treated lung (alveoli marked by dotted lines), an AT2 is selected in the low magnification image (rectangle). Images i-iii show the AT2 at high magnification, displaying polarized mitochondrial aggregation. LBs co-mingle with mitochondria at the indicated site (arrow). Images v and vii display the channel for mitochondrial fluorescence in AT2 in a lung given intranasal instillation of nonlethal LPS (1 mg/kg, 24 h), and a lung that was given Mdivi-1 prior to the LPS treatment. Images iv, vi, and viii show distribution of mitochondrial fluorescence along the depth axes (y-z). Mitochondrial density was quantified in the depth axis at sites of highest mitochondrial aggregation along the selected lines (dashed lines). Scale bar, 5 µm. Bars: mean ± SEM. n = 20 cells from 4 lungs each bar. Groups were compared using one-way ANOVA with Bonferroni correction. c, d, Phosphorylated Ser616-Drp1 (c) and Drp1 (d) immunoblots and densitometry are for freshly isolated AT2 mitochondria following indicated treatments. LPS was instilled at a nonlethal dose (1 mg/kg). Drp1, dynamin-related protein 1; pSer616, phosphorylated serine 616. Bars: mean ± SEM. n = 4 and 3 lungs each bar respectively, in c and d. In c, p-values are for two-tailed Student’s t-test. In d, groups were compared using one-way ANOVA with Bonferroni correction.
Fig. 7
Fig. 7. LPS causes H2O2-induced Drp1 activation.
a MCU Immunoblots and densitometry are shown for AT2 mitochondria derived from lungs of mice given the indicated treatments. LPS was instilled at a nonlethal dose (1 mg/kg). Drp1F/F, floxed mice for Drp1; AT2Drp1/, mice lacking Drp1 in AT2. Lungs were excised and AT2 isolated 24 h after intranasal instillations. Bars: mean ± SEM. n = 3 lungs for each bar. Groups were compared using one-way ANOVA with Bonferroni correction. b MCU immunoblots in AT2 mitochondria derived from mice expressing an empty vector or a kinase-dead Drp1 (K38A). All animals were given intranasal LPS at a nonlethal dose and lungs excised 24 h after instillation. n = 3 lungs for each group. c, d, Group data show respectively, surfactant secretion (c) and mitochondrial H2O2 (d) following indicated treatments. All determinations were made 24 h after instillations. Bars: mean ± SEM. n = 4 lungs for each bar. Groups were compared using one-way ANOVA with Bonferroni correction.
Fig. 8
Fig. 8. Mechanisms of mitochondrial H2O2 generation.
a Immunoblots in AT2 mitochondria (left) and densitometric quantification of immunoblots (right) show MCU expression 24 h after indicated treatments. LPS was instilled at a nonlethal dose (1 mg/kg). Cx43, connexin 43; Cx43F/F, mice floxed for Cx43; AT2Cx43/, mice lacking Cx43 in AT2. Bars: mean ± SEM. n = 3 lungs each bar. Groups were compared using one-way ANOVA with Bonferroni correction. b Determinations of mitochondrial Ca2+ responses to hyperinflation 24 h after indicated intranasal instillations. LPS was instilled at a nonlethal dose. Bars: mean ± SEM. n = 4 lungs each bar. Groups were compared using one-way ANOVA with Bonferroni correction. c Immunoblot (left), and densitometric determinations (right) from AT2 mitochondria. AT2 were isolated 24 h after instillations of either PBS or nonlethal LPS. ECSIT, evolutionarily conserved signaling intermediate in Toll pathway; ECSIT+/, heterozygous knockout mice for ECSIT. Bars: mean ± SEM. n = 3 lungs each bar. Groups were compared using one-way ANOVA with Bonferroni correction.

Update of

Similar articles

Cited by

References

    1. Bellani G, et al. Epidemiology, patterns of care, and mortality for patients with acute respiratory distress syndrome in intensive care units in 50 countries. JAMA. 2016;315:788–800. doi: 10.1001/jama.2016.0291. - DOI - PubMed
    1. Wu, Y., Nguyen, T. L. & Perlman, C. E. Intravenous sulforhodamine B reduces alveolar surface tension, improves oxygenation and reduces ventilation injury in a respiratory distress model. J. Appl. Physiol. (1985), 10.1152/japplphysiol.00421.2020 (2020). - PMC - PubMed
    1. Mora R, Arold S, Marzan Y, Suki B, Ingenito EP. Determinants of surfactant function in acute lung injury and early recovery. Am. J. Physiol. Lung Cell Mol. Physiol. 2000;279:L342–L349. doi: 10.1152/ajplung.2000.279.2.L342. - DOI - PubMed
    1. Hough RF, et al. Endothelial mitochondria determine rapid barrier failure in chemical lung injury. JCI Insight. 2019;4:e124329. doi: 10.1172/jci.insight.124329. - DOI - PMC - PubMed
    1. Hajnoczky G, Robb-Gaspers LD, Seitz MB, Thomas AP. Decoding of cytosolic calcium oscillations in the mitochondria. Cell. 1995;82:415–424. doi: 10.1016/0092-8674(95)90430-1. - DOI - PubMed

Publication types