. 2022 Oct 3;12(1):16543.
doi: 10.1038/s41598-022-20979-x.

Modelling brain dynamics by Boolean networks

Affiliations

Modelling brain dynamics by Boolean networks

Francesca Bertacchini et al. Sci Rep. .

Abstract

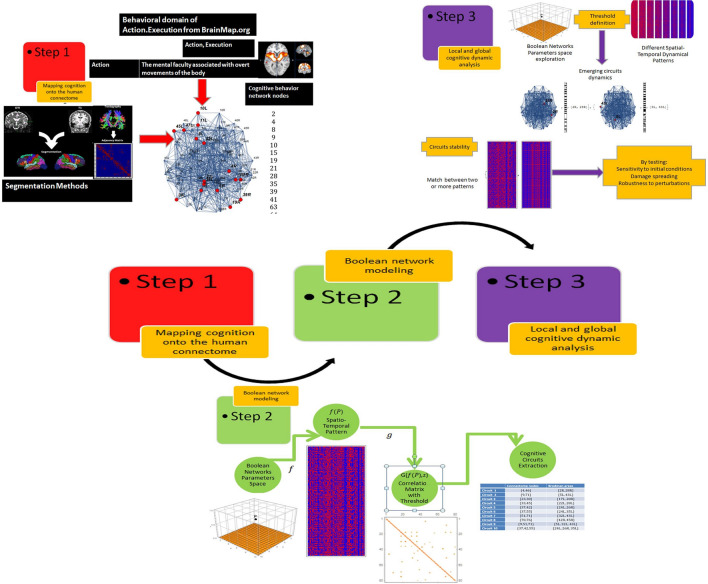
Understanding the relationship between brain architecture and brain function is a central issue in neuroscience. We modeled realistic spatio-temporal patterns of brain activity on a human connectome with a Boolean networks model with the aim of computationally replicating certain cognitive functions as they emerge from the standardization of many fMRI studies, identified as patterns of human brain activity. Results from the analysis of simulation data, carried out for different parameters and initial conditions identified many possible paths in the space of parameters of these network models, with normal (ordered asymptotically constant patterns), chaotic (oscillating or disordered) but also highly organized configurations, with countless spatial-temporal patterns. We interpreted these results as routes to chaos, permanence of the systems in regimes of complexity, and ordered stationary behavior, associating these dynamics to cognitive processes. The most important result of this work is the study of emergent neural circuits, i.e., configurations of areas that synchronize over time, both locally and globally, determining the emergence of computational analogues of cognitive processes, which may or may not be similar to the functioning of biological brain. Furthermore, results put in evidence the creation of how the brain creates structures of remote communication. These structures have hierarchical organization, where each level allows for the emergence of brain organizations which behave at the next superior level. Taken together these results allow the interplay of dynamical and topological roots of the multifaceted brain dynamics to be understood.


Conflict of interest statement

The authors declare no competing interests.

Figures

Figure 1
Figure 1
The three-step pipeline that has been used foresees the mapping of cognition onto the human connectome, the Boolean Network modeling, the circuits identification and the cognitive networks dynamical analysis at the local and the global level.
Figure 2
Figure 2
Main brain activation points for Action–Execution, archived in the BrainMap.org database. The activation points confirmed by many experimental fMRI studies are 16.
Figure 3
Figure 3
The connectome modelled on the 82 Brodmann areas (a) and the network connection matrix (b). The parcelization method adopted is as in.
Figure 4
Figure 4
The image shows the 16 nodes of the network that produces the Action–Execution behavior.
Figure 5
Figure 5
The simulation of the BN between 400 and 500 steps of simulation for values of a ranging from 1 to 7 and values of b ranging from 1 to 13.
Figure 6
Figure 6
Multiple evolutions of the BN for 200 steps of simulation. This run was attained for parameter b, going from 1 to 8, and a fixed value of a=1. As can be seen, the patterns of the BN goes from chaos to order (from left to right), according to the increase of parameter b. The magnified pattern on the left is for b=4.
Figure 7
Figure 7
Correlation matrix among all the nodes that change over time (a) and with a threshold (b). In this case, the threshold level has been set to 0.87.
Figure 8
Figure 8
Representation of the emerged circuits in the brain connectome, setting the threshold parameter of connection among nodes at 0.87.
Figure 9
Figure 9
Intersection array and correlation matrix for representing relationships among the emerged circuits.
Figure 10
Figure 10
Spatio-temporal pattern of evolution of the BN system chosen as example after 250 simulation steps (a), together with the time-series of the evolution showing the periodic behavior of the system (b).
Figure 11
Figure 11
Representation of the Action–Execution circuit in the brain connectome made of 82 nodes, its connection matrix, the connection matrix of the emerging circuit and their connectome representation. (a) Circuits local evolution; (b) Connection matrix; (c) Connection matrix of the emerging circuits (d) Connectome representation of the emerging circuits.
Figure 12
Figure 12
Correlation matrices for all nodes (a) and for the emerging circuits (b).
Figure 13
Figure 13
The 10 circuits, obtained from the NB simulation taken as model, are compared to other circuits which could emerge from different simulation parameters.
Figure 14
Figure 14
Intersection array (a) and correlation matrix for different simulation parameters (b).
Figure 15
Figure 15
Intersection array (a) and correlation matrix for different simulation parameters (b).

Similar articles

Cited by

References

    1. Laird RA, Kent P, Keating JL. Modifying patterns of movement in people with low back pain-does it help? A systematic review. BMC Musculoskeletal. 2012;13(1):1–16. doi: 10.1186/1471-2474-13-169. - DOI - PMC - PubMed
    1. Jirsa, V. K. Handbook of Brain Connectivity, vol. 321 (ed. A. R. McIntosh) (Springer, 2013). ISBN: 978-3-540-71512-2.
    1. Sporns O. The non-random brain: Efficiency, economy, and complex dynamics. Front. Comput. Neurosc. 2011;5:5. doi: 10.3389/fncom.2011.00005. - DOI - PMC - PubMed
    1. Sporns O, Tononi G, Kötter R. The human connectome: A structural description of the human brain. PLoS Comput. Biol. 2005;1(4):e42. doi: 10.1371/journal.pcbi.0010042. - DOI - PMC - PubMed
    1. Vachha BA, Huang SY, Massoud TF. Advanced neuroimaging of brain metastases. Front. Neurol. 2021;12:310. doi: 10.3389/fneur.2021.668310. - DOI - PMC - PubMed