Review
. 2022 Nov;23(11):683-704.
doi: 10.1038/s41583-022-00634-0. Epub 2022 Oct 3.

Multiregion neuronal activity: the forest and the trees

Affiliations
Review

Multiregion neuronal activity: the forest and the trees

Timothy A Machado et al. Nat Rev Neurosci. 2022 Nov.

Abstract

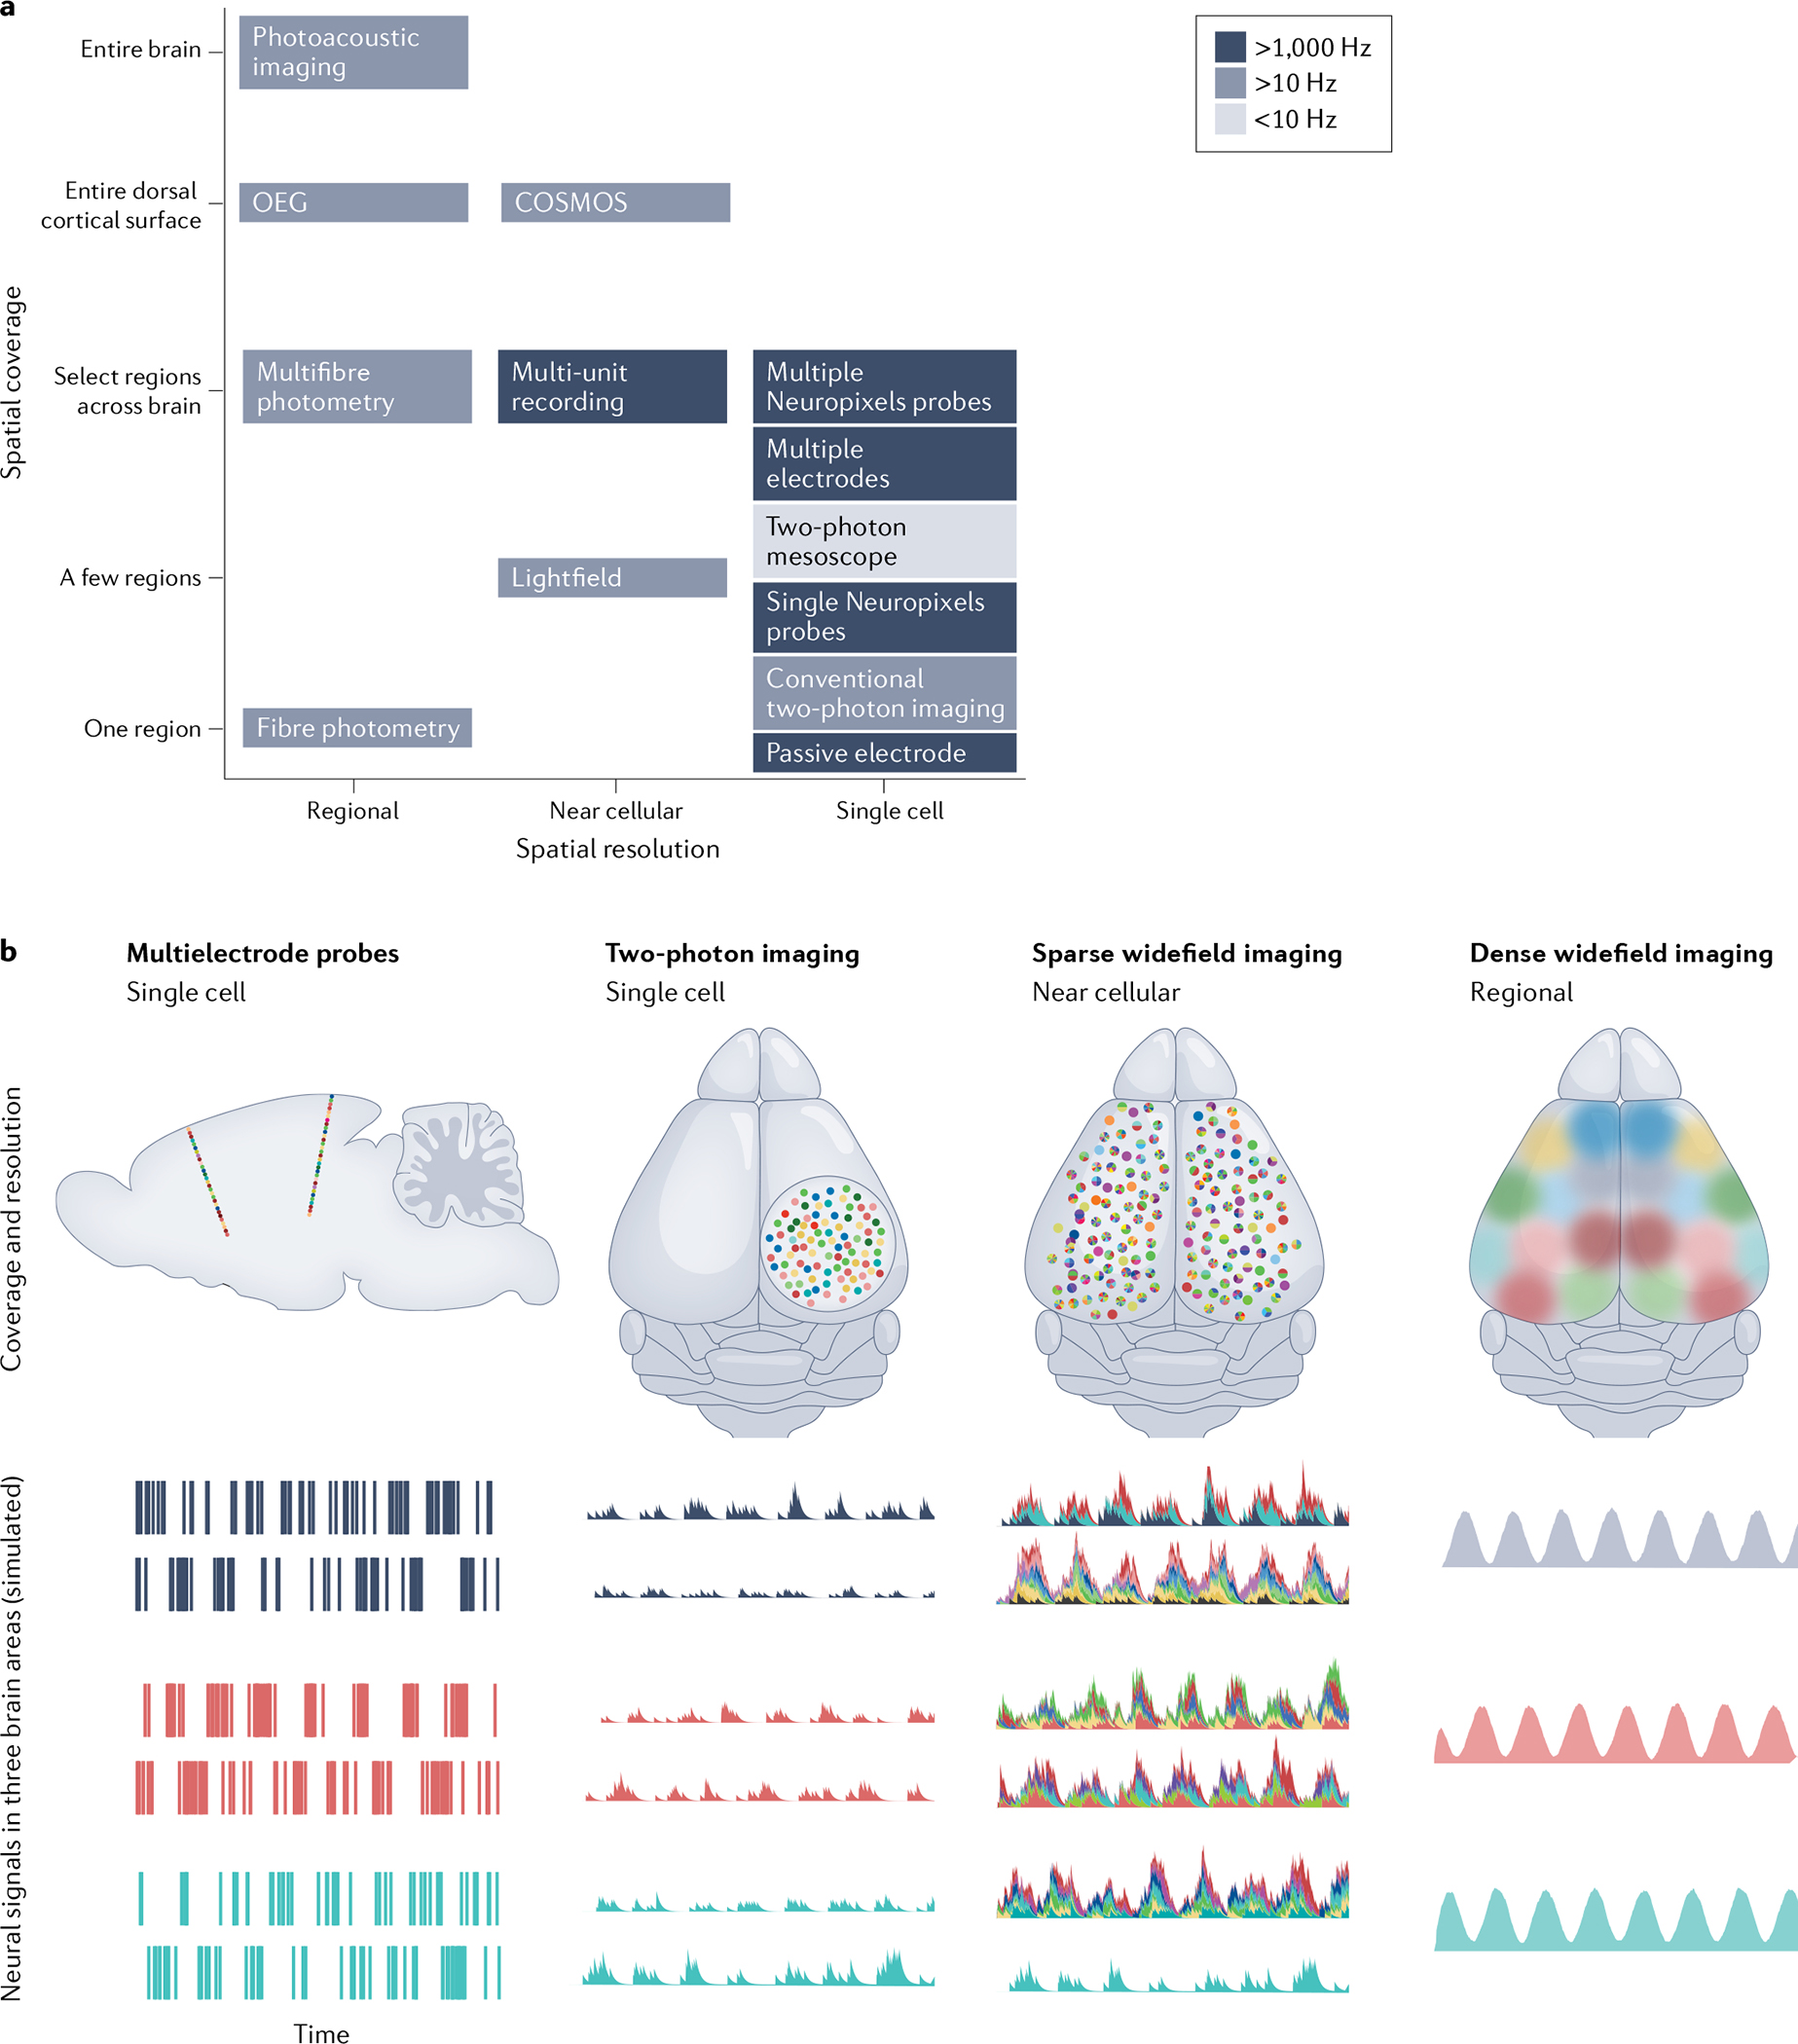
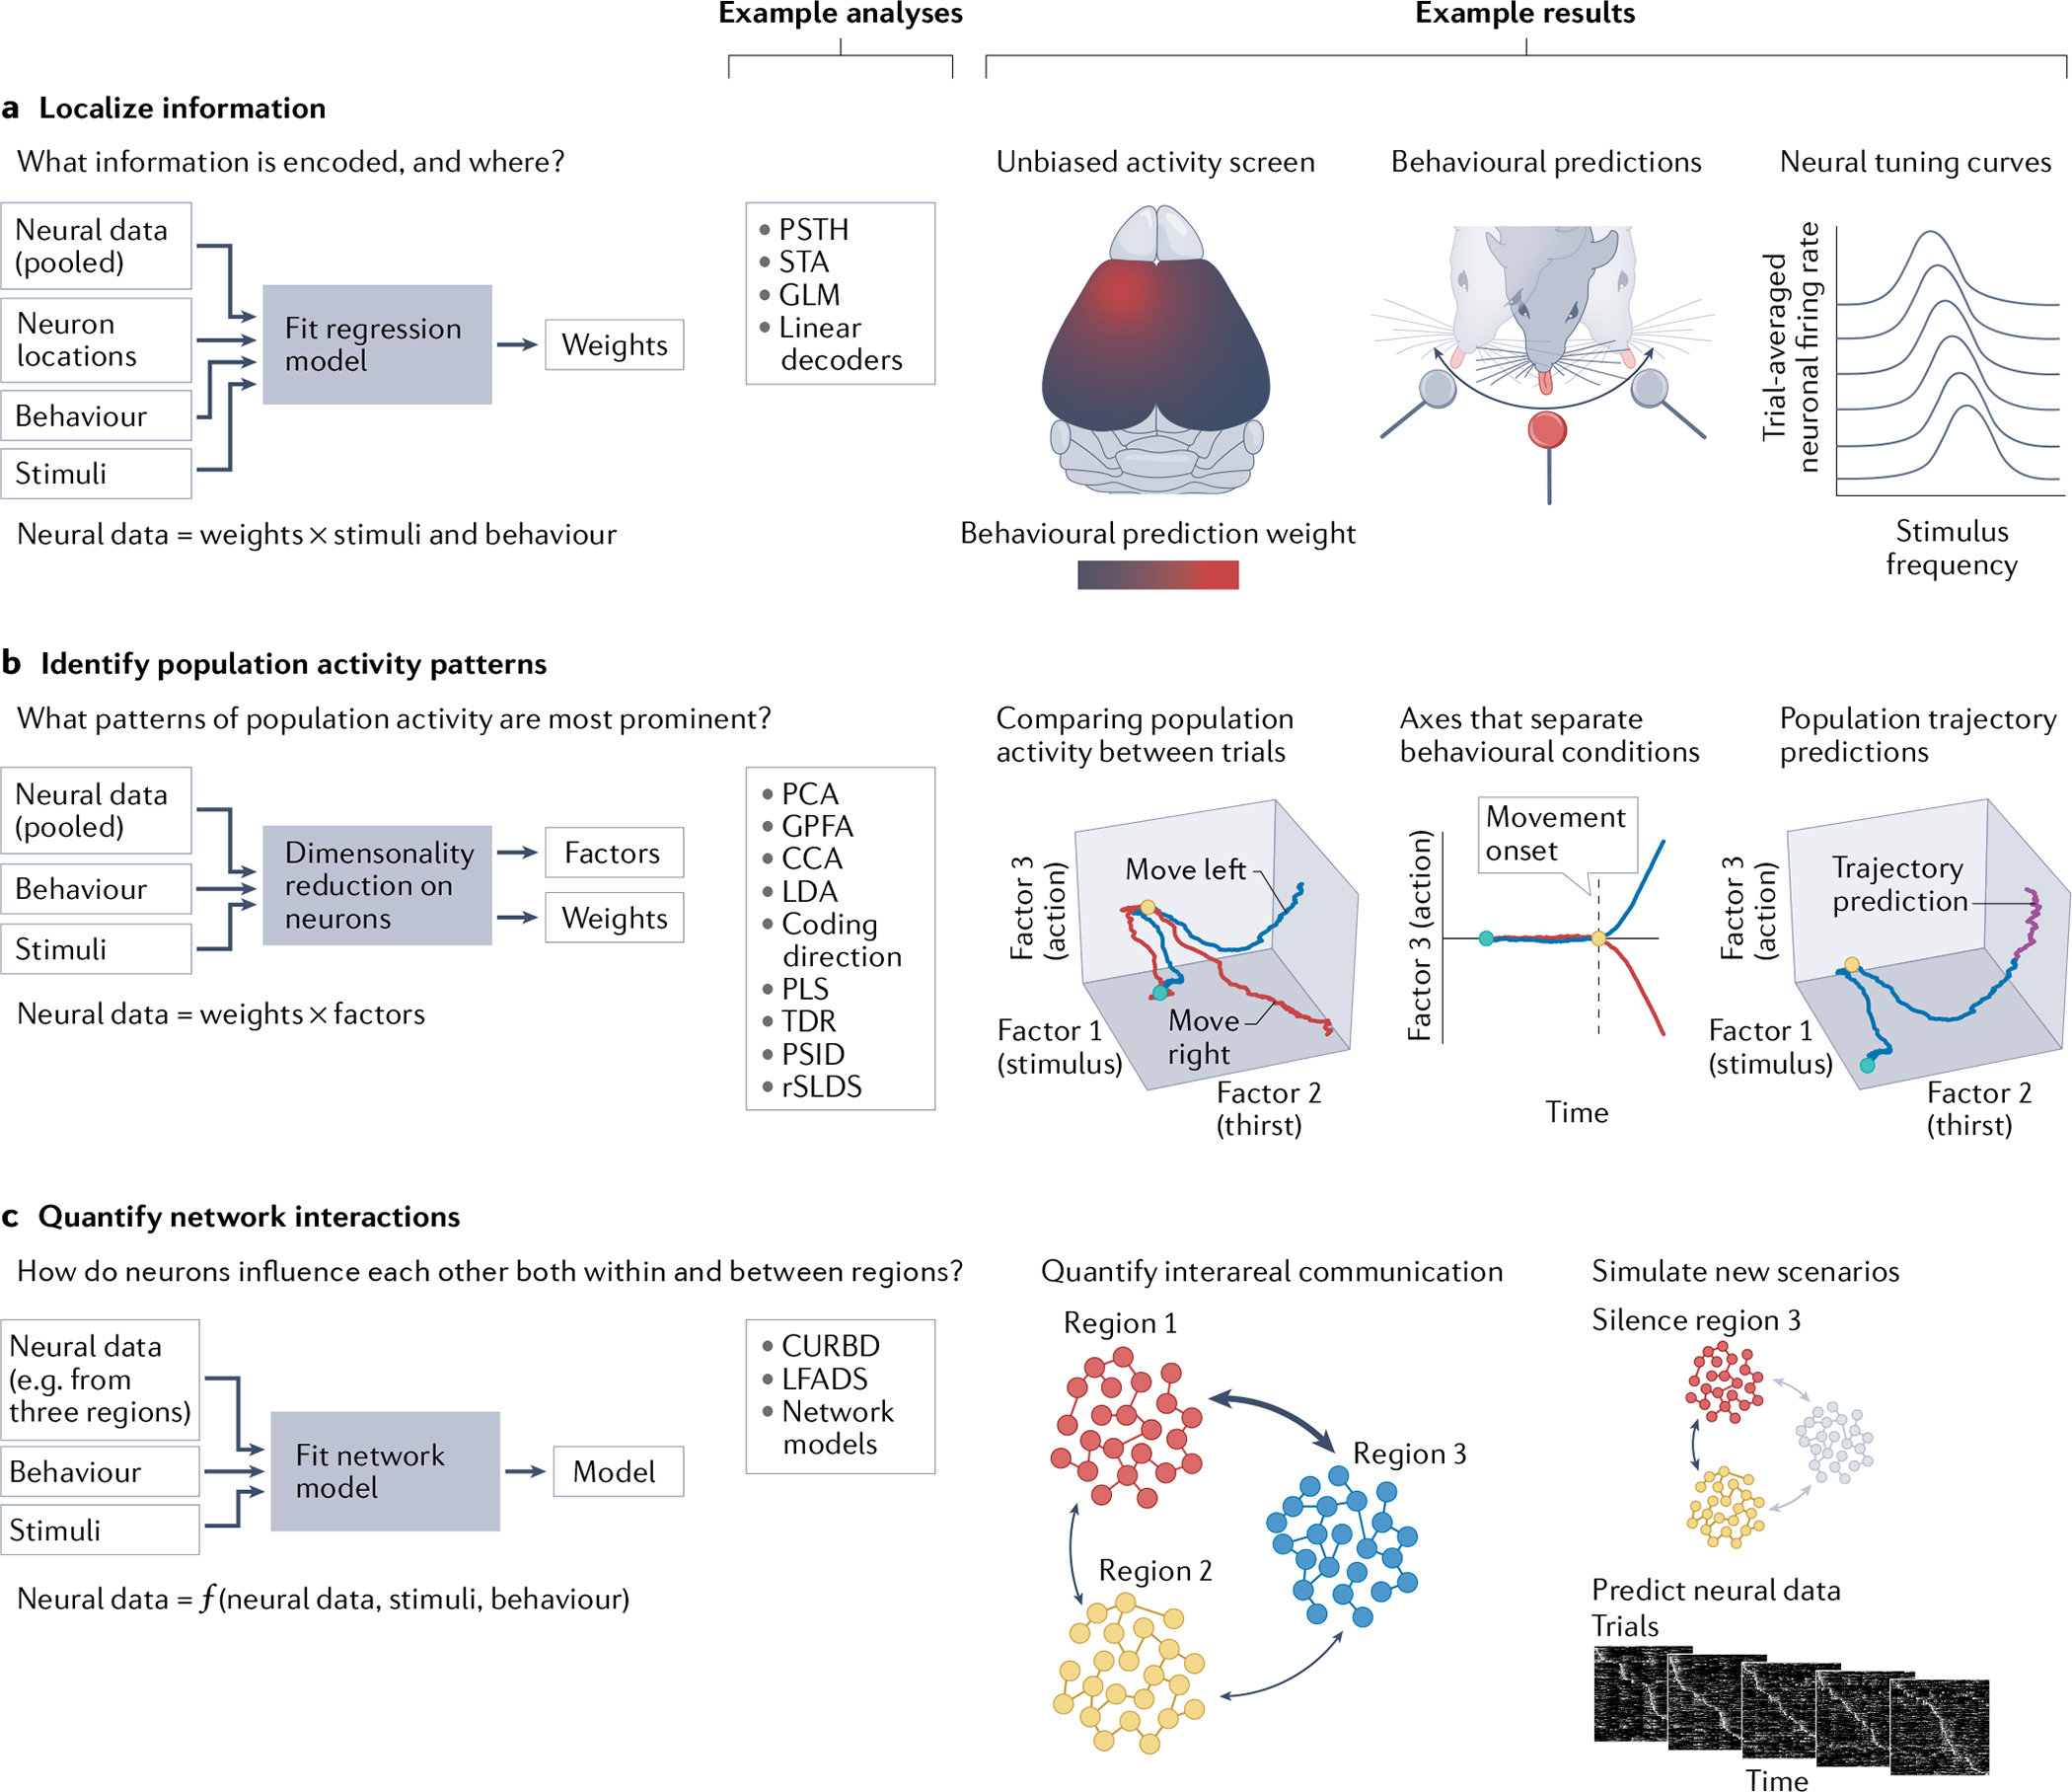
The past decade has witnessed remarkable advances in the simultaneous measurement of neuronal activity across many brain regions, enabling fundamentally new explorations of the brain-spanning cellular dynamics that underlie sensation, cognition and action. These recently developed multiregion recording techniques have provided many experimental opportunities, but thoughtful consideration of methodological trade-offs is necessary, especially regarding field of view, temporal acquisition rate and ability to guarantee cellular resolution. When applied in concert with modern optogenetic and computational tools, multiregion recording has already made possible fundamental biological discoveries - in part via the unprecedented ability to perform unbiased neural activity screens for principles of brain function, spanning dozens of brain areas and from local to global scales.


Conflict of interest statement

Competing interests

The authors declare no competing financial interests

Figures

Fig. 1 |
Fig. 1 |. A spectrum of methods for multiregion recording.
a | Each multiregion recording method exhibits a set of trade-offs among spatial resolution (x-axis; ranging from regional-scale resolution to single-cell resolution), spatial coverage of a simultaneous recording (y-axis; ranging from just one region to the entire brain) and acquisition speed shading. b | As a consequence of the trade-offs illustrated in part a, the spatial and temporal features of the data diverge between different methods. Synthetic data, simulated on the basis of the characteristics of each method, qualitatively illustrate the kinds of data that are produced by different multiregion recording methods — ranging from sparse sampling of neurons around an electrode array (left panel, top) with high-fidelity single-neuron recordings (left panel, bottom), to complete coverage of dorsal cortex (right panel, top) without full cellular resolution (right panel, bottom). Scales on the synthetic neural activity traces are arbitrary. COSMOS, cortical observation by synchronous multifocal optical sampling; OEG, optoencephalography.
Fig. 2 |
Fig. 2 |. Approaches for analysing multiregion recording data.
There are many approaches for analysing and interpreting multiregion neural data, each of which can address different types of questions. a | What information is being represented by neurons in a dataset? Questions of this nature can be studied using regression models that try to model neural data as a weighted sum of other variables, including information about animal behaviour, experimental stimuli, information about neuronal identity and position, and signals from other neurons. In the unbiased activity screen example (left), the weights obtained from a model might represent the brain areas that are most useful for predicting information about an animal’s behaviour during a task. In other cases (middle), the product of another set of regression weights and neural data may be used to make behavioural predictions (for example, to predict which waterspout the animal might lick to obtain a reward) or compute a neural tuning curve to show the average response of a neuron to a stimulus (right). The algorithm used to compute these weights is often some form of linear regression, such as a generalized linear model (GLM), and may rely on spike-triggered averaging (STA) to reveal the stimulus that a neuron maximally responds to or may rely on computing a trial-averaged response (often called a ‘peristimulus time histogram’ (PSTH)) to reveal the neural response to a specific stimulus. b | What is the regularity and prominence of different patterns of neural population activity? To study this question, dimensionality reduction techniques can be used to compress the activity of hundreds of neurons into a few prominent factors that can then be used to represent the joint activity of a neural population as a low-dimensional trajectory. These algorithms typically attempt to approximate a data matrix of neurons over time (N × T) as the product of a matrix of neuron weights over factors (N × D) and a matrix of factors over time (D × T), where the number of factors (D) is typically set to be some number less than N (often 2–5). This can be accomplished (in use of many algorithms) with different constraints on the features that must be present in the weights and factors (which are sometimes formulated in slightly different ways and may also incorporate information about behaviour, stimuli and how neural signals evolve over time). These methods, which are described in the main text, include principal component analysis (PCA), Gaussian process factor analysis (GPFA), canonical correlation analysis (CCA), linear discriminant analysis (LDA), coding direction analyses, partial least squares regression (PLS), targeted dimensionality reduction (TDR), preferential subspace identification (PSID) and recurrent switching linear dynamical systems (rSLDS). Projecting the neural data into a low-dimensional space defined by factors can be used to construct neural trajectories that can be visualized, quantified and used to compare the joint activity of a neural population across different trials and behavioural conditions (the green dot represents trial onset, the yellow dot represents movement onset and the red and blue lines represent schematic trial-averaged population activity as a mouse prepares to move right or left, respectively; left panel). Specific factors may be constructed to maximally separate population activity trajectories during different behavioural conditions (middle; format matches left panel). Many of these models can also be used to predict how a neural population trajectory might evolve in the future — in the absence of additional neural data (rightmost panel; general form of trajectory matches left panel). c | How do neurons interact with each other both within and between different brain areas? This can be studied by using algorithms such as latent factor analysis via dynamical systems (LFADS) and current-based decomposition (CURBD) to fit network models to datasets consisting of multiregion neural data, information about animal behaviour and sensory stimuli. The fitted network models can then be used to simulate how neural data might be generated by novel sets of stimuli or to generate unique behavioural outputs. Unlike with a real neural dataset, no element of these models is unobservable. Therefore, direct analysis of these models as a surrogate for the neural data of interest can be used, for example, to quantify the direction and strength of interareal communication between distinct brain regions (left). Communication strengths are indicated by the widths of the arrows between the areas. Use of these models also permits simulation of new experimental scenarios (for example, the behavioural and network-wide effects of silencing a set of neurons; right).
Fig. 3 |
Fig. 3 |. New perspectives arising from multiregion recording.
a | Example insights thus far into brainwide activity. Widespread nature of state and stimulus representations, here shown as widespread encoding of different actions (left; as in). Context dependence of interregional dynamics, here shown as different patterns of regional dynamics depending on the behavioural strategy (such as an active or a passive detection strategy, as in; middle). Roles of synchrony, here shown as desynchronized rhythmic activity between the retrosplenial cortex (red oscillations) that are decoupled from activity in other cortical regions (blue oscillations) that was observed to be elicited by ketamine, a dissociative drug (as in; right). b | An unbiased activity screen using optoencephalography widefield imaging reveals a ketamine-elicited (50 mg kg−1) rhythm localized to one cortical region, yielding desynchrony between the retrosplenial cortex and other cortical regions. Ketamine’s effect is an important example of the value of multiregion imaging since the uniqueness of the effect seen in the retrosplenial cortex would not have been otherwise appreciated, and also could not have been predicted. This effect is evident in the top row as a sinusoidal pattern of activity in the retrosplenial cortex after infusion (red trace) that is not correlated with the post-infusion activity of other regions. In the bottom row, this is exhibited as a peak at 1 Hz in the spectral power of the activity after infusion (red trace). dF/F is the baseline-corrected change in fluorescence, blue traces are for before ketamine infusion and red traces are for 10 min after ketamine infusion. c | Recordings with multiple Neuropixels silicon-based probe electrodes further reveal ketamine-elicited correlation between the retrosplenial cortex (RSP) and the laterodorsal thalamus (LD), and inverse correlation between the retrosplenial cortex and the anteromedial thalamus (AM). The inset illustrates a Neuropixels silicon-based probe (version 1.0) with a dense arrangement of electrodes that enables recording from many individual neurons across multiple regions of the brain (indicated by colours that correspond to the data shown on the right). See REF for further information on recording and analysis details. PSD, power spectral density. Panel b reprinted from REF. , Springer Nature Limited. Panel c adapted from REF. and REF. , Springer Nature Limited.

References

    1. The Event Horizon Telescope Collaboration. et al. First M87 event horizon telescope results. I. The shadow of the supermassive black hole. Astrophys. J. Lett. 875, L1 (2019).
    1. Galilei G Sidereus Nuncius (Univ. Chicago Press, 1610).
    1. Adrian ED The Basis of Sensation (WW Norton & Co, 1928).
    1. Brock LG, Coombs JS & Eccles JC The recording of potentials from motoneurones with an intracellular electrode. J. Physiol. 117, 431–460 (1952). - PMC - PubMed
    1. Woodbury JW & Patton HD in Cold Spring Harbor Symposia on Quantitative Biology vol. 17, 185–188 (Cold Spring Harbor Laboratory Press, 1952). - PubMed

Publication types