. 2022 Oct;4(10):1306-1321.
doi: 10.1038/s42255-022-00642-5. Epub 2022 Oct 3.

HK1 from hepatic stellate cell-derived extracellular vesicles promotes progression of hepatocellular carcinoma

Affiliations

HK1 from hepatic stellate cell-derived extracellular vesicles promotes progression of hepatocellular carcinoma

Qi-Tao Chen et al. Nat Metab. 2022 Oct.

Abstract

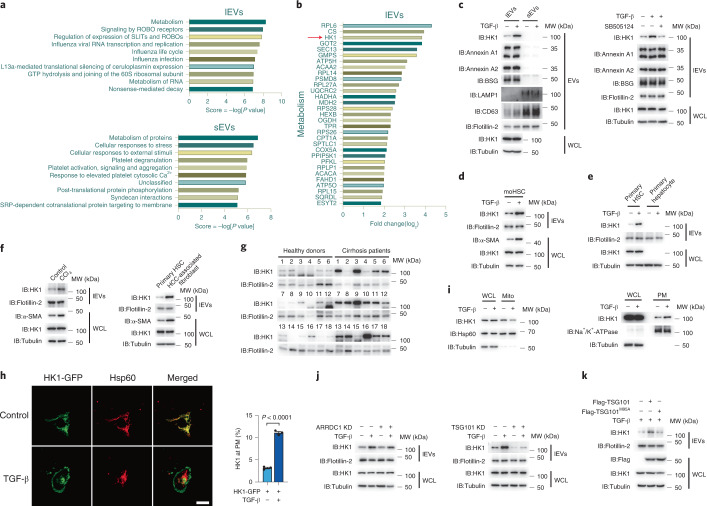
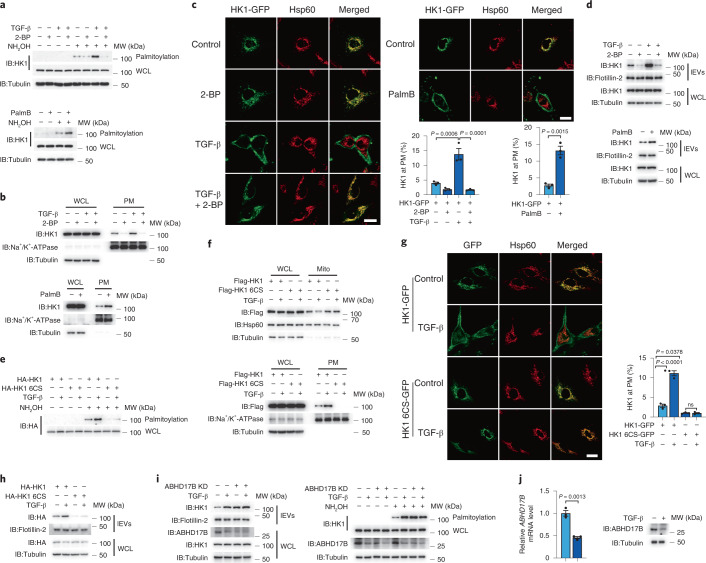
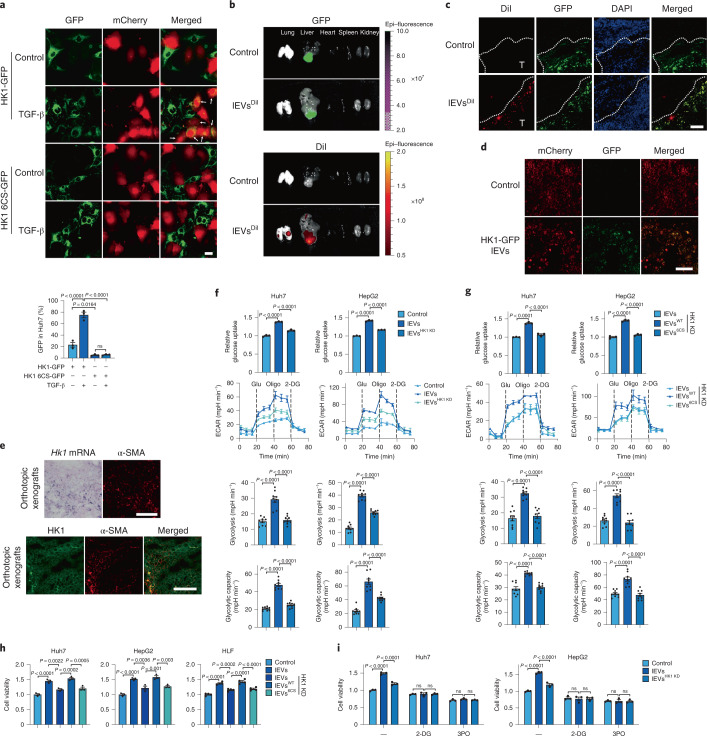
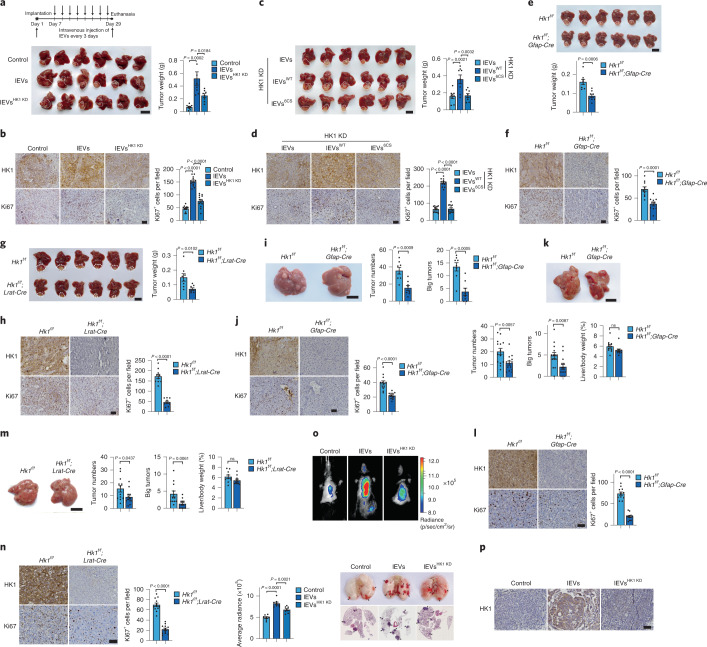
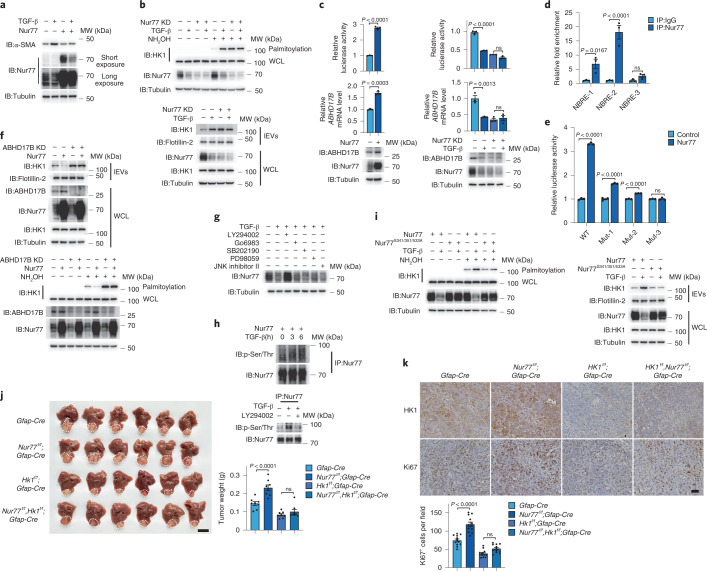
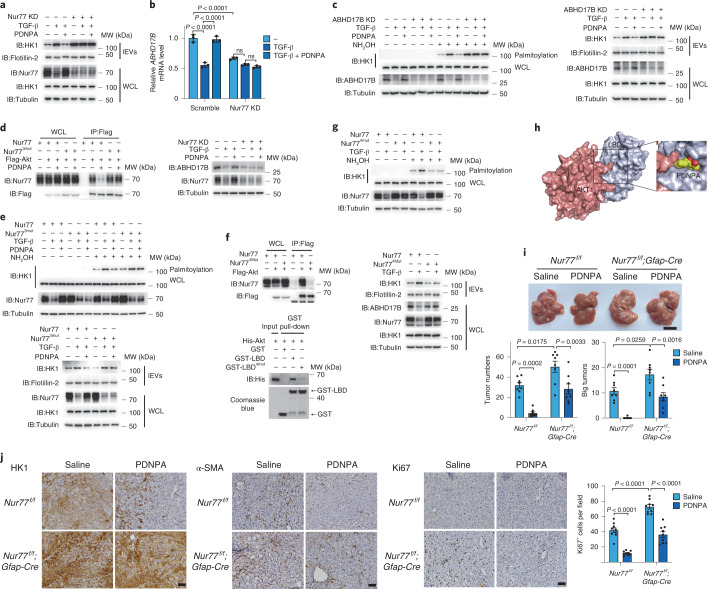
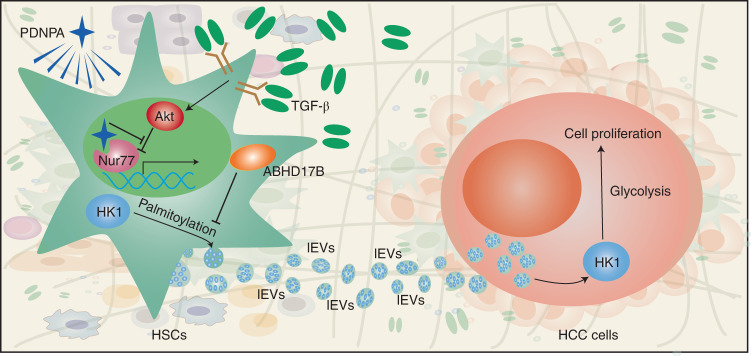
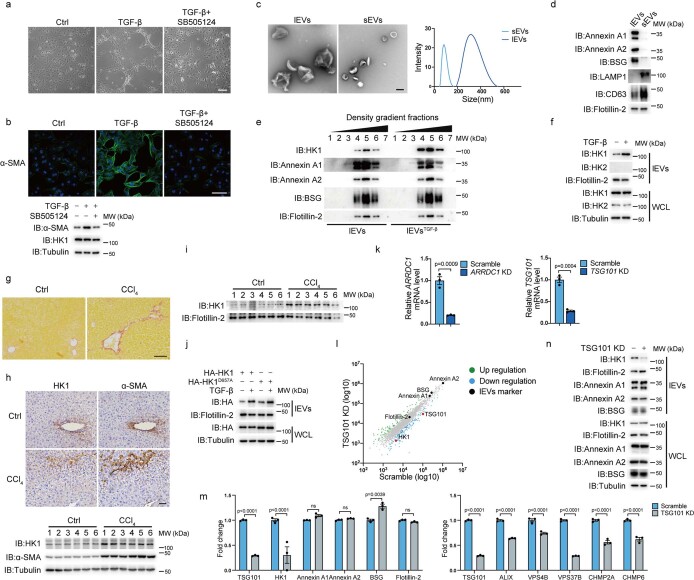
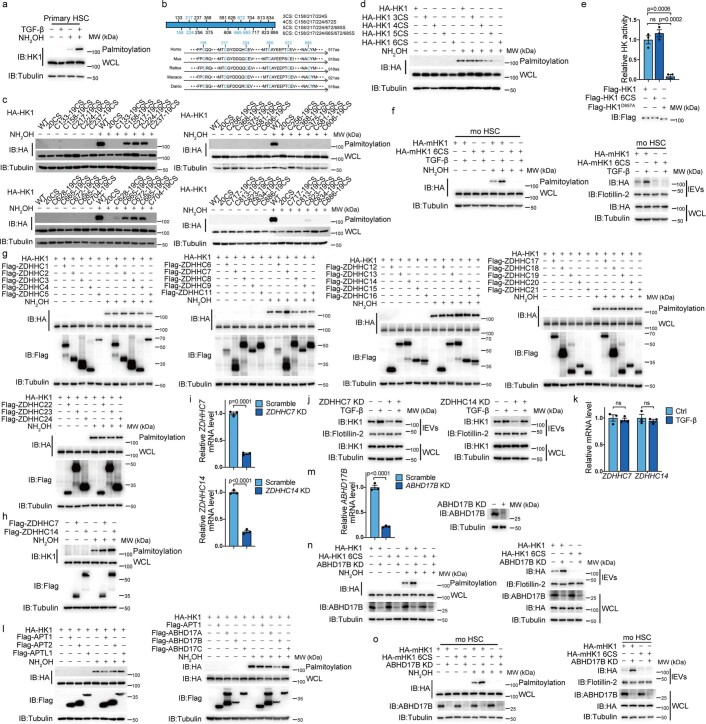
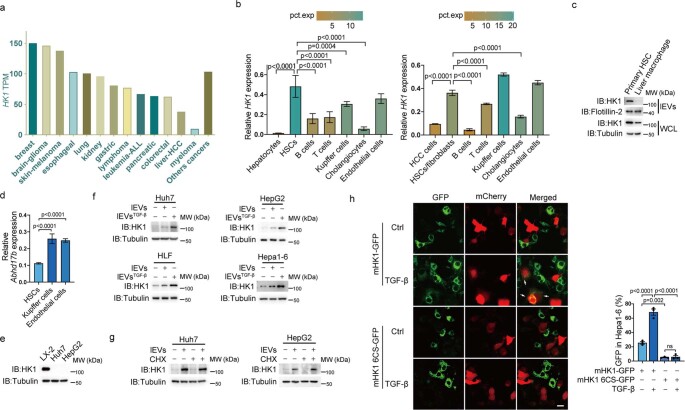
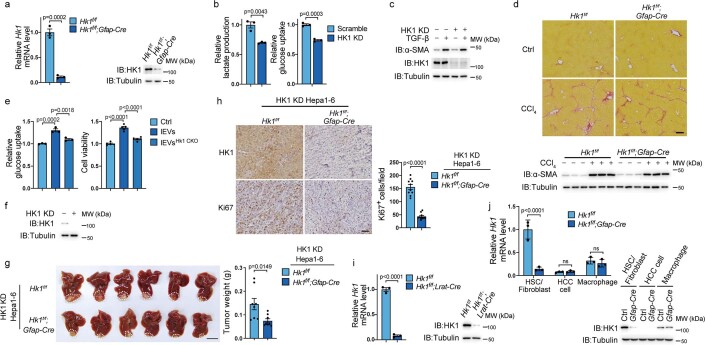
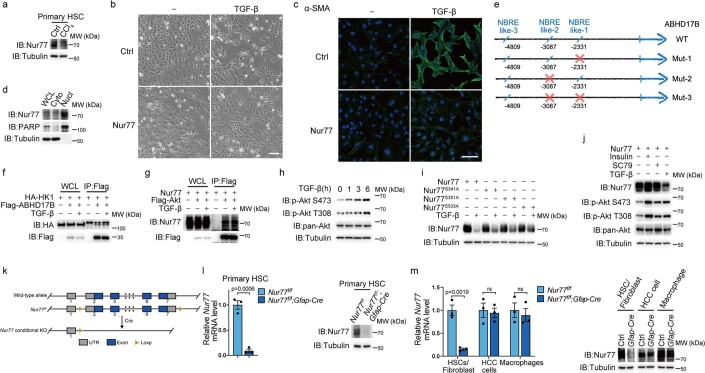
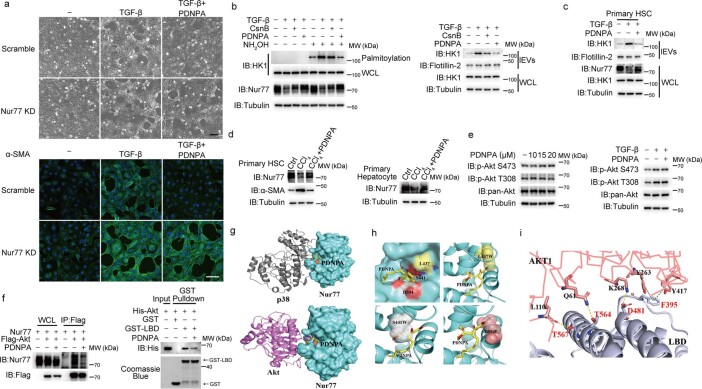
Extracellular vesicles play crucial roles in intercellular communication in the tumor microenvironment. Here we demonstrate that in hepatic fibrosis, TGF-β stimulates the palmitoylation of hexokinase 1 (HK1) in hepatic stellate cells (HSCs), which facilitates the secretion of HK1 via large extracellular vesicles in a TSG101-dependent manner. The large extracellular vesicle HK1 is hijacked by hepatocellular carcinoma (HCC) cells, leading to accelerated glycolysis and HCC progression. In HSCs, the nuclear receptor Nur77 transcriptionally activates the expression of depalmitoylase ABHD17B to inhibit HK1 palmitoylation, consequently attenuating HK1 release. However, TGF-β-activated Akt functionally represses Nur77 by inducing Nur77 phosphorylation and degradation. We identify the small molecule PDNPA that binds Nur77 to generate steric hindrance to block Akt targeting, thereby disrupting Akt-mediated Nur77 degradation and preserving Nur77 inhibition of HK1 release. Together, this study demonstrates an overlooked function of HK1 in HCC upon its release from HSCs and highlights PDNPA as a candidate compound for inhibiting HCC progression.


Conflict of interest statement

The authors declare no competing interests.

Figures

Fig. 1
Fig. 1. TGF-β induced secretion of lEV HK1 in hepatic fibrosis.
For the experiments described in this figure, cells were treated with TGF-β (2 ng ml−1) for 36 h as indicated, after which cell lysates and lEVs or sEVs were prepared for the required experiments unless otherwise stated. a,b, Proteomics analysis of LX-2 cell–derived lEVs or sEVs by mass spectrometry. a, Pathway enrichment analysis (http://geneontology.org) of proteins under TGF-β treatment. b, List of proteins involved in metabolic pathways enriched in lEVs. c, Detection of TGF-β-induced HK1 secretion in lEVs and sEVs (left) and lEV HK1 secretion with or without SB505124 (5 μM) treatment (right). d,e, Detection of lEV HK1 secretion in immortalized moHSCs (d), and mouse primary HSCs and mouse primary hepatocytes (e). f, Left, comparison of HK1 secretion in primary HSCs isolated from control mice or mice with CCl4-induced hepatic fibrosis; right, comparison of HK1 secretion from primary HSCs and HCC-associated fibroblasts from mice with DEN/CCl4-induced hepatocarcinoma. g, HK1 levels shown in plasma lEVs derived from healthy donors and patients with liver cirrhosis (n = 18). h,i, HK1 localization determined by confocal microscopy (h; n = 3 independent experiments) or fractionation assays (i). Hsp60 and Na+/K+-ATPase were used to indicate mitochondria (Mito) and plasma membrane (PM), respectively. Scale bar, 10 μm. j, Detection of TGF-β-induced lEV HK1 in ARRDC1 knockdown (KD) or TSG101 KD cells. k, Comparison of lEV HK1 levels in TSG101-expressing and TSG101M95A-expressing cells. Flotillin-2 was used as a loading control for EVs. Tubulin was used as a protein loading control. WCL, whole cell lysates. Statistical data are presented as the mean ± s.e.m. Statistical analysis (h) was determined by two-tailed Student’s t-test. All western blots were repeated three times and one of them is shown. Source data
Fig. 2
Fig. 2. TGF-β-induced palmitoylation promotes HK1 translocation to the plasma membrane.
For the experiments described in this figure, LX-2 cells were treated with TGF-β (2 ng ml−1) for 36 h as indicated, and cell lysates and lEVs were prepared for western blotting unless specifically indicated otherwise. a, Detection of HK1 palmitoylation in the presence of 2-BP (100 μM) (top) or PalmB (50 μM) (bottom) with or without TGF-β treatment. b,c, Effect of 2-BP and PalmB on HK1 translocation, analyzed by fractionation assays (b) and confocal microscopy (c; n = 3 independent experiments). Scale bar, 10 μm. d, Effect of 2-BP and PalmB on HK1 secretion. eh, Comparison of HK1 palmitoylation (e), localization (f, g; n = 3 independent experiments) and secretion (h) in HK1-expressing and HK1 6CS-expressing LX-2 cells. Scale bar, 10 μm. i, Detection of HK1 palmitoylation (right) and secretion (left) in ABHD17B knockdown cells. j, Effect of TGF-β on ABHD17B mRNA and protein expression levels (n = 3 independent experiments). Flotillin-2 was used as a loading control for EVs. Tubulin was used as a protein loading control. Statistical data are presented as the mean ± s.e.m. Statistical analyses were determined by two-tailed Student’s t-test (c, right; j) and one-way ANOVA, followed by Tukey’s post hoc test (c, left; g). All western blots were repeated three times and one of them is shown. Source data
Fig. 3
Fig. 3. lEV HK1 is hijacked by HCC cells to promote glycolysis.
a, HK1-GFP-expressing or HK1 6CS-GFP-expressing LX-2 cells and mCherry-expressing Huh7 cells were cocultured for 48 h, and the proportion of GFP taken up by Huh7 cells (%) is indicated. Scale bar, 10 μm. n = 3 independent experiments. b,c, GFP-expressing Hepa1-6 cells were orthotopically inoculated into mice liver. Two weeks later, DiI-labeled (0.5 μM) lEVs derived from TGF-β-treated moHSCs were intravenously injected into these mice for 12 h. GFP and DiI signals in different tissues are shown (b), and corresponding xenograft tissue sections were observed (c; scale bar, 100 μm). d, Uptake of lEV HK1 by hepatoma cells in vivo. mCherry-expressing Hepa1-6 cells were used to generate orthotopic xenografts in C57BL/6 mice. lEVs derived from activated HK1-GFP-expressing moHSCs were intravenously injected into the mice. Scale bar, 100 μm. e, The mRNA level of Hk1 was detected by in situ hybridization experiment, and the protein levels of HK1 and α-SMA were detected by immunofluorescence assay in the sections from orthotopic xenografts (scale bar, 100 μm). f,g, HK1 was knocked down with or without re-expression of HK1 or HK1 6CS in LX-2 cells. Huh7 and HepG2 cells were incubated with different groups of lEVs derived from activated LX-2 cells as indicated for 12 h, and the ECAR (n = 9, 3 independent samples were detected and each sample was measured three times during 20–40 min of the timeline shown as ECAR measurement curves) and glucose uptake (n = 3 independent experiments) were determined. h,i, Effect of different groups of lEVs or inhibitors on Huh7, HepG2 and HLF cell viability. Cells were incubated with different groups of lEVs for 72 h (h; n = 3 independent experiments for Huh7 and HepG2 cells; n = 4 independent experiments for HLF cells) with or without 2-DG (10 mM) and 3-PO (20 μM) treatment (i; n = 3 independent experiments). WT, wild-type. Statistical data are presented as the mean ± s.e.m. Statistical analyses were determined by one-way ANOVA followed by Tukey’s post hoc test (a, f, g, h) and two-way ANOVA followed by Tukey’s multiple comparison test (i). Source data
Fig. 4
Fig. 4. Mouse models demonstrate the role of lEV HK1 in HCC progression.
ad, Mice bearing orthotopic xenografts were intravenously injected with lEVs derived from different activated moHSCs indicated. Representative images (scale bar, 1 cm) and weights of orthotopic tumors are indicated (c; n = 8 independent mice). The expression of HK1 and Ki67 is shown (b, d; scale bar, 100 μm; n = 12 fields from three independent tumor tissues). eh, Representative images (scale bar, 1 cm) and weights of Hepa1-6 orthotopic liver tumors in Hk1f/f and Hk1f/f;Gfap-Cre (e) or Hk1f/f;Lrat-Cre (g) mice are indicated (e, g; n = 8 independent mice). The expression of HK1 and Ki67 in tumors is shown (f, h; scale bar, 100 μm; n = 10 fields from three independent tumor tissues). i,j, Representative images of the livers (scale bar, 1 cm) in Hk1f/f and Hk1f/f;Gfap-Cre mice with DEN/CCl4-induced HCC (n = 8 independent mice) are indicated, and tumor number and large tumor number (Φ > 3 mm) per mouse were quantified (i). The expression of HK1 and Ki67 in tumors is shown (j; scale bar, 100 μm; n = 12 fields from three independent tumor tissues). kn, Representative images of the liver (scale bar, 1 cm), total tumor number and large tumor number (Φ > 3 mm) per mouse and liver/body weight ratio in Hk1f/f and Hk1f/f;Gfap-Cre mice (k; n = 14 independent mice), or Hk1f/f;Lrat-Cre mice (m; n = 12 independent mice). The expression of HK1 and Ki67 is shown (l, n; scale bar, 100 μm, n = 12 fields from three independent tumor tissues). o,p, lEVs derived from control or HK1 knockdown moHSCs were injected via tail vein into mice that were intravenously inoculated with luciferase-expressing Hepa1-6 cells. Tumor metastases were indicated by the luciferous signals and hematoxylin and eosin (H&E) staining (o; n = 8 independent mice). The HK1 expression in metastatic tumors are shown (p; scale bar, 100 μm. Three independent mice in each group were detected with similar results. Statistical data are presented as the mean ± s.e.m. Statistical analyses were determined by two-tailed Student’s t-test (en) and one-way ANOVA, followed by Tukey’s post hoc test (ad, o). Source data
Fig. 5
Fig. 5. Nur77 positively represses lEV HK1 secretion from stromal HSCs.
For the experiments described in this figure, LX-2 cells were treated with TGF-β (2 ng ml−1) for 36 h as indicated, and cell lysates and lEVs were prepared for western blotting unless specifically stated otherwise. a, Effect of Nur77 on TGF-β-induced α-SMA expression. b, Detection of TGF-β-induced HK1 palmitoylation (top) and secretion (bottom) with or without Nur77 knockdown. c, Analysis of ABHD17B promoter activity and ABHD17B mRNA and protein expression levels in cells in which Nur77 was overexpressed (left) or knocked down (right) (n = 3 independent experiments). d, Nur77 bound NBRE-like sequences at the ABHD17B promoter detected by ChIP assay (n = 3 independent experiments). e, The mutation of NBRE-like sequences impaired Nur77 activation on the ABHD17B promoter (n = 3 independent experiments). f, Nur77 inhibited HK1 palmitoylation and secretion through ABHD17B mediation. g, Effect of different inhibitors on TGF-β-induced Nur77 degradation. Cells were treated with TGF-β and different protein kinase inhibitors for 6 h (LY294002 (20 μM), Go6983 (100 nM), SB202190 (10 μM), PD98059 (20 μM) and JNK inhibitor II (20 μM)). h, TGF-β-induced Nur77 phosphorylation (top) was inhibited by LY294002 (bottom). i, Effect of Nur77 or its phosphorylation mutant on HK1 palmitoylation and secretion. j,k, Effect of Nur77 and HK1 knockout in HSCs on the growth of orthotopic xenograft tumors (j; scale bar, 1 cm; n = 8 independent mice) and the expressions of HK1 and Ki67 in tumor tissues (k; scale bar, 100 μm; n = 12 fields from three independent tumor tissues). Flotillin-2 was used as a loading control for EVs. Tubulin was used as a protein loading control. Statistical data are presented as the mean ± s.e.m. Statistical analyses were determined by two-tailed Student’s t-test (c, left), one-way ANOVA followed by Tukey’s post hoc test (c, right; j, k), and two-way ANOVA followed by Sidak’s multiple comparison test (d, e). All western blots were repeated three times and one of them is shown. Source data
Fig. 6
Fig. 6. PDNPA targets Nur77 to inhibit lEV HK1 release.
For the experiments described in this figure, LX-2 cells were treated with TGF-β (2 ng ml−1) or PDNPA (10 μM) for 36 h as required unless specifically defined otherwise. a, Effect of PDNPA on TGF-β-induced HK1 secretion in the presence or absence of Nur77. b, Effect of PDNPA on ABHD17B mRNA and protein expression levels mediated by Nur77. c, Roles of PDNPA in HK1 palmitoylation and secretion upon ABHD17B knockdown. d, Effect of PDNPA on the interaction between Nur77 or a Nur77 mutant (Nur773mut) and Akt. e, Comparison of the effect of PDNPA on Nur77-mediated and Nur773mut-mediated HK1 palmitoylation and secretion. f, Assessment of the interaction between Nur77 or a Nur77 mutant (Nur774mut) and Akt upon transfection (top) and GST pull-down assay (bottom). g, Effect of Nur77 or Nur774mut on HK1 palmitoylation and secretion. h, A docking model indicates that the binding of PDNPA to the Nur77 LBD produces steric hindrance that blocks AKT targeting. i,j, Effect of PDNPA on DEN/CCl4-induced HCC development in Nur77f/f and Nur77f/f;Gfap-Cre mice (I; n = 8 independent mice; scale bar, 1 cm). Total tumor number and large tumor number (Φ > 3 mm) per mouse were quantified. The expressions of HK1, α-SMA and Ki67 in corresponding tumor samples are shown (j; scale bar, 100 μm; n = 9 fields from three independent tumor tissues). Flotillin-2 was used as a loading control for EVs. Tubulin was used as a protein loading control. Statistical data are presented as the mean ± s.e.m. Statistical analyses were determined by two-way ANOVA followed by Tukey’s (b) and Sidak’s (i, j) multiple comparison tests. All western blots were repeated three times and one of them is shown. Source data
Fig. 7
Fig. 7. During hepatic fibrosis, TGF-β-activated Akt phosphorylates Nur77 to induce its degradation in HSCs, leading to the suppressed expression of depalmitoylase ABHD17B, a downstream target gene of Nur77.
The palmitoylation of HK1 is thus elevated, which promotes HK1 translocation to the plasma membrane for subsequent secretion via lEVs. The HSC-derived lEV HK1 is hijacked by HCC cells, which facilitates the reprogramming of glycolysis to promote HCC progression. Compound PDNPA antagonizes TGF-β-induced Nur77 degradation and inhibits HK1 secretion, thereby effectively repressing HCC progression.
Extended Data Fig. 1
Extended Data Fig. 1. Large extracellular vesicle HK1 was secreted in a TSG101-dependent manner in hepatic fibrosis.
(a-b) The myofibroblast-like morphology of LX-2 cells (a, 3 times experiments were repeated independently with similar results) and α-SMA expression level in LX-2 cells (b). Scale bar, 100 μm. (c) Analysis of the morphology (left) and size distribution (right) of LX-2 cell-derived lEVs or sEVs. Scale bar, 200 nm, 3 times experiments were repeated independently with similar results. (d) Analyses of lEVs and sEVs of LX-2 cells. (e) Density gradient fractionation of lEVs derived from LX-2 cells. After flotation of sample in iodixanol gradients, equal volumes of each fraction were loaded on SDS-PAGE gels. (f) TGF-β induced HK1 but not HK2 secretion in LX-2 cells. (g-h) CCl4 induced fibrosis in liver tissue from C57BL/6 mice, as indicated by Sirius Red staining (f) and α-SMA expression, accompanied by elevated HK1 levels (g, n = 6 independent mice). Scale bar, 100 μm. (i) HK1 levels were detected in plasma lEVs from control and CCl4-induced liver fibrosis mice (n = 6 independent mice). (j) Effect of TGF-β on HK1 and HK1D657A secretion in LX-2 cells. (k) Efficiency of ARRDC1 or TSG101 KD in LX-2 cells. (l-m) lEV proteins from control or TSG101 KD LX-2 cells were detected by label-free quantitative mass spectrometry, and shown in scatter plot (l) and histogram (m). (n) The levels of proteins as indicated were detected in control or TSG101 KD LX-2 cells. Flotillin-2 was used as a loading control for EVs. Tubulin was used as a protein loading control. WCL, whole cell lysates. Statistic data are presented as the mean ± SEM. Statistical analyses were determined by two-tailed Student’s t-test (k) and one-way ANOVA, followed by Tukey’s post hoc test (m). All western blots are repeated three times and one of them is shown. Source data
Extended Data Fig. 2
Extended Data Fig. 2. Palmitoylation of HK1 is required for its secretion.
(a) Palmitoylation of HK1 was detected in primary HSCs. (b) Distribution of twenty cysteine residues in the HK1 monomer, the combination of different palmitoylation point mutants (top), and comparison of HK1 sequences in different species (bottom). (c) Comparison of palmitoylation of HK1 and related single-point HK1 rescue mutants based on HK1 20CS in 293T. (d) Comparison of palmitoylation of HK1 and HK1 mutants in LX-2. (e) Comparison of HK1, HK1 6CS and HK1D657A enzyme activity. (f) Comparison palmitoylation and secretion of mouse HK1 and HK1 6CS. (g-h) Effect of different ZDHHC palmitoyltransferases on HK1 palmitoylation. Different palmitoyltransferases and HK1 were transfected into 293T cells (g) or LX-2 cells (h) as indicated, and HK1 palmitoylation was detected. (i) Efficiency of ZDHHC7 and ZDHHC14 KD in LX-2 cells. (j) The KD of ZDHHC7 or ZDHHC14 did not abolish the TGF-β-induced secretion of lEV HK1 in LX-2 cells. (k) TGF-β had no effect on the mRNA expression of ZDHHC7 or ZDHHC14 in LX-2 cells. (l) Effect of different depalmitoylases on HK1 palmitoylation. Different depalmitoylases and HK1 were transfected into 293T cells, and HK1 palmitoylation was detected. (m) Efficiency of ABHD17B KD in LX-2 cells. (n-o) Effect of ABHD17B on HK1 palmitoylation and secretion. HK1 and HK1 6CS were transfected into control or ABHD17B KD LX-2 cells (n) or immortalized mouse HSCs (o). Flotillin-2 was used as a loading control for EVs. Tubulin was used as a protein loading control. Statistic data are presented as the mean ± SEM. Statistical analyses were determined by two-tailed Student’s t-test (i, k, m) and one-way ANOVA, followed by Tukey’s post hoc test (e). All western blots are repeated three times and one of them is shown. Source data
Extended Data Fig. 3
Extended Data Fig. 3. HCC cells hijack lEV HK1 derived from HSCs.
(a) HK1 expression levels in different types of cancer cell lines from the Cancer Cell Line Encyclopedia (CCLE) collection. (b) HK1 expression levels were analyzed using scRNA-seq data from normal liver tissues (GSE158723, cell numbers: 9823 hepatocytes, 124 HSCs, 184 B cells, 186 T cells, 1405 Kupffer cells, 515 cholangiocytes and 472 endothelial cells) and HCC tissues (GSE151530, cell numbers: 20640 HCC cells, 1820 HSCs, 1167 B cells, 21131 T cells, 5983 Kupffer cells, 2659 cholangiocytes and 3321 endothelial cells). (c) lEV HK1 was detected in primary HSCs and primary macrophages from CCl4-induced liver fibrosis mice. (d) Abhd17b expression levels in HSCs, Kupffer cells and endothelial cells were analyzed using scRNA-seq data (GSE171904, cell numbers: 6472 HSCs, 465 Kupffer cells, 3439 endothelial cells). (e) The HK1 protein was undetectable in Huh7 or HepG2 cells. (f) Huh7, HepG2 and HLF cells were treated with lEVs derived from LX-2 cells. Hepa1-6 cells was treated with lEVs derived from mo HSCs. (g) Effect of CHX on HK1 transmission into Huh7 and HepG2 cells. Cells were incubated with CHX (100 µg/mL) and lEVs extracted from TGF-β-treated LX-2 cells for 12 hours. (h) Comparison of HK1-GFP and HK1 6CS-GFP uptake by Hepa1-6 cells (indicated by arrows). HK1-GFP- or HK1 6CS-GFP-expressing mo HSCs cultured together with mCherry-expressing Hepa1-6 cells for 48 hours with or without TGF-β treatment. Scale bar, 10 μm, n = 3 independent experiments. Tubulin was used as a protein loading control. Statistic data are presented as the mean ± SEM. Statistical analyses were determined by one-way ANOVA, followed by Tukey’s post hoc test (b, d, h). All western blots are repeated three times and one of them is shown. Source data
Extended Data Fig. 4
Extended Data Fig. 4. Large extracellular vesicle HK1 derived from HSCs promoted HCC proliferation.
(a) Primary HSCs were isolated from Hk1f/f or Hk1f/f;Gfap-Cre mice. The HK1 level was detected by qRT-PCR and western blotting, n = 3 independent experiments. (b) Detection of lactate production and glucose uptake with or without HK1 KD in LX-2 cells, n = 3 independent experiments. (c) α-SMA expression were detected in control or HK1 KD LX-2 cells with or without TGF-β (2 ng/mL) stimulation for 36 hours. (d) CCl4-induced liver fibrosis in Hk1f/f or Hk1f/f;Gfap-Cre mice were determined by Sirius Red staining (top) and the detection of α-SMA (bottom, n = 3 independent mice) in liver tissue. Scale bar, 100 μm. (e) Glucose uptake (n = 3 independent experiments) and cell proliferation (n = 5 independent experiments) of Hepa1-6 cells were determined after incubation of activated primary HSC-derived lEVs. (f) HK1 knockdown efficiency in Hepa1-6 cells. (g) Representative images (scale bar, 1 cm) and weights of HK1 KD Hepa1-6 cell-derived orthotopic xenografts in Hk1f/f and Hk1f/f;Gfap-Cre mice (n = 8 independent mice). (h) Immunohistochemical staining showed the expression of HK1 and Ki67 in corresponding tumor samples. Scale bar, 100 μm, n = 10 fields from 3 independent tumor tissues. (i) Primary HSCs were isolated from Hk1f/f or Hk1f/f;Lrat-Cre mice. The mRNA and protein levels of HK1 were detected (n = 3 independent experiments). (j) Systematic analysis of HK1 expression in HFD/STZ-induced hepatocarcinoma between Hk1f/f and Hk1f/f;Gfap-Cre mice. Primary cells as indicated were isolated from livers of HCC mice and the mRNA and protein levels of HK1 were detected (n = 3 independent experiments). Statistic data are presented as the mean ± SEM. Statistical analyses were determined by two-tailed Student’s t-test (a, b, g, h, i, j) and one-way ANOVA, followed by Tukey’s post hoc test (e). All western blots are repeated three times and one of them is shown. Source data
Extended Data Fig. 5
Extended Data Fig. 5. Nur77 degradation was induced by TGF-β in Akt-dependent manner.
(a) Nur77 expression was detected in primary HSCs from control and CCl4-induced liver fibrosis mice. (b-c) Effect of Nur77 on the myofibroblast-like morphology (b) and α-SMA expression (c) in LX-2 cells. Scale bar, 100 μm. (d) Localization of endogenous Nur77 in LX-2 was detected by fractionation assay. (e) Three Nur77-binding response element (NBRE)-like sequences in the ABHD17B promoter are indicated. (f) Effect of TGF-β on the interaction between HK1 and ABHD17B. Cells were treated with TGF-β (2 ng/mL) for 3 hours. (g) Effect of TGF-β on the interaction between Nur77 and Akt. (h) Effect of TGF-β on Akt activity in LX-2 cells. (i) Effects of Nur77 mutation at the three indicated phosphorylation sites. LX-2 cells were treated for 6 hours with or without TGF-β (2 ng/mL). (j) The levels of Nur77, Akt and Akt phosphorylation were detected in LX-2 cells that were treated with insulin (5 μg/mL), SC79 (10 μM) or TGF-β 2 ng/mL) for 6 hours. (k) Scheme showing construction of the Nur77f/f mouse strain. (l) The mRNA and protein expression of Nur77 were detected in primary HSCs from Nur77f/f or Nur77f/f;Gfap-Cre mice. (m) Systematic analysis of Nur77 expression in Hepa1-6-induced orthotopic HCC between Nur77f/f and Nur77f/f;Gfap-Cre mice. Primary cells as indicated were isolated from fresh livers in HCC mice and the mRNA and protein levels of Nur77 were detected by qRT-PCR and western blotting. Tubulin was used as a protein loading control. Statistic data are presented as the mean ±·SEM. Statistical analyses were determined by two-tailed Student’s t-test (l, m). All western blots are repeated three times and one of them is shown. Source data
Extended Data Fig. 6
Extended Data Fig. 6. The binding of PDNPA to Nur77 generated hindrance to impede the interaction between Nur77 and Akt.
(a) PDNPA inhibited TGF-β-mediated induction of a myofibroblast-like morphology (top) and α-SMA expression (bottom) in LX-2 cells in a Nur77-dependent manner. Scale bar, 100 μm, 3 times experiments were repeated independently with similar results. (b) Comparison of the effect of PDNPA and Csn-B on TGF-β-induced HK1 palmitoylation and secretion. TGF-β (2 ng/mL), PDNPA (10 μM) or Csn-B (10 μM) were used to treat LX-2 cells for 36 hours. (c) Effect of PDNPA on Nur77 expression and HK1 secretion detected in primary HSCs. (d) Nur77 protein levels were detected in primary HSCs and hepatocytes isolated from control mice and CCl4-induced liver fibrosis mice treated with or without PDNPA. (e) PDNPA had no effect on TGF-β-induced Akt activity. (f) Detection of the interaction between the Nur77 LBD and Akt in the presence of PDNPA upon transfection in LX-2 cells (left) and in an in vitro GST pulldown assay (right). (g) A docking model showing that Akt and p38 bind the same pocket of the Nur77 LBD. (h) Crystal structures of the S441W and L437W D594E mutants shows that the introduction of bulkier residues prevents PDNPA binding. (i) A docking model indicates that F395A, D481A, T564A and T567A impair the interaction between the Nur77 LBD and Akt. Tubulin was used as a protein loading control. All western blots are repeated three times and one of them is shown. Source data

Comment in

References

    1. Duran A, et al. p62/SQSTM1 by binding to vitamin D receptor inhibits hepatic stellate cell activity, fibrosis, and liver cancer. Cancer Cell. 2016;30:595–609. doi: 10.1016/j.ccell.2016.09.004. - DOI - PMC - PubMed
    1. Yoshimoto S, et al. Obesity-induced gut microbial metabolite promotes liver cancer through senescence secretome. Nature. 2013;499:97–101. doi: 10.1038/nature12347. - DOI - PubMed
    1. He C, Shu B, Zhou Y, Zhang R, Yang X. The miR-139-5p/peripheral myelin protein 22 axis modulates TGF-β-induced hepatic stellate cell activation and CCl4-induced hepatic fibrosis in mice. Life Sci. 2021;276:119294. doi: 10.1016/j.lfs.2021.119294. - DOI - PubMed
    1. Han S, et al. Activated hepatic stellate cells promote hepatocellular carcinoma cell migration and invasion via the activation of FAK-MMP9 signaling. Oncol. Rep. 2014;31:641–648. doi: 10.3892/or.2013.2872. - DOI - PubMed
    1. Lin N, et al. Activated hepatic stellate cells promote angiogenesis in hepatocellular carcinoma by secreting angiopoietin-1. J. Cell. Biochem. 2020;121:1441–1451. doi: 10.1002/jcb.29380. - DOI - PubMed

Publication types

MeSH terms

Substances