Review
. 2023 Jun;41(6):773-782.
doi: 10.1038/s41587-022-01448-2. Epub 2022 Oct 3.

The expanding vistas of spatial transcriptomics

Affiliations
Review

The expanding vistas of spatial transcriptomics

Luyi Tian et al. Nat Biotechnol. 2023 Jun.

Abstract

The formation and maintenance of tissue integrity requires complex, coordinated activities by thousands of genes and their encoded products. Until recently, transcript levels could only be quantified for a few genes in tissues, but advances in DNA sequencing, oligonucleotide synthesis and fluorescence microscopy have enabled the invention of a suite of spatial transcriptomics technologies capable of measuring the expression of many, or all, genes in situ. These technologies have evolved rapidly in sensitivity, multiplexing and throughput. As such, they have enabled the determination of the cell-type architecture of tissues, the querying of cell-cell interactions and the monitoring of molecular interactions between tissue components. The rapidly evolving spatial genomics landscape will enable generalized high-throughput genomic measurements and perturbations to be performed in the context of tissues. These advances will empower hypothesis generation and biological discovery and bridge the worlds of tissue biology and genomics.


Conflict of interest statement

Competing Interests:

FC and EZM are consultants for Atlas Bio, Inc.

Figures

Figure 1.
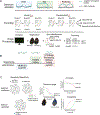
Figure 1.. Usage of spatial transcriptomics in biological experimentation.
A) Three primary classes of biological questions addressed by spatial transcriptomics. Colored hexagons represent different types of cells indicated by ɑ, ꞵ, and ɣ in the corresponding model equations. B) Summary of the two classes of ST technology: sequencing-based and imaging-based methods. The input to ST technologies are generally tissue sections, and the output is generally a digital gene expression matrix and a table of spatial coordinates for each spot. Detailed descriptions of individual methods within these two classes are shown in Figure 2 and Figure 3.
Figure 2.
Figure 2.. Sequencing-based spatial transcriptomics methodology and characterization.
A) Workflow of sequencing-based spatial transcriptomics methods. Strategies for the fabrication of indexed pixel surfaces wherein DNA barcoded primers are associated with spatial localization. Microarray-based strategies utilize deterministic DNA barcodes printed on glass slides. Bead-based strategies utilize DNA-conjugated beads with diverse, clonal barcodes whose spatial locations are ascertained. Nanoball- or polony-based strategies utilize local clonal amplification to generate clusters of clonally barcoded primers. Microfluidic barcoding utilizes channels to deterministically deliver row and column barcodes to a tissue, forming a 2D grid. B) Steps of sequencing library generation downstream of surface indexing. Basic computational processing of the data results in a digital gene expression matrix, with a paired table of coordinates for each pixel. C) Top, sensitivity of selected sST technologies ,,–,,, represented by the average number of UMI counts per normalized 10μm spot, and colored by the tissue type; bottom, the reported spot size for each technology is shown in gray, and the binned resolution used for analysis shown in purple. D) Proposed approaches for benchmarking sequencing-based ST technologies. Representative regions of interest (outlined areas in images at left) are selected from tissues and different quality control metrics are applied to the selected region to quantify the sensitivity of RNA capture, and the spatial resolution. A marker gene specifically expressed in selected regions was chosen. For capture sensitivity (bar plot, top right), the total counts of the marker gene are summed within the selected region, and compared to the counts ascertained by an smFISH reference assay. For resolution (density plot, bottom right), the intensity of the marker gene expression is quantified across a dimension of the feature, and the feature thickness is compared to the full width half maximum of the profile. Methods A, B, and C represent theoretical ST technologies.
Figure 3.
Figure 3.. Imaging-based spatial transcriptomics methodology and characterization.
A) Depiction of the three fundamental steps in imaging-based spatial transcriptomics. Targeting chemistry summarizes how the target mRNA is labeled; black lines represent mRNA molecules and blue lines indicate oligonucleotide probes. Encoding summarizes two strategies for gene encoding to enable multiplexing. Linear encoding labels different mRNAs in each imaging round. Exponential encoding labels each mRNA in multiple imaging rounds. Image processing highlights major steps in downstream image processing after data collection. First, samples are registered between imaging rounds to the same coordinate space. Then, spots corresponding to single RNA molecules are identified, and assigned to imaging rounds. Lastly, gene identity is decoded for each spot based on the imaging rounds. B) Summary of different encoding and targeting chemistry and key methods in each category. C) Summary of the detection efficiency of select iST technologies at different numbers of genes simultaneously measured ,,,,,,,. D) Experiments to measure and compare the performance of methods, and corresponding quality control metrics. Sensitivity and specificity experiments assess the rate of false-positives and false-negatives through comparisons with smFISH (External Validation), and internal positive and negative control transcripts (Internal validation). As the number of molecular features increase in imaging ST, quality control in dynamic range, accuracy, and scalability need to be examined. Dynamic range represents the maximum number of molecules that can be measured, accounting for molecular crowding. This may differ between methods as a function of signal to noise, and the sparsity of codebooks, and is dependent on the accuracy of the measurement. Scalability considers how the experimental time and cost scales with the number of features.
Figure 4.
Figure 4.. The future of contextual genomics.
The in situ measurement of transcriptomes marks the beginning of a larger technological effort to import genomic measurements into intact biological systems. Innovation along three major axes–resolution, modality, and dynamics–will provide powerful new tools for interrogating tissue structure and function.

References

    1. Moffitt JR et al. Molecular, spatial, and functional single-cell profiling of the hypothalamic preoptic region. Science 362, (2018). - PMC - PubMed
    1. Ortiz C et al. Molecular atlas of the adult mouse brain. Sci Adv 6, eabb3446 (2020). - PMC - PubMed
    1. Zhang M et al. Spatially resolved cell atlas of the mouse primary motor cortex by MERFISH. Nature 598, 137–143 (2021). - PMC - PubMed
    1. Wang X et al. Three-dimensional intact-tissue sequencing of single-cell transcriptional states. Science 361, (2018). - PMC - PubMed
    1. Chen R et al. Decoding molecular and cellular heterogeneity of mouse nucleus accumbens. Nat. Neurosci 24, 1757–1771 (2021). - PMC - PubMed

Publication types