Meta-Analysis
. 2022 Oct 3;23(1):680.
doi: 10.1186/s12864-022-08914-w.

Genome-wide meta-QTL analyses provide novel insight into disease resistance repertoires in common bean

Affiliations
Meta-Analysis

Genome-wide meta-QTL analyses provide novel insight into disease resistance repertoires in common bean

Asma Rahmanzadeh et al. BMC Genomics. .

Abstract

Background: Common bean (Phaseolus vulgaris) is considered a staple food in a number of developing countries. Several diseases attack the crop leading to substantial economic losses around the globe. However, the crop has rarely been investigated for multiple disease resistance traits using Meta-analysis approach.

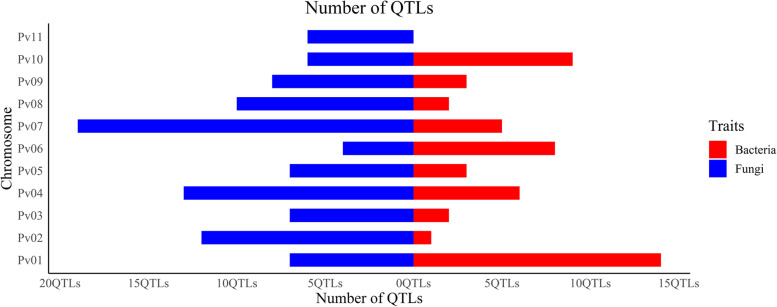
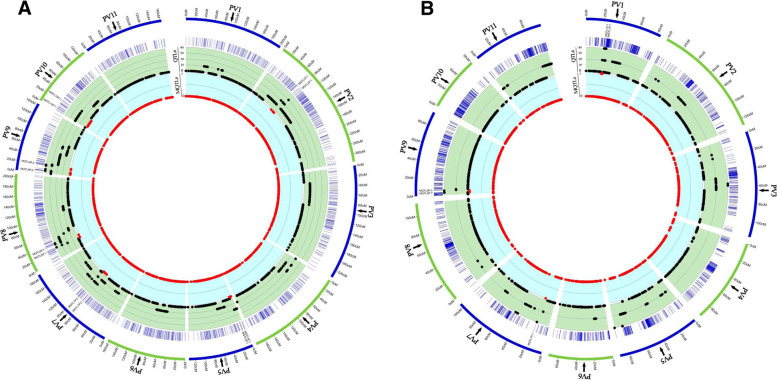
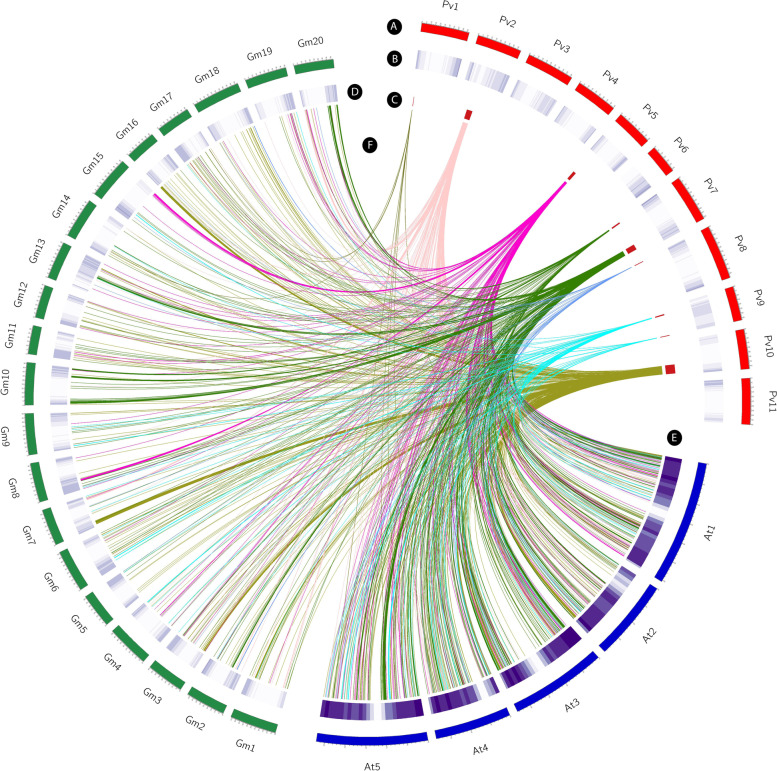
Results and conclusions: In this study, in order to identify the most reliable and stable quantitative trait loci (QTL) conveying disease resistance in common bean, we carried out a meta-QTL (MQTL) analysis using 152 QTLs belonging to 44 populations reported in 33 publications within the past 20 years. These QTLs were decreased into nine MQTLs and the average of confidence interval (CI) was reduced by 2.64 folds with an average of 5.12 cM in MQTLs. Uneven distribution of MQTLs across common bean genome was noted where sub-telomeric regions carry most of the corresponding genes and MQTLs. One MQTL was identified to be specifically associated with resistance to halo blight disease caused by the bacterial pathogen Pseudomonas savastanoi pv. phaseolicola, while three and one MQTLs were specifically associated with resistance to white mold and anthracnose caused by the fungal pathogens Sclerotinia sclerotiorum and Colletotrichum lindemuthianum, respectively. Furthermore, two MQTLs were detected governing resistance to halo blight and anthracnose, while two MQTLs were detected for resistance against anthracnose and white mold, suggesting putative genes governing resistance against these diseases at a shared locus. Comparative genomics and synteny analyses provide a valuable strategy to identify a number of well‑known functionally described genes as well as numerous putative novels candidate genes in common bean, Arabidopsis and soybean genomes.

Keywords: Antrachnose; Halo blight; Meta-analysis; Phaseolus vulgaris; Quantitative trait loci; White mold.


Conflict of interest statement

Authors do not have financial or non-financial interests that directly or indirectly related to this work.

Figures

Fig. 1
Fig. 1
The highest number of QTLs governing resistance to fungal diseases in common bean was found on chromosome 7, while the highest number of QTLs governing resistance against bacterial diseases was located on chromosome 1
Fig. 2
Fig. 2
Distribution of QTLs and MQTLs on two common bean reference genome maps developed by Galeano et al. 2011 [69] (A) and Song et al. 2015 [70] (B) generated by SOFIA package in Rstudio [74]. The outermost circle shows the chromosomes’ position on the reference maps in cM. The second circle outlines the density of markers on the maps. The third circle displays the QTLs’ density (black dots) while the fourth circle displays the MQTLs density (red dots)
Fig. 3
Fig. 3
Distribution of MQTLs conveying resistance against bacterial and fungal diseases on common bean genome (95% confidence interval). Position of the MQTLs on genome is represented in Mb. In each pair of columns, gene density is shown in the inner of chromosome on the right side of the heatmap. The plot of variations is represented on the left part of the chromosome using a scatter plot in which the average of variations for each MB on each chromosome is indicated through the reference line. Additionally, the regions having variations more than average are presented with red dots. The position of MQTLs is highlighted with grid lines on each chromosome. The significant loci from genome-wide association studies (GWAS) with the genomic position in Mb are shown on the chromosomes for anthracnose and white mold
Fig. 4
Fig. 4
Circular map constructed using the Circos software showing the syntenic regions among common bean, soybean, and Arabidopsis genomes. A: common bean chromosomes, B: gene density on common bean chromosomes, C: position of MQTLs in common bean genome, D: gene density on soybean chromosomes, E: gene density on Arabidopsis chromosomes, F: common bean syntenic regions with soybean and Arabidopsis. The outermost circle represents the genomes in Mb
Fig. 5
Fig. 5
KEGG enrichment analysis of genes underlying MQTLs associated with resistance to bacterial and fungal disease in common bean (A). The y-axis represents the enriched KEGG pathways. The color and the size of pathways descriptions represent the FDR and the count, respectively. Rich factor on the x-axis is the ratio of the gene number to the total gene number in that specific pathway. B Endocytosis pathway map which is involved significantly in plant defense mechanisms against different pathogens. Red boxes represent genes identified in our MQTLs interval. The genes in the green background represent genes that have been previously identified in Arabidopsis. For additional information on the genes for each KEGG description of MQTLs see Table S6. Permission is granted to BMC Genomics to publish under the CC BY 4.0 open access license [59]
Fig. 6
Fig. 6
The predicted resistance genes (R gene) in MQTL regions associated with resistance to bacterial and fungal diseases in common bean. A The genomic position of predicted R genes within MQTL regions was represented on each chromosome. Different types of R genes domains were displayed by color codes in the bottom right-hand corner. B The expression of R genes identified within MQTL regions were displayed by a heat map across different tissues of the common bean

References

    1. Singh SP, Editor. Common bean improvement in the twenty-first century (Vol. 7). Berlin, Germany: Springer Science & Business Media. 2013. ISBN-13: 978–0792358879.
    1. De Ron, A. et al. Common Bean. In: De Ron, A. (eds) Grain Legumes. Handbook of Plant Breeding, vol 10. Springer, New York, NY. 2015. 10.1007/978-1-4939-2797-5_1.
    1. FAOSTAT. Food and Agriculture Organization of the United Nations, FAOSTAT database, available at http://faostat.fao.org/. 2022.
    1. Osdaghi E, Young AJ, Harveson RM. Bacterial wilt of dry beans caused by Curtobacterium flaccumfaciens pv. flaccumfaciens: a new threat from an old enemy. Mol Plant Pathol. 2020;21(5):605–621. doi: 10.1111/mpp.12926. - DOI - PMC - PubMed
    1. Schwartz HF, Steadman JR, Hall R, Forster RL. Compendium of bean diseases (No. Ed. 2). Saint Paul, Minnesota, United States: American Phytopathological Society (APS Press); 2005.

Publication types

MeSH terms

LinkOut - more resources