. 2022 Oct 3;21(1):191.
doi: 10.1186/s12943-022-01661-2.

Monitoring autochthonous lung tumors induced by somatic CRISPR gene editing in mice using a secreted luciferase

Affiliations

Monitoring autochthonous lung tumors induced by somatic CRISPR gene editing in mice using a secreted luciferase

Nastasja Merle et al. Mol Cancer. .

Abstract

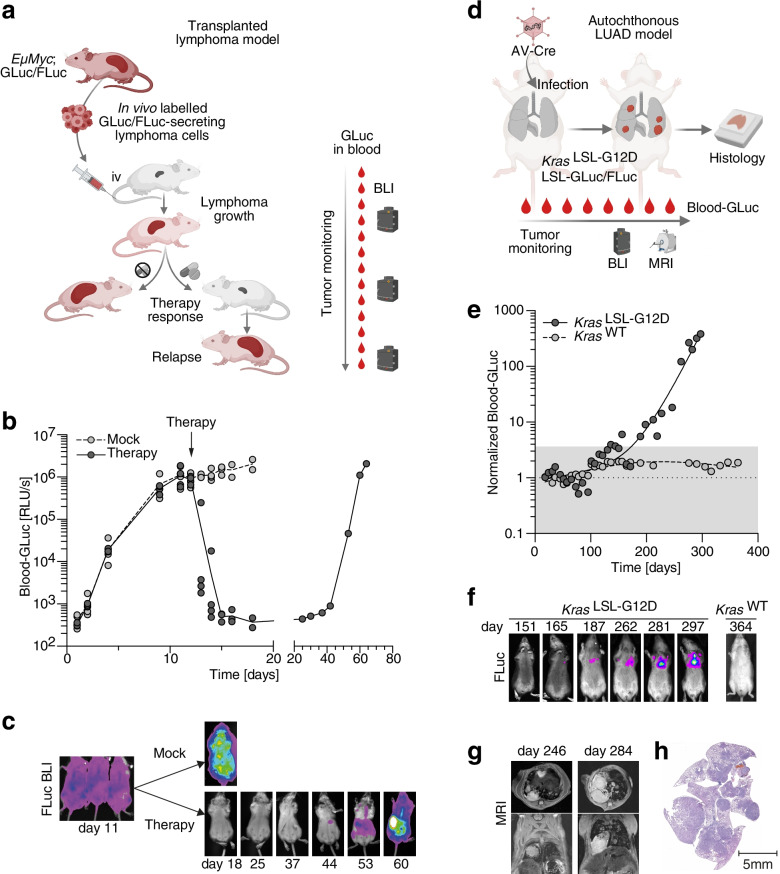
Background: In vivo gene editing of somatic cells with CRISPR nucleases has facilitated the generation of autochthonous mouse tumors, which are initiated by genetic alterations relevant to the human disease and progress along a natural timeline as in patients. However, the long and variable, orthotopic tumor growth in inner organs requires sophisticated, time-consuming and resource-intensive imaging for longitudinal disease monitoring and impedes the use of autochthonous tumor models for preclinical studies.

Methods: To facilitate a more widespread use, we have generated a reporter mouse that expresses a Cre-inducible luciferase from Gaussia princeps (GLuc), which is secreted by cells in an energy-consuming process and can be measured quantitatively in the blood as a marker for the viable tumor load. In addition, we have developed a flexible, complementary toolkit to rapidly assemble recombinant adenoviruses (AVs) for delivering Cre recombinase together with CRISPR nucleases targeting cancer driver genes.

Results: We demonstrate that intratracheal infection of GLuc reporter mice with CRISPR-AVs efficiently induces lung tumors driven by mutations in the targeted cancer genes and simultaneously activates the GLuc transgene, resulting in GLuc secretion into the blood by the growing tumor. GLuc blood levels are easily and robustly quantified in small-volume blood samples with inexpensive equipment, enable tumor detection already several months before the humane study endpoint and precisely mirror the kinetics of tumor development specified by the inducing gene combination.

Conclusions: Our study establishes blood-based GLuc monitoring as an inexpensive, rapid, high-throughput and animal-friendly method to longitudinally monitor autochthonous tumor growth in preclinical studies.

Keywords: Adenovirus; Autochthonous mouse tumor; CRISPR; Luciferase; Lung cancer; Orthotopic tumor.


Conflict of interest statement

The authors declare that they have no competing interests.

Figures

Fig. 1
Fig. 1
Conditional GLuc reporter mice. a Targeting strategy for Gt(ROSA)26Sortm2(CAG−GLuc) mice: insertion of a GLuc cDNA expression cassette controlled by the cytomegalovirus early enhancer/chicken beta actin (CAG) promoter and a loxP-flanked transcriptional stop cassette (LSL) into intron 1 of the Gt(ROSA)26Sor gene locus. b GLuc activity measured in organ lysates of mice with indicated genotypes (n = 3 biological replicates). c GLuc tissue activity. Each data point represents one tissue type (n = 11 tissues; P-values from Dunnett’s multiple comparisons test). d, e Level and temporal stability of GLuc activity in blood plasma of mice with indicated genotypes. d Time course, n = 3 mice per genotype. e Time average ± SD with data points representing individual time points (n = 24 time points; P-values from Dunnett’s multiple comparisons test
Fig. 2
Fig. 2
Monitoring classic tumor models with GLuc. a-c Monitoring of in vivo labelled transplanted lymphomas with GLuc. a Experimental scheme. Red color symbolizes GLuc activity. BLI, bioluminescence imaging. b Time course of GLuc activity in blood samples of mice transplanted with lymphoma cells from EµMyc;Rosa26GLuc/FLuc mice. Data points represent individual mice. c BLI of representative mice at different time points after mock or cyclophosphamide treatment. d-h Monitoring of non-transplanted (autochthonous) lung adenocarcinoma with GLuc. d Experimental scheme. e Temporal development of blood GLuc activity in mice of indicated genotype. f Longitudinal BLI of mice with indicated genotype. g Sequential MRI of the KrasLSL−G12D mouse. h H&E stain of the KrasLSL−G12D mouse lung at time of sacrifice All error bars indicate SD, all data points represent biological replicates/individual mice. BLI, bioluminescence imaging; MRI, magnetic resonance imaging; LUAD, lung adenocarcinoma
Fig. 3
Fig. 3
Toolkit for cloning CRISPR adenoviruses. a Multiple candidate sgRNAs targeting cancer genes of interest are cloned into plasmids co-expressing Cas9 and a puromycin resistance gene for functional validation in cell culture. b Selected validated sgRNA expression cassettes including U6 promoter and sgRNA scaffold are PCR amplified using primer pairs adding a BbsI recognition site and a 4-bp motif specifying the position in the final vector construct. c Optional cloning of PCR amplicons for sequence verification by Sanger sequencing. d Release of complementary overhangs by BbsI. e Golden Gate assembly of multiple BbsI-digested sgRNA-cassettes with BsaI-digested shuttle vectors containing expression cassettes for Cre + Cas9 or Cre only. f Gateway recombination cloning of modified sgRNA-containing shuttle vectors into the adenoviral vector backbone (pAd/PL-Dest destination vector). g Release of linear adenoviral DNA by PacI digest. h Transfection of Ad293 cells for production and amplification of infectious AV particles
Fig. 4
Fig. 4
SCLC induction by adenoviral delivery of CRISPR nucleases. a Experimental scheme for SCLC induction and monitoring with adenoviral vectors (AV) expressing Cre and Trp53/Rb1-targeting Cas9 nucleases. b Validation of sgRNA function by T7 endonuclease I assay using genomic DNA from uninfected and AV-PR.CC9 infected NIH3T3 cells. NTC, no template control. c Western Blot of mouse embryonic fibroblasts (MEF) infected with AV-PR.CC9 showing Cas9 expression and downregulation of p53 and Rb1 protein levels. β-actin is shown as loading control. d Immunohistochemistry for GLuc and Cas9 expression in the lung of mice 1 week after intratracheal AV-PR.CC9 infection. e,f Mutation spectrum of e Trp53 exon 6 and f Rb1 exon 17 sgRNA target loci (flanked by dashed lines). Shown are sequencing reads of the most abundant indel mutations at the sgRNA target site. g Sequential MRI of a representative mouse showing tumor progression. Shown are frontal and transversal sections with tumors marked in blue. h Kaplan–Meier survival plot of WT and LSL-GLuc mice infected with indicated CRISPR-AVs (AV-C.CC9 + GLuc: n = 12; AV-PR.CC9 + GLuc: n = 8; AV-PR.CC9 no GLuc: n = 3). Shown are median survival and P-values from Log-rank (Mantel-Cox) test
Fig. 5
Fig. 5
Molecular characterization and GLuc-based monitoring of CRISPR-induced SCLC. a-c Histological analysis of AV-PR.CC9 induced a primary lung tumors and metastases to the b liver and c kidney. Shown are representative H&E and immunohistochemical stains for GLuc and NE lineage markers (Ascl1, Synaptophysin). d Temporal development of blood GLuc activity in individual mice following infection with indicated AVs (AV-C.CC9 n = 12; AV-PR.CC9 n = 8). Shaded area represents the GLuc background activity. e Trp53 and Rb1 mutation spectra of single AV-PR.CC9 tumors from 5 different mice. Top graph, shown is the frequency of wild-type and mutant reads. For mutant reads, all mutations with a frequency of > 5% are color-coded as deletions or insertions and labelled with the number of deleted or inserted base pairs. Less frequent mutations are summarized as ‘others’. Bottom graph, shown is the size distribution of indel mutations for each tumor. The frequency is each indel mutations is encoded in grayscale
Fig. 6
Fig. 6
GLuc monitoring of SCLC induced by adenoviral sgRNA delivery to Cas9 mice. a Experimental scheme for SCLC induction and monitoring with adenoviral vectors (AV) expressing Cre and Trp53/Rb1/Rbl2-targeting sgRNAs. b Validation of sgRNA function by T7 endonuclease I Assay using genomic DNA from uninfected and AV-PRL.Cre infected NIH3T3-Cas9 cells. NTC, no template control. c Western Blot of LSL-Cas9 fibroblasts infected with AV-PR.Cre and AV-PRL.Cre showing downregulation of p53, Rb1 and Rbl2/p130 protein levels. β-actin is shown as loading control. d Immunohistochemistry for GLuc and Cas9 expression in the lung of mice 2 weeks post infection. Scale bar, 50 µm. e Mutation spectrum of Trp53, Rb1 and Rbl2 sgRNA target loci (flanked by dashed lines). f Kaplan–Meier survival plot of LSL-GLuc mice infected with indicated CRISPR-AVs (AV-C.Cre: n = 14; AV-PR.Cre: n = 12; AV-PRL.Cre: n = 8). Shown are median survival and P-values from Log-rank (Mantel-Cox) test. g Temporal development of blood GLuc activity in mice from f following infection with indicated AVs. Shaded area represents the GLuc background activity. h Total fold change in blood-GLuc activity over the course of tumor development. P-values from Tukey’s multiple comparisons test. i Time point when blood-GLuc activity reached its maximum. P-value from an unpaired, two-sided t-test. j Time difference between the time of sacrifice (survival) and the time point when blood-GLuc activity was first elevated, i.e. exceeded the background range. k Correlation between time of sacrifice (survival) and the time point when blood-GLuc activity was first elevated. Shown is the linear regression with 95% confidence interval All error bars indicate SD, all data points represent biological replicates/individual mice
Fig. 7
Fig. 7
Rbl2 co-mutations accelerate SCLC tumorigenesis. a Sequential MRI of a representative AV-PR.Cre and AV-PRL.Cre infected mouse illustrating different kinetics of tumorigenesis. Shown are frontal and transversal sections with tumors marked in color. b Histological analysis of AV-PR.Cre and AV-PRL.Cre induced lung tumors. Shown are representative H&E and immunohistochemical stains for Cas9, GLuc and NE lineage markers (Ascl1, Synaptophysin, Chromogranin). c Quantitative analysis of SCLC tumor burden, tumor number and tumor size in AV-PR.Cre (n = 12) and AV-PRL.Cre (n = 17) infected mice. Shown is mean ± SD and P-values from unpaired, two-sided t-tests. d Trp53, Rb1 and Rbl2 mutation spectra of single tumors from 5 different mice of each group. Top graph, shown is the frequency of wild-type and mutant reads. For mutant reads, all mutations with a frequency of > 5% are color-coded as deletions or insertions and labelled with the number of deleted, inserted or substituted base pairs. Less frequent mutations are summarized as ‘others’. Bottom graph, shown is the size distribution of indel mutations for each tumor. The frequency of each indel mutations is encoded in grayscale

References

    1. George J, Lim JS, Jang SJ, Cun Y, Ozretic L, Kong G, et al. Comprehensive genomic profiles of small cell lung cancer. Nature. 2015;524:47–53. doi: 10.1038/nature14664. - DOI - PMC - PubMed
    1. Gridelli C, Rossi A, Carbone DP, Guarize J, Karachaliou N, Mok T, Petrella F, Spaggiari L, Rosell R. Non-small-cell lung cancer. Nat Rev Dis Primers. 2015;1:15009. doi: 10.1038/nrdp.2015.9. - DOI - PubMed
    1. Kwon MC, Berns A. Mouse models for lung cancer. Mol Oncol. 2013;7:165–177. doi: 10.1016/j.molonc.2013.02.010. - DOI - PMC - PubMed
    1. Mascaux C, Angelova M, Vasaturo A, Beane J, Hijazi K, Anthoine G, et al. Immune evasion before tumour invasion in early lung squamous carcinogenesis. Nature. 2019;571:570–575. doi: 10.1038/s41586-019-1330-0. - DOI - PubMed
    1. Guerin MV, Finisguerra V, Van den Eynde BJ, Bercovici N, Trautmann A. Preclinical murine tumor models: a structural and functional perspective. Elife. 2020;9:e50740. doi: 10.7554/eLife.50740. - DOI - PMC - PubMed

Publication types