. 2022 Sep 20:2022:2213503.
doi: 10.1155/2022/2213503. eCollection 2022.

Mitochondria-Targeted Antioxidant Mitoquinone Maintains Mitochondrial Homeostasis through the Sirt3-Dependent Pathway to Mitigate Oxidative Damage Caused by Renal Ischemia/Reperfusion

Affiliations

Mitochondria-Targeted Antioxidant Mitoquinone Maintains Mitochondrial Homeostasis through the Sirt3-Dependent Pathway to Mitigate Oxidative Damage Caused by Renal Ischemia/Reperfusion

Hu Mao et al. Oxid Med Cell Longev. .

Abstract

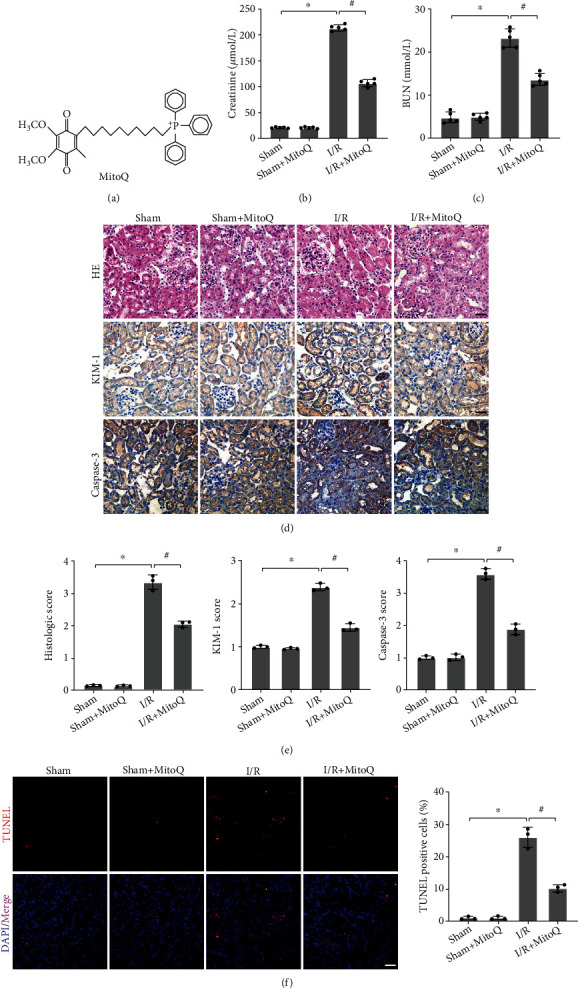
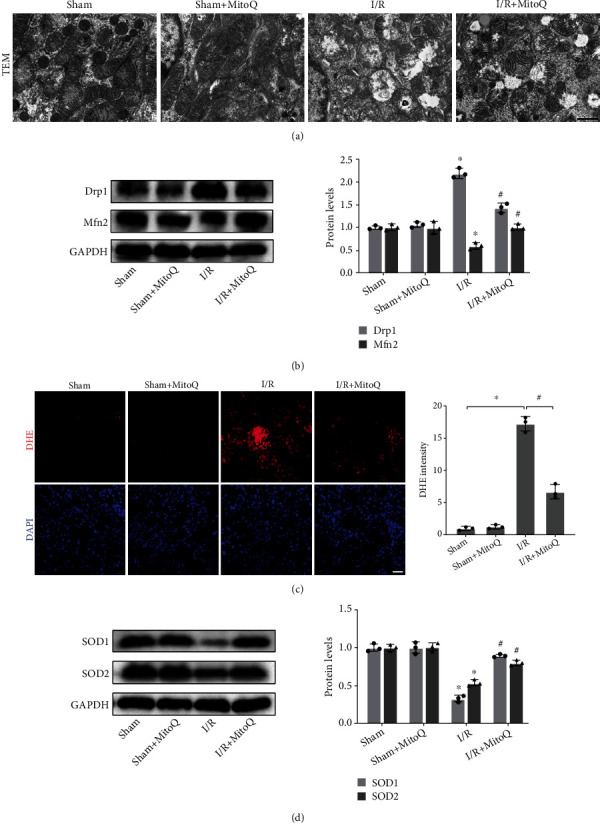
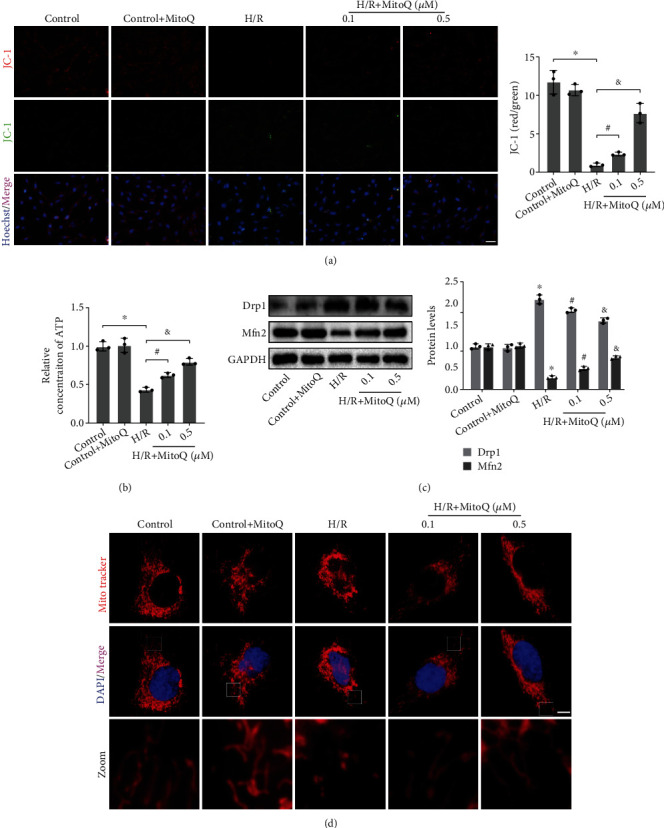
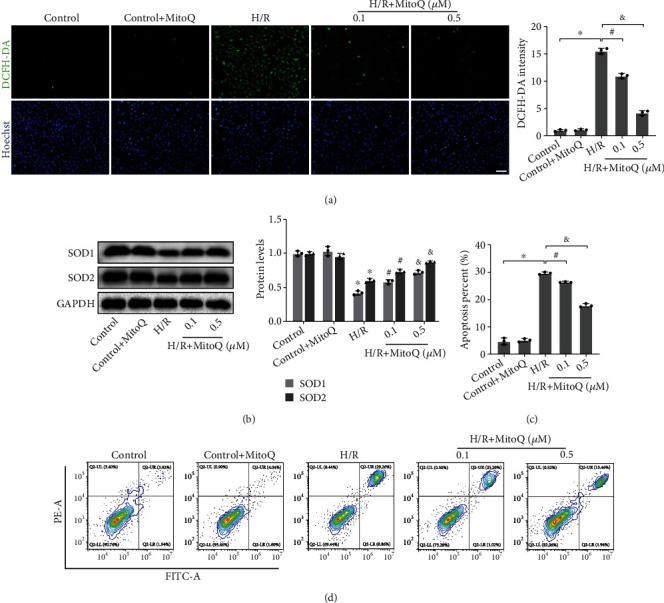
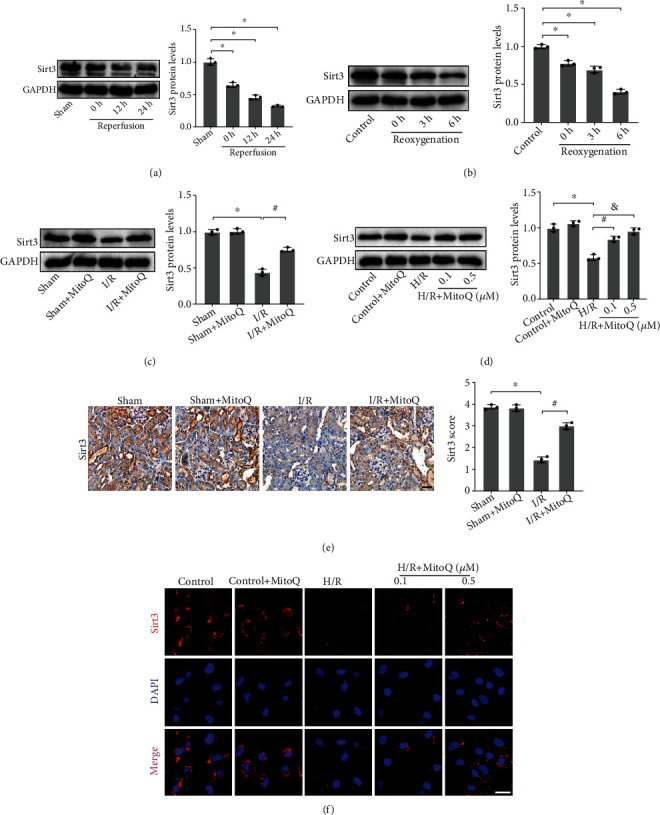
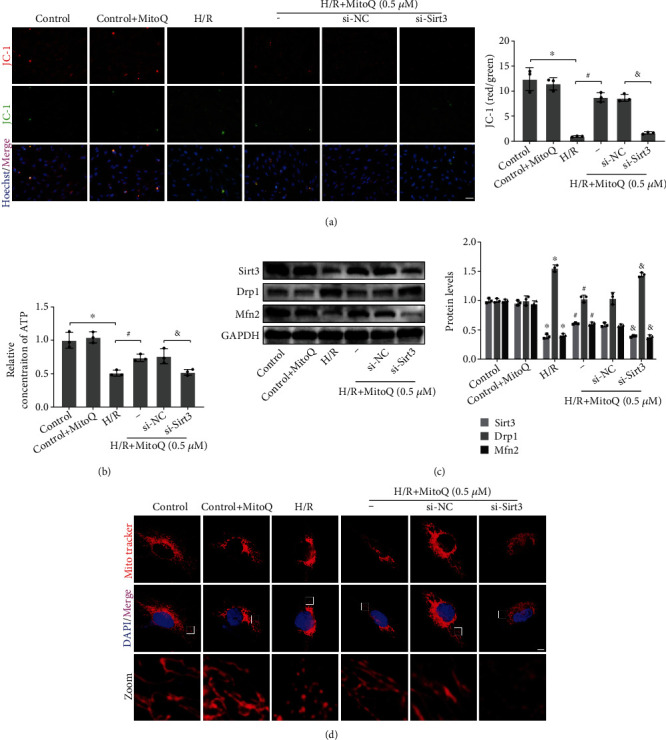
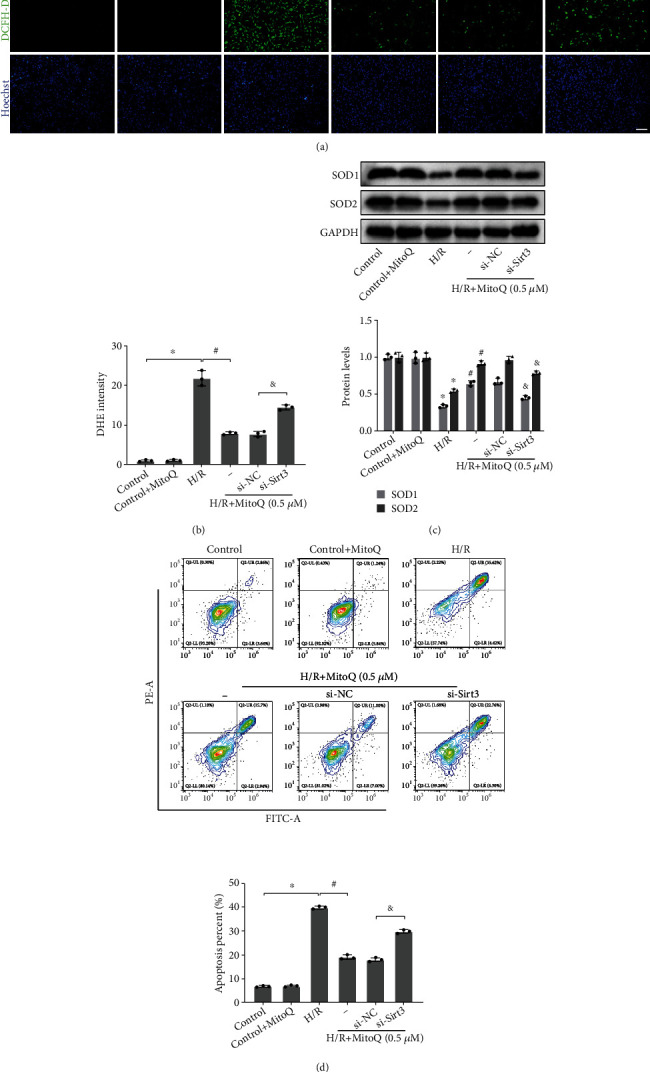
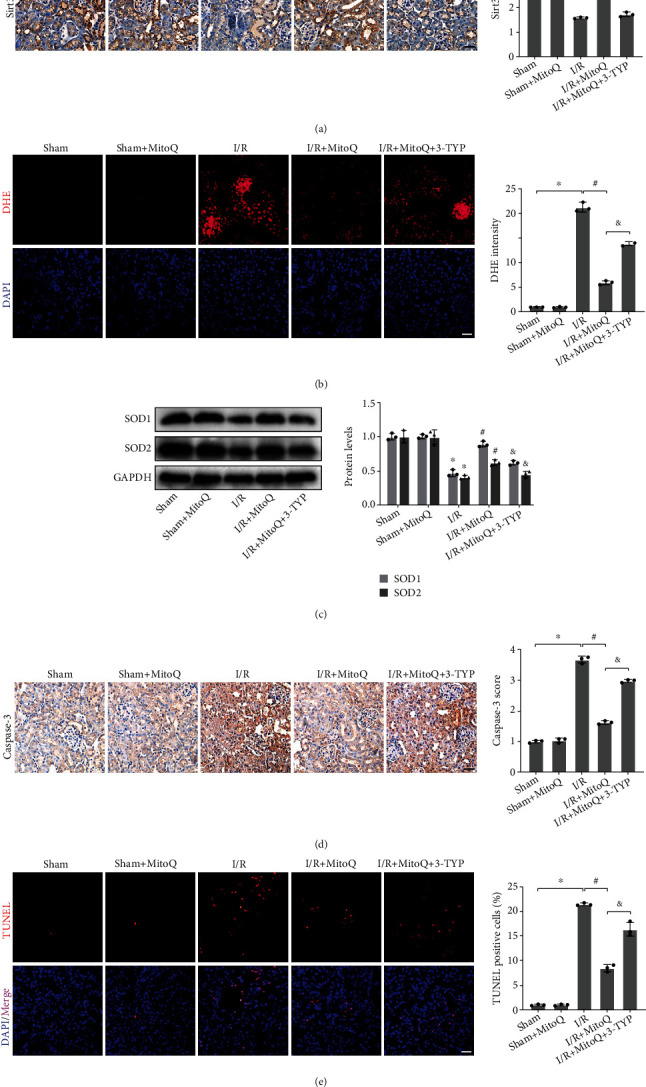
Mitochondrial dysfunction is a critical factor contributing to oxidative stress and apoptosis in ischemia-reperfusion (I/R) diseases. Mitoquinone (MitoQ) is a mitochondria-targeted antioxidant whose potent anti-I/R injury capacity has been demonstrated in organs such as the heart and the intestine. In the present study, we explored the role of MitoQ in maintaining mitochondrial homeostasis and attenuating oxidative damage in renal I/R injury. We discovered that the decreased renal function and pathological damage caused by renal I/R injury were significantly ameliorated by MitoQ. MitoQ markedly reversed mitochondrial damage after I/R injury and inhibited renal reactive oxygen species production. In vitro, hypoxia/reoxygenation resulted in increased mitochondrial fission and decreased mitochondrial fusion in human renal tubular epithelial cells (HK-2), which were partially prevented by MitoQ. MitoQ treatment inhibited oxidative stress and reduced apoptosis in HK-2 cells by restoring mitochondrial membrane potential, promoting ATP production, and facilitating mitochondrial fusion. Deeply, renal I/R injury led to a decreased expression of sirtuin-3 (Sirt3), which was recovered by MitoQ. Moreover, the inhibition of Sirt3 partially eliminated the protective effect of MitoQ on mitochondria and increased oxidative damage. Overall, our data demonstrate a mitochondrial protective effect of MitoQ, which raises the possibility of MitoQ as a novel therapy for renal I/R.


Conflict of interest statement

The authors declare no conflict of interest.

Figures

Figure 1
Figure 1
MitoQ ameliorated renal I/R injury in mice. (a) The chemical structure diagram of MitoQ. (b and c) Mice renal function assays including serum creatinine (Cr) and urea nitrogen (BUN). (d and e) Representative images of H&E staining and immunohistochemistry of KIM-1 and Caspase-3 in mice kidney tissues (×400, scale bar = 20 μm) and related quantitative analysis. (f) TUNEL assay to assess the level of apoptosis in kidney cells and their quantitative analysis (×400, scale bar = 20 μm). Values are expressed as mean ± SEM. n = 3 − 5. p < 0.05 compared with the Sham group, #p < 0.05 compared with the I/R group.
Figure 2
Figure 2
MitoQ attenuated mitochondrial damage and inhibited renal oxidative stress after renal I/R in mice. (a) Transmission electron microscopy (TEM) observation of mitochondrial morphology in renal tubular epithelial cells (×8000, scale bar = 1 μm). (b) Western blot detection of Drp1 and Mfn2 protein expression, quantitative analysis expressed as the relative level with the Sham group. (c) Dihydroethidium (DHE) staining to assess renal oxidation levels and their quantitative analysis (×400, scale bar = 20 μm). (d) Western blot detection of SOD1 and SOD2 protein expression, quantitative analysis expressed as the relative level with the Sham group. Values are expressed as mean ± SEM. n = 3. p < 0.05 compared with the Sham group, #p < 0.05 compared with the I/R group.
Figure 3
Figure 3
MitoQ restored mitochondrial homeostasis after H/R in HK-2 cells. (a) JC-1 assay of mitochondrial membrane potential in HK-2 cells (×200, scale bar = 50 μm), quantitative analysis expressed as the ratio of JC-1 aggregates (red fluorescence) to JC-1 monomers (green fluorescence). (b) Relative ATP concentration in HK-2 cells. (c) Western blot detection of Drp1 and Mfn2 protein expression, quantitative analysis expressed as the relative level with the control group. (d) Mitochondrial morphology of Mito Tracker Red CMXRos-labeled HK-2 cells (×1000, scale bar = 5 μm). Values are expressed as mean ± SEM. n = 3. p < 0.05 compared with the control group, #p < 0.05 and &p < 0.05 compared with the H/R group.
Figure 4
Figure 4
MitoQ inhibited oxidative stress and apoptosis in HK-2 cells. (a) Dichlorodihydrofluorescein diacetate (DCFH-DA) assessment of reactive oxygen species levels in HK-2 cells and their quantitative analysis (×100, scale bar = 100 μm). (b) Western blot detection of SOD1 and SOD2 protein expression, quantitative analysis expressed as the relative level with the control group. (c and d) Flow cytometry detection of HK-2 cell apoptosis rate and their quantitative analysis. Values are expressed as mean ± SEM. n = 3. p < 0.05 compared with the control group, #p < 0.05 and &p < 0.05 compared with the H/R group.
Figure 5
Figure 5
MitoQ significantly recovered the underexpression of Sirt3 resulted from I/R or H/R. (a and b) Western blotting to detect the effect of different reperfusion time or different reoxygenation time on the protein expression of Sirt3 and related quantitative analysis. (c and d) Western blotting to detect the effect of MitoQ on the protein expression of Sirt3, and related quantitative analysis. (e) Representative immunohistochemical pictures of Sirt3 in mice kidney tissue (×400, scale bar = 20 μm) and related quantitative analysis. (f) Representative images of immunofluorescence of Sirt3 in HK-2 cells (×400, scale bar = 20 μm). Values are expressed as mean ± SEM. n = 3. p < 0.05 compared with the Sham or the control group, #p < 0.05 and &p < 0.05 compared with the I/R or the H/R group.
Figure 6
Figure 6
si-Sirt3 partially eliminated the mitochondrial protective effect of MitoQ on HK-2 cells. (a) JC-1 assay of mitochondrial membrane potential in HK-2 cells (×200, scale bar = 50 μm), quantitative analysis expressed as the ratio of JC-1 aggregates (red fluorescence) to JC-1 monomers (green fluorescence). (b) Relative ATP concentration in HK-2 cells. (c) Western blot detection of Sirt3, Drp1, and Mfn2 protein expression, quantitative analysis expressed as the relative level with the control group. (d), Mitochondrial morphology of Mito Tracker Red CMXRos-labeled HK-2 cells (×1000, scale bar = 5 μm). Values are expressed as mean ± SEM. n = 3. p < 0.05 compared with the control group, #p < 0.05 compared with the H/R group, and &p < 0.05 compared with the H/R+MitoQ+si-NC group.
Figure 7
Figure 7
si-Sirt3 fractionally abrogated the ability of MitoQ to attenuate oxidative damage in HK-2 cells. (a and b) Dichlorodihydrofluorescein diacetate (DCFH-DA) assessment of reactive oxygen species levels in HK-2 cells and their quantitative analysis (×100, scale bar = 100 μm). (c) Western blot detection of SOD1 and SOD2 protein expression, quantitative analysis expressed as the relative level with the control group.(d) Flow cytometry assay of apoptosis rate in HK-2 cells and their quantitative analysis. Values are expressed as mean ± SEM. n = 3. p < 0.05 compared with the control group, #p < 0.05 compared with the H/R group, and &p < 0.05 compared with the H/R+MitoQ+si-NC group.
Figure 8
Figure 8
The Sirt3 selective inhibitor, 3-TYP, reversed the effect of MitoQ on inhibition of oxidative stress and apoptosis in mice kidney. (a) Immunohistochemical representative images of Sirt3 protein in mice kidney tissue (×400, scale bar = 20 μm) and their quantitative analysis. (b) Dihydroethidium (DHE) staining to assess kidney oxidation levels (×400, scale bar = 20 μm) and their quantitative analysis. (c) Western blot detection of SOD1 and SOD2 protein expression, quantitative analysis expressed as the relative level with the Sham group. (d) Immunohistochemical representative images of Caspase-3 protein in mice kidney tissue (×400, scale bar = 20 μm) and their quantitative analysis. (e) TUNEL assay to assess renal apoptosis levels (×400, scale bar = 20 μm) and their quantitative analysis. Values are expressed as mean ± SEM. n = 3. p < 0.05 compared with the Sham group, #p < 0.05 compared with the I/R group, and &p < 0.05 compared with the I/R+MitoQ group.

Similar articles

Cited by

References

    1. Kellum J. A., Romagnani P., Ashuntantang G., Ronco C., Zarbock A., Anders H. J. Acute kidney injury. Nature Reviews. Disease Primers . 2021;7(1):p. 52. doi: 10.1038/s41572-021-00284-z. - DOI - PubMed
    1. James M. T., Bhatt M., Pannu N., Tonelli M. Long-term outcomes of acute kidney injury and strategies for improved care. Nature Reviews. Nephrology . 2020;16(4):193–205. doi: 10.1038/s41581-019-0247-z. - DOI - PubMed
    1. Chertow G. M., Burdick E., Honour M., Bonventre J. V., Bates D. W. Acute kidney injury, mortality, length of stay, and costs in hospitalized patients. Journal of the American Society of Nephrology . 2005;16(11):3365–3370. doi: 10.1681/ASN.2004090740. - DOI - PubMed
    1. Zuk A., Bonventre J. V. Acute kidney injury. Annual Review of Medicine . 2016;67(1):293–307. doi: 10.1146/annurev-med-050214-013407. - DOI - PMC - PubMed
    1. Bhargava P., Schnellmann R. G. Mitochondrial energetics in the kidney. Nature Reviews. Nephrology . 2017;13(10):629–646. doi: 10.1038/nrneph.2017.107. - DOI - PMC - PubMed

MeSH terms