. 2022 Sep 19:2022:3639302.
doi: 10.1155/2022/3639302. eCollection 2022.

The E3 Ubiquitin Ligase SYVN1 Plays an Antiapoptotic Role in Polycystic Ovary Syndrome by Regulating Mitochondrial Fission

Affiliations

The E3 Ubiquitin Ligase SYVN1 Plays an Antiapoptotic Role in Polycystic Ovary Syndrome by Regulating Mitochondrial Fission

Lihua Sun et al. Oxid Med Cell Longev. .

Abstract

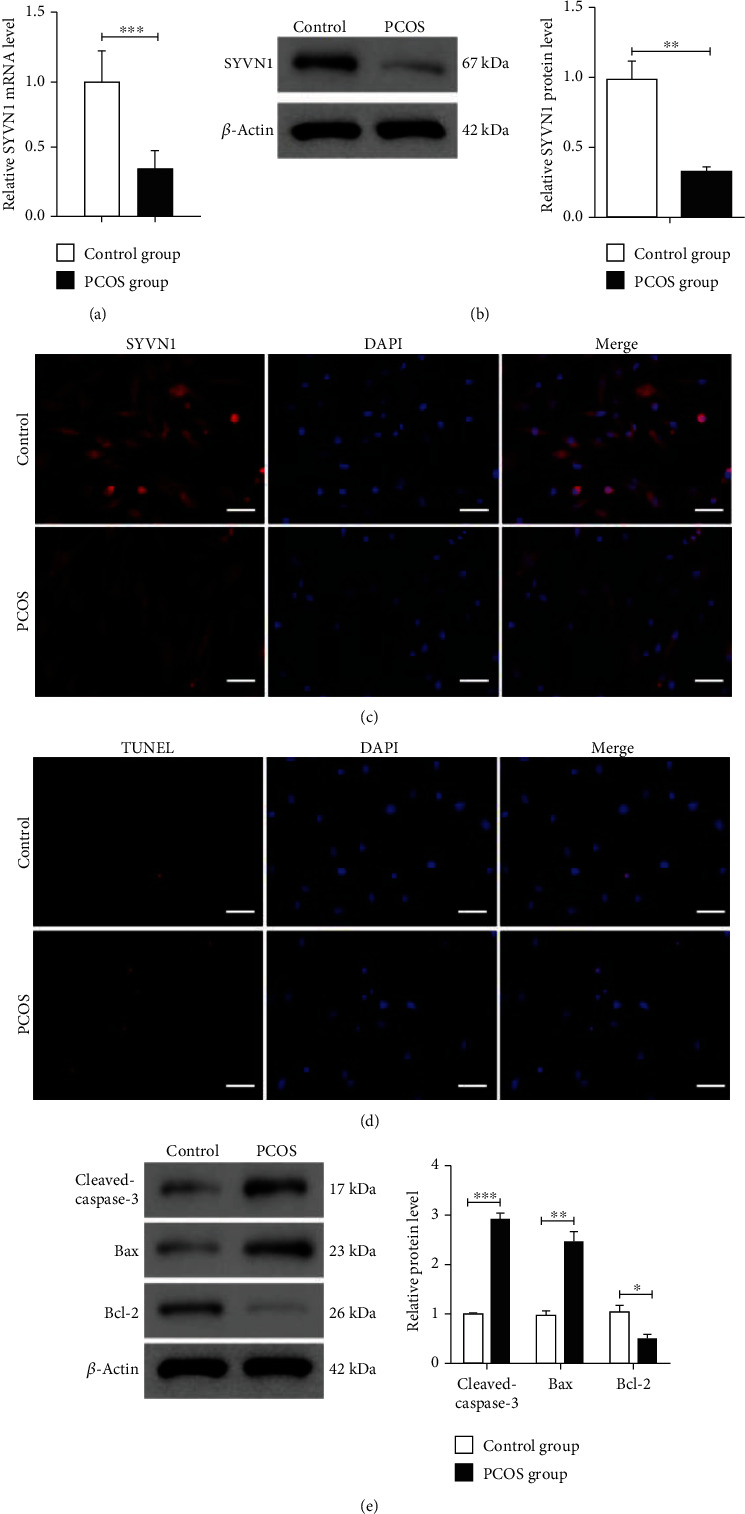
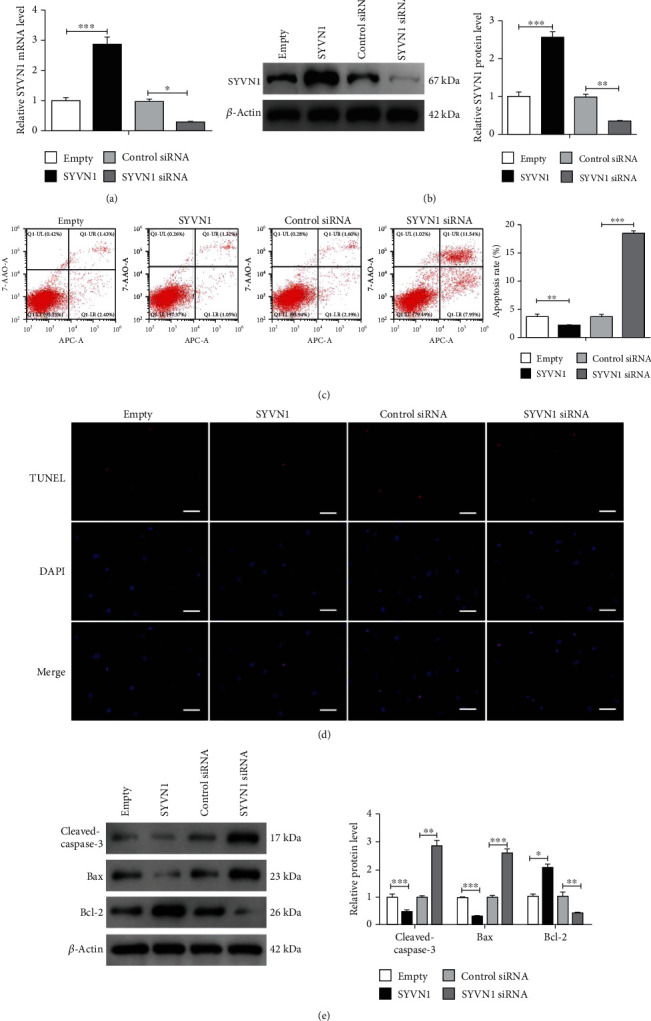
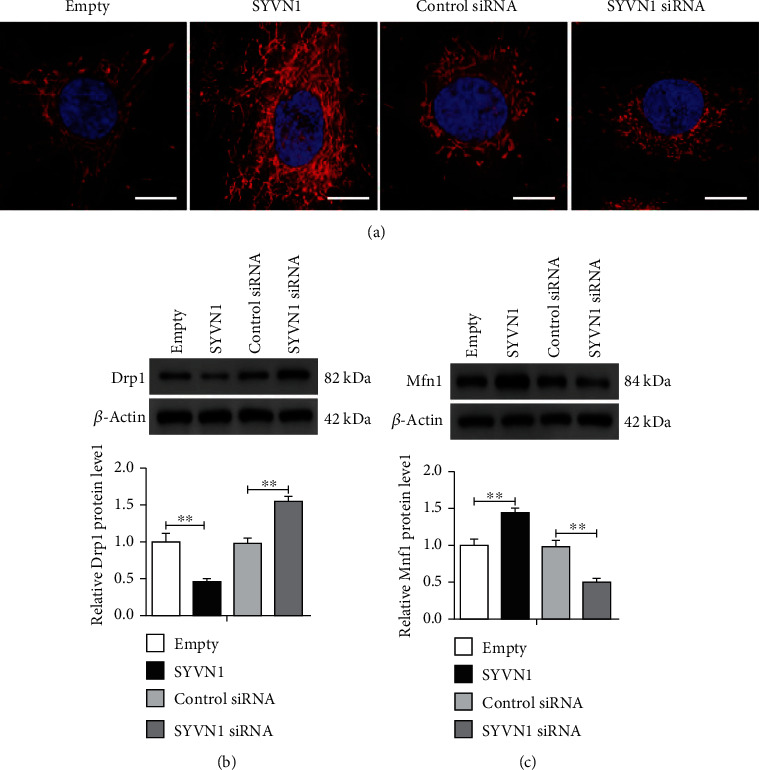
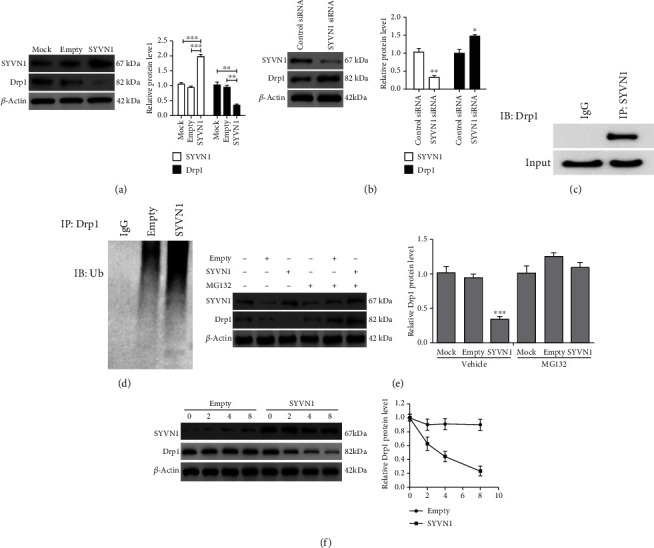
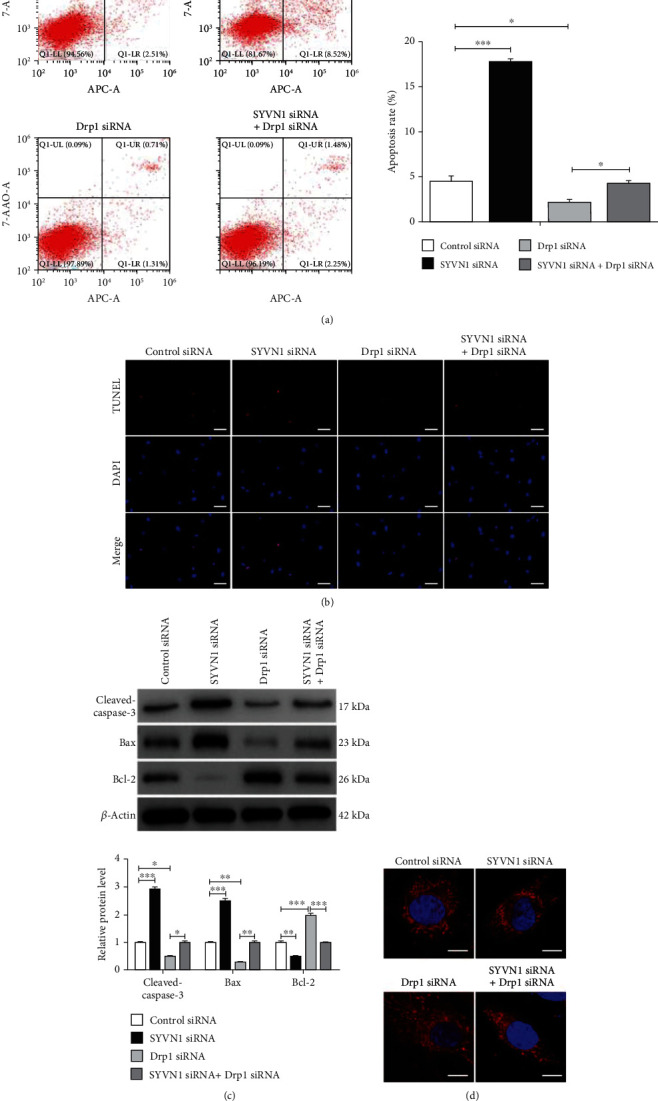
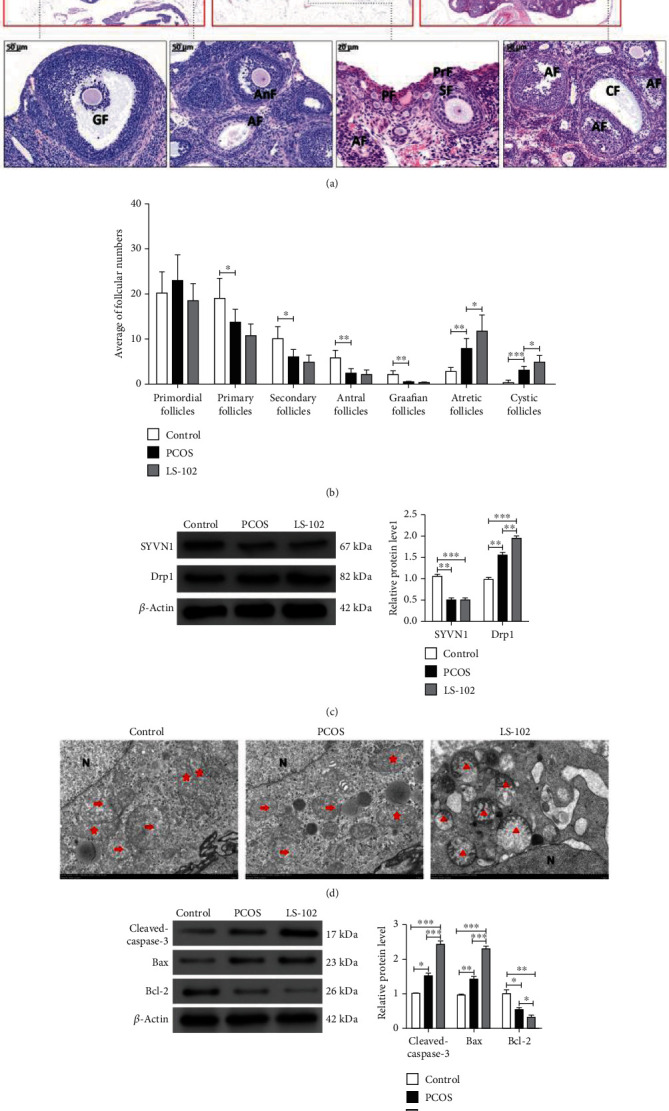
Polycystic ovary syndrome (PCOS) is one of the most common hormonal disorders among premenopausal women. PCOS is accompanied by many other reproductive, endocrinal, and metabolic disorders thus amassing the difficulties encountered by the women affected. However, there is limited information on its molecular etiology. Synoviolin (SYVN1) is an E3 ubiquitin ligase that is thought to participate in the pathology of PCOS. However, the expression and function of SYVN1 in PCOS are unknown. In this study, we found that downregulation of SYVN1 expression was followed by increased apoptosis in the granulosa cells (GCs) of patients with PCOS. Subsequent in vitro experiments indicated that the overexpression of SYVN1 inhibited apoptosis and mitochondrial fission. Furthermore, using immunoprecipitation and western blotting, we identified that SYVN1 promoted the degradation of Drp1 via the proteasome-dependent pathway. Additionally, we generated a PCOS model in female Sprague Dawley rats and treated them with an SYVN1 inhibitor, LS-102. We observed that the inhibition of SYVN1 increased Drp1 levels and exacerbated the degeneration of GCs in the PCOS rat model. Finally, in vitro and in vivo experiments showed that SYVN1 inhibits apoptosis and mitochondrial fission by promoting Drp1 degradation in GCs. These results highlight the function of SYVN1 in PCOS and provide a potential target for the clinical treatment of PCOS.


Conflict of interest statement

The authors declare that they have no competing interests.

Figures

Figure 1
Figure 1
Downregulated SYVN1 is potentially associated with massive apoptosis in granulosa cells of PCOS patients. (a) The mRNA expression of SYVN1 was detected by RT-qPCR (n = 30). ∗∗∗P < 0.001, two-tailed unpaired Student's t-test. P < 0.0001, t = 13.43, and df = 58. (b) The protein levels of SYVN1 were detected by western blotting (n = 5). ∗∗P < 0.01, two-tailed unpaired Student's t-test. P = 0.0011, t = 4.997, and df = 8. (c) The expression of SYVN1 was detected by immunofluorescence. Red staining indicates SYVN1, and blue staining indicates the nucleus (DAPI). Scale bar = 50 μm. (d) Granulosa cell apoptosis was detected by TUNEL. Scale bar = 50 μm. (e) Protein expression of cleaved-caspase-3, Bax, and Bcl-2 of ovarian granulosa cells in each group was detected by western blotting. (control: patients undergoing fertility treatment due to male infertility or tubal infertility disorders; PCOS, patients with polycystic ovary syndrome). The data are expressed as mean ± standard deviation. (n = 4) P < 0.05, ∗∗P < 0.01, and ∗∗∗P < 0.001. Two-tailed unpaired Student's t-test. Cleaved-caspase-3: P < 0.0001, t = 16.64, and df = 6; Bax: P = 0.0011, t = 5.836, and df = 6; Bcl-2: P = 0.0100, t = 3.705, and df = 6.
Figure 2
Figure 2
Overexpression of SYVN1 inhibited apoptosis in KGN cells. KGN cells were transfected with empty, SYVN1, control siRNA, or SYVN1 siRNA plasmids for 24 h. (a, b) RT-qPCR and western blot analysis for SYVN1 to test the transfection efficiency for SYVN1 overexpression or inhibition. P < 0.05, ∗∗P < 0.01, and ∗∗∗P < 0.001. One-way ANOVA with Tukey's multiple comparison test. (a) F (3, 8) = 65.04, P < 0.0001. Pempty vs.SYVN1 < 0.0001, Pcontrol siRNA vs.SYVN1 siRNA = 0.0319; (b) F (3, 8) = 89.42, P < 0.0001. Pempty vs.SYVN1 < 0.0001, Pcontrol siRNA vs.SYVN1 siRNA = 0.0083. (c) Apoptosis of KGN cells in each group was detected by flow cytometry. Cartogram of apoptosis of KGN cells in each group. ∗∗P < 0.01 and ∗∗∗P < 0.001. One-way ANOVA with Tukey's multiple comparison test. F (3, 8) = 593.1, P < 0.0001. Pempty vs.SYVN1 = 0.0017, Pcontrol siRNA vs.SYVN1 siRNA < 0.0001. (d) Apoptosis of KGN cells in each group was measured by TUNEL staining. Scale bar = 50 μm. (e) Protein expression of cleaved-caspase-3, Bax, and Bcl-2 in ovarian granulosa cells from each group was detected by western blotting. The data are expressed as mean ± standard deviation. P < 0.05, ∗∗P < 0.01, and ∗∗∗P < 0.001. One-way ANOVA with Tukey's multiple comparison test. Cleaved-caspase-3: F (3, 8) = 65.81, P < 0.0001. Pempty vs.SYVN1 < 0.0001, Pcontrol siRNA vs.SYVN1 siRNA = 0.0078; Bax: F (3, 8) = 118.6, P < 0.0001. Pempty vs.SYVN1 < 0.0001, Pcontrol siRNA vs.SYVN1 siRNA = 0.0027; Bcl-2: F (3, 8) = 34.73, P < 0.0001. Pempty vs.SYVN1 = 0.0279, Pcontrol siRNA vs.SYVN1 siRNA = 0.0011.
Figure 3
Figure 3
Overexpression of SYVN1 inhibited mitochondrial fission in KGN cells. KGN cells were transfected with empty, SYVN1, control siRNA, or SYVN1 siRNA plasmids for 24 h. (a) Imaging of mitochondrial morphology in each group by confocal microscopy using MitoTracker Red. Scale bar = 10 μm. (b, c) Protein expression of Drp1 and Mfn1 in each group was detected by western blotting. The data are expressed as mean ± standard deviation. ∗∗P < 0.01. One-way ANOVA with Tukey's multiple comparison test. (b) F (3, 8) = 34.15, P < 0.0001. Pempty vs.SYVN1 = 0.0042, Pcontrol siRNA vs.SYVN1 siRNA = 0.0032; (c) F (3, 8) = 31.44, P < 0.0001. Pempty vs.SYVN1 = 0.0090, Pcontrol siRNA vs.SYVN1 siRNA = 0.0045.
Figure 4
Figure 4
SYVN1 controls ubiquitination and proteasomal degradation of Drp1 in KGN cells. (a) KGN cells were either transfected or not transfected with empty or SYVN1 overexpression plasmids, and western blotting was performed to examine protein expression of SYVN1 and Drp1 (n = 3). ∗∗P < 0.01 and ∗∗∗P < 0.001. One-way ANOVA with Tukey's multiple comparison test. SYVN1: F (2, 6) = 75.35, P < 0.0001. PMock vs.SYVN1 = 0.0001, Pempty vs.SYVN1 < 0.0001; Drp1: F (2, 6) = 24.44, P = 0.0013. PMock vs.SYVN1 = 0.0017, Pempty vs.SYVN1 = 0.0031. (b) Western blot analysis of the expression of SYVN1 and Drp1 in KGN cells transfected with control siRNA or SYVN1 siRNA (n = 3). P < 0.05 and ∗∗P < 0.01. Two-tailed unpaired Student's t-test. SYVN1: P = 0.0049, t = 5.625, df = 4; Drp1: P = 0.0183, t = 3.843, df = 4. (c) SYVN1 binding to Drp1 was detected by immunoprecipitation. (d) Western blotting was used to detect the effect of SYVN1 on Drp1 ubiquitin modification. (e) Western blot analysis of the expression of Drp1 in KGN cells transfected with either empty or SYVN1, in the presence or absence of the proteasome inhibitor MG132 (n = 3). All blots used β-actin as loading controls. ∗∗∗P < 0.001. Two-way ANOVA with Sidak's multiple comparisons test. F (5, 10) = 31.29, P < 0.0001. (f) A cycloheximide (CHX) chase assay was performed to assess the half-life of Drp1. KGN cells were transfected with empty or SYVN1 for 24 h. Cells were then treated with CHX (100 μg/ml) for the indicated hours, and western blotting was performed. Relative Drp1 protein levels in KGN cells were quantified and plotted with the length (days) of CHX treatment on the X axis. The data are expressed as mean ± standard deviation.
Figure 5
Figure 5
SYVN1 inhibited apoptosis and mitochondrial fission by promoting Drp1 degradation in KGN cells. KGN cells were transfected with control siRNA, SYVN1 siRNA, Drp1 siRNA, or SYVN1 siRNA+Drp1 siRNA for 24 h. (a) Apoptosis of KGN cells in each group was detected by flow cytometry. Cartogram of cell apoptosis in each group. P < 0.05 and ∗∗∗P < 0.001. One-way ANOVA with Tukey's multiple comparison test. F (3, 8) = 230.3, P < 0.0001. Pcontrol siRNA vs.SYVN1 siRNA < 0.0001, Pcontrol siRNA vs.Drp1 siRNA = 0.0258, PDrp1 siRNA vs.SYVN1 siRNA = 0.0286. (b) Apoptosis in each group of KGN cells was measured by TUNEL staining. Scale bars are 50 μm. The percentages of TUNEL-positive cells are shown. (c) Protein expression of cleaved-caspase-3, Bax, and Bcl-2 of ovarian granulosa cells in each group. P < 0.05, ∗∗P < 0.01, and ∗∗∗P < 0.001. One-way ANOVA with Tukey's multiple comparison test. Cleaved caspase-3: F (3, 8) = 203.3, P < 0.0001. Pcontrol siRNA vs.SYVN1 siRNA < 0.0001, Pcontrol siRNA vs.Drp1 siRNA = 0.0116, PDrp1 siRNA vs.SYVN1 siRNA = 0.0112; Bax: F (3, 8) = 164.5, P < 0.0001. Pcontrol siRNA vs.SYVN1 siRNA < 0.0001, Pcontrol siRNA vs.Drp1 siRNA = 0.0012, PDrp1 siRNA vs.SYVN1 siRNA = 0.0010; Bcl-2: F (3, 8) = 80.24, P < 0.0001. Pcontrol siRNA vs.SYVN1 siRNA = 0.0072, Pcontrol siRNA vs.Drp1 siRNA < 0.0001, PDrp1 siRNA vs.SYVN1 siRNA < 0.0001. (d) Imaging mitochondrial morphology in each group by confocal microscopy and MitoTracker Red. Scale bars are 10 μm. Changes in mitochondrial morphology were quantified by the ImageJ software. The data are expressed as mean ± standard deviation.
Figure 6
Figure 6
SYVN1 inhibited apoptosis and mitochondrial fission in granulosa cells in rats with polycystic ovary syndrome. Female Sprague Dawley rats were injected subcutaneously with DHEA for 21 days and injected intraperitoneally with saline or SYVN1 inhibitor (LS-102) for 28 days. (a) Ovarian histological staining was performed in each group using H&E. PF: primordial follicles; PrF: primary follicles; SF: secondary follicles; AnF: antral follicles; GF: Graafian follicles; AF: atretic follicles; CF: cystic follicle cysts. (b) Average number of primordial, primary, secondary, antral, Graafian follicles, atretic follicles, and cystic follicles in control, PCOS, and LS-102-treated rats. P < 0.05, ∗∗P < 0.01, and ∗∗∗P < 0.001. One-way ANOVA with Tukey's multiple comparison test. Primordial follicles: F (2, 15) = 1.225, P = 0.3216. Primary follicles: F (2, 15) = 9.075, P = 0.0026. Pcontrol vs.PCOS = 0.0418; secondary follicles: F (2, 15) = 10.45, P = 0.0014. Pcontrol vs.PCOS = 0.0105; antral follicles: F (2, 15) = 14.09, P = 0.0004. Pcontrol vs.PCOS = 0.0011; Graafian follicles: F (2, 15) = 15.42, P = 0.0002. Pcontrol vs.PCOS = 0.0013; atretic follicles: F (2, 15) = 20.01, P < 0.0001. Pcontrol vs.PCOS = 0.0076; cystic follicles: F (2, 15) = 31.56, P < 0.0001. Pcontrol vs.PCOS = 0.0008, PPCOS vs.LS−102 = 0.0155. (c) The protein levels of SYVN1 and Drp1 were detected in each group by western blotting. ∗∗P < 0.01 and ∗∗∗P < 0.001. One-way ANOVA with Tukey's multiple comparison test. SYVN1: F (2, 6) = 21.35, P = 0.0019. Pcontrol vs.PCOS = 0.0032, Pcontrol vs.LS−102 = 0.0031; Drp1: F (2, 6) = 57.77, P = 0.0001. Pcontrol vs.PCOS = 0.0028, Pcontrol vs.LS−102 < 0.0001, PPCOS vs.LS−102 = 0.0061. (d) Representative transmission electron microscopy images of the mitochondrial network in ovarian tissues from each group. Asterisks, arrows, and triangles indicate elongated, intermediate (mid), and fragmented mitochondria, respectively. N: nucleus. Scale bar: 2 mm. (e) Protein expression of cleaved-caspase-3, Bax, and Bcl-2 of ovarian granulosa cells in each group was detected by western blotting. The data are expressed as mean ± standard deviation. P < 0.05, ∗∗P < 0.01, and ∗∗∗P < 0.001. One-way ANOVA with Tukey's multiple comparison test. Cleaved caspase-3: F (2, 6) = 77.00, P < 0.0001. Pcontrol vs.PCOS = 0.0110, Pcontrol vs.LS−102 < 0.0001, PPCOS vs.LS−102 = 0.0005; Bax: F (2, 6) = 147.4, P < 0.0001. Pcontrol vs.PCOS = 0.0024, Pcontrol vs.LS−102 < 0.0001, PPCOS vs.LS−102 < 0.0001; Bcl-2: F (2, 6) = 18.57, P = 0.0027. Pcontrol vs.PCOS = 0.0162, Pcontrol vs.LS−102 < 0.0024, PPCOS vs.LS−102 = 0.0494 (control group: untreated rats; PCOS group: saline was injected through the abdominal cavity of the PCOS model rats. LS-102 group: LS-102 was injected through the abdominal cavity of the PCOS model rats).

Similar articles

Cited by

References

    1. Barthelmess E. K., Naz R. K. Polycystic ovary syndrome: current status and future perspective. Frontiers in Bioscience (Elite Edition) . 2014;6(1):104–119. - PMC - PubMed
    1. Zadeh Modarres S., Heidar Z., Foroozanfard F., Rahmati Z., Aghadavod E., Asemi Z. The effects of selenium supplementation on gene expression related to insulin and lipid in infertile polycystic ovary syndrome women candidate for in vitro fertilization: a randomized, double-blind, placebo-controlled trial. Biological Trace Element Research . 2018;183(2):218–225. doi: 10.1007/s12011-017-1148-2. - DOI - PubMed
    1. Zhang J., Bao Y., Zhou X., Zheng L. Polycystic ovary syndrome and mitochondrial dysfunction. Reproductive Biology and Endocrinology . 2019;17(1):p. 67. doi: 10.1186/s12958-019-0509-4. - DOI - PMC - PubMed
    1. Westermann B. Mitochondrial fusion and fission in cell life and death. Nature Reviews Molecular Cell Biology . 2010;11(12):872–884. doi: 10.1038/nrm3013. - DOI - PubMed
    1. Tilokani L., Nagashima S., Paupe V., Prudent J. Mitochondrial dynamics: overview of molecular mechanisms. Essays in Biochemistry . 2018;62(3):341–360. doi: 10.1042/EBC20170104. - DOI - PMC - PubMed

Substances