. 2023;111(2):1947-1969.
doi: 10.1007/s11071-022-07907-4. Epub 2022 Sep 29.

Systematic description of COVID-19 pandemic using exact SIR solutions and Gumbel distributions

Affiliations

Systematic description of COVID-19 pandemic using exact SIR solutions and Gumbel distributions

J E Amaro. Nonlinear Dyn. 2023.

Abstract

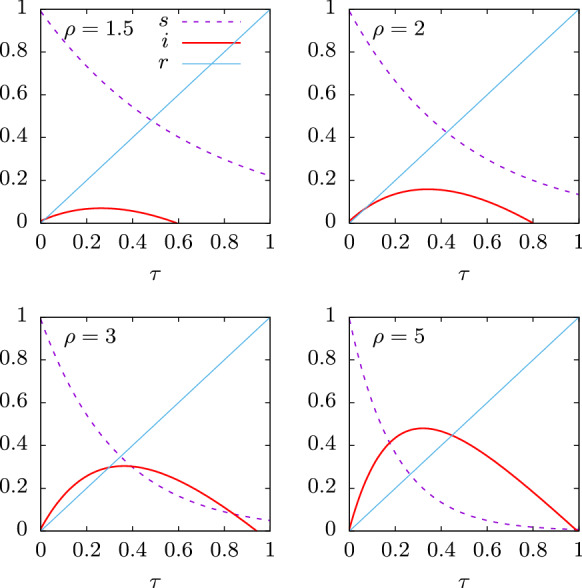
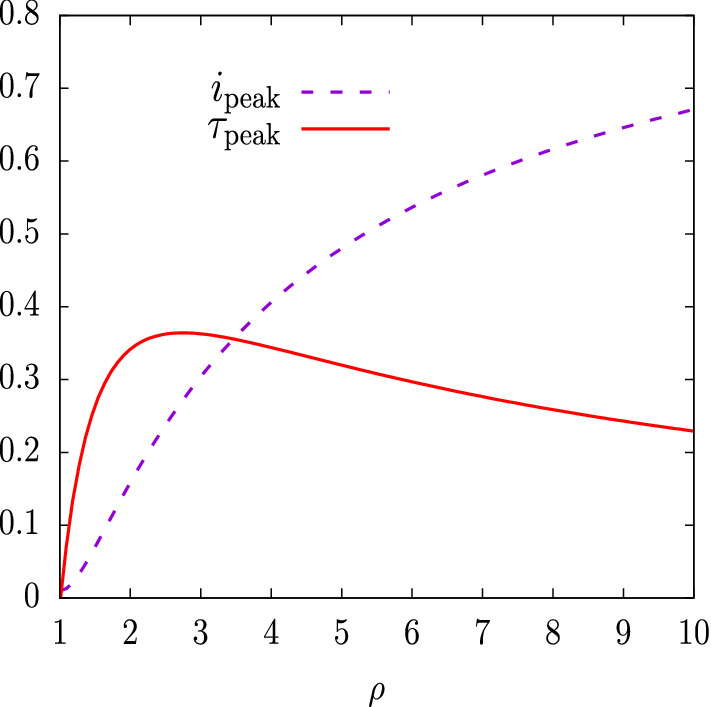
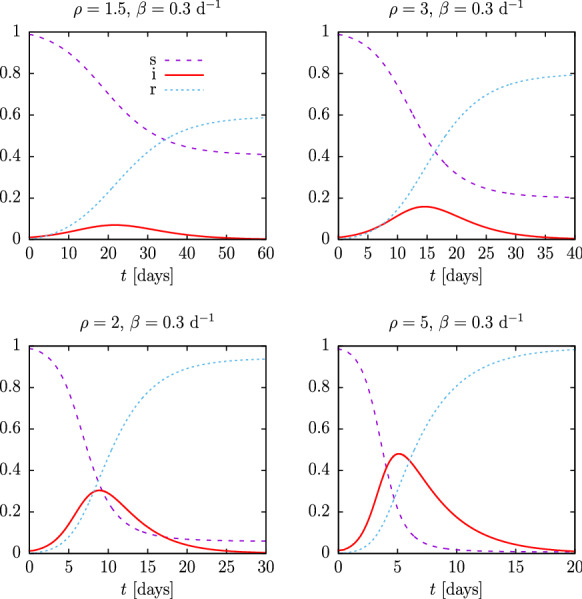
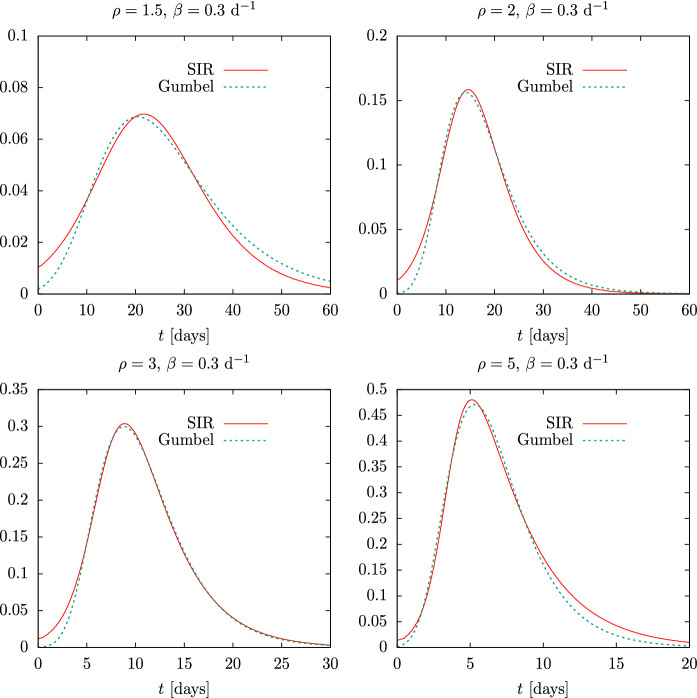
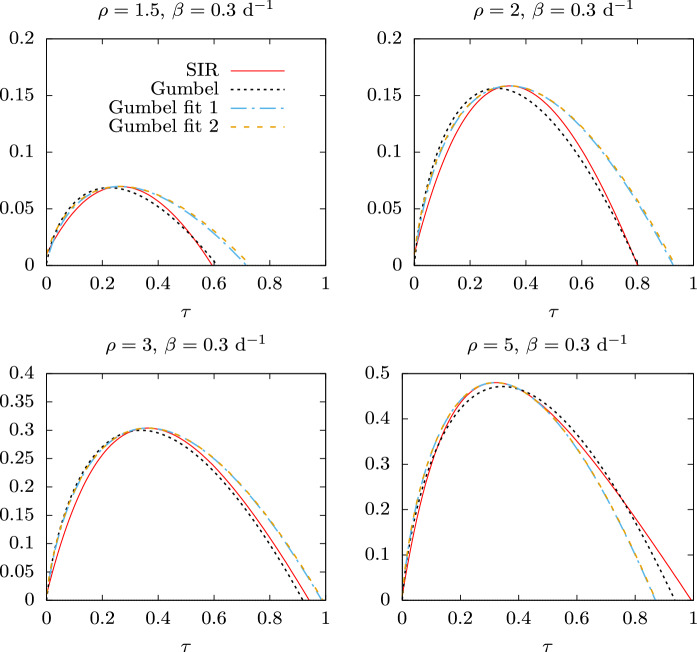
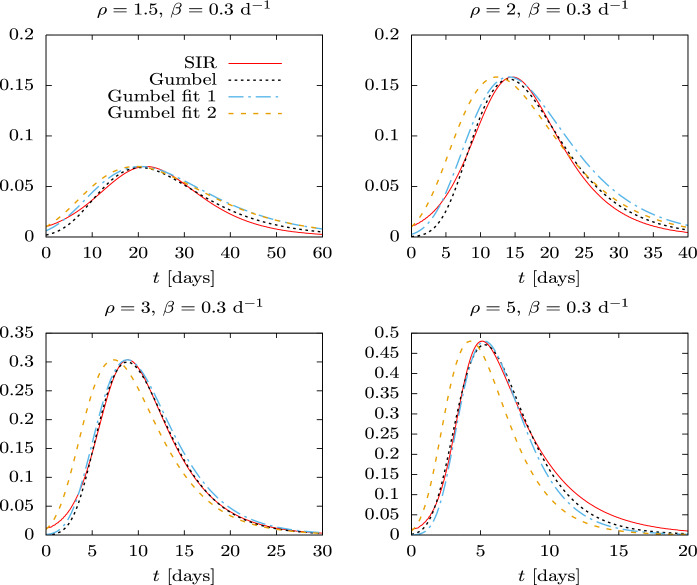
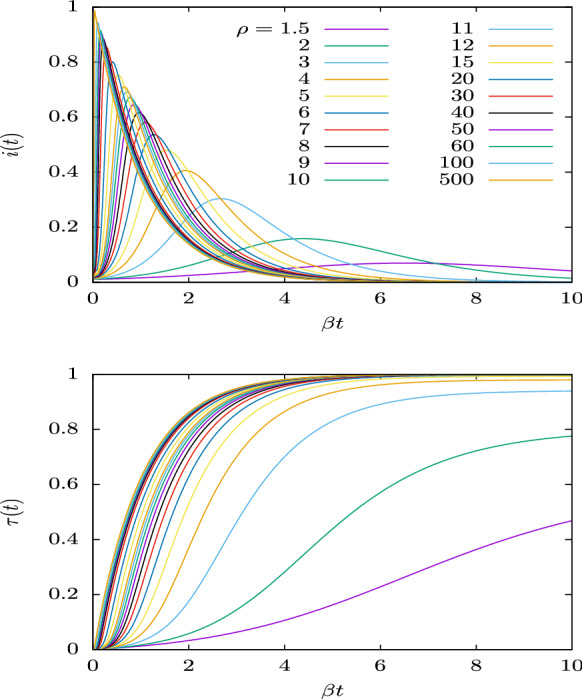
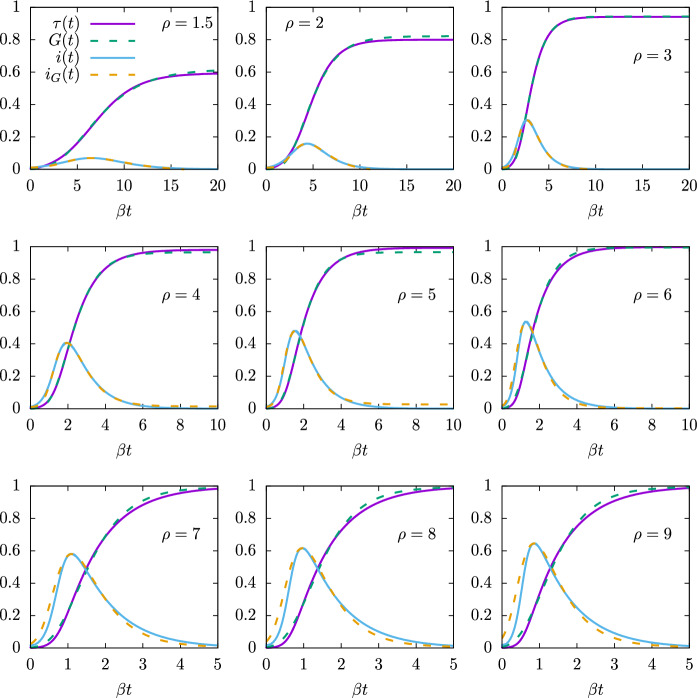
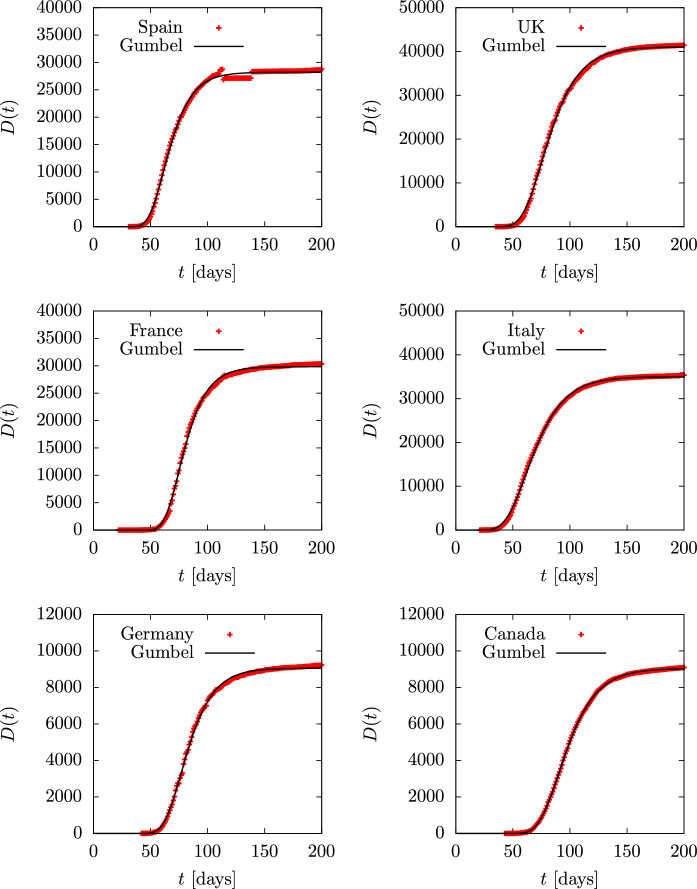
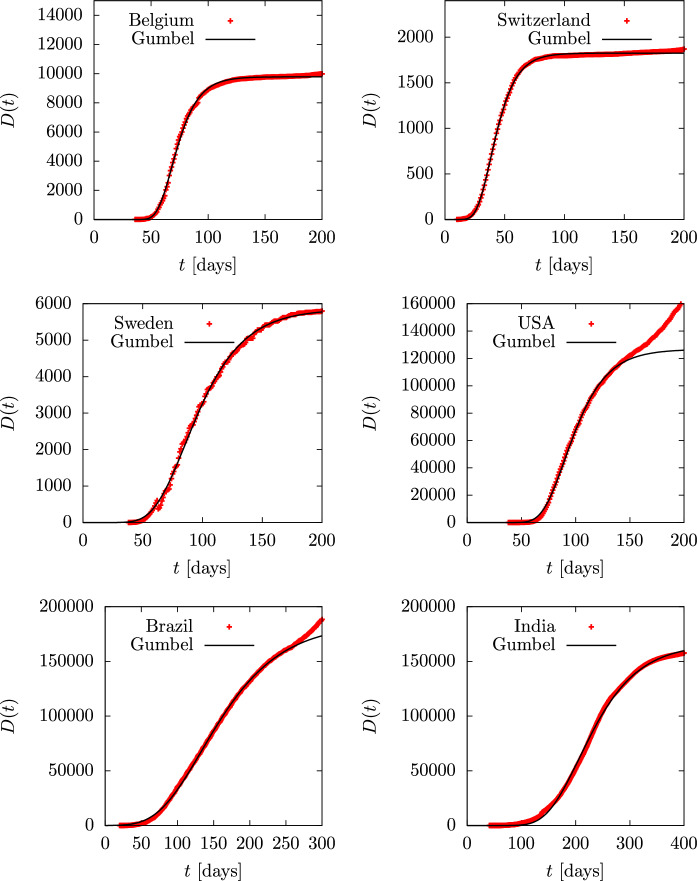
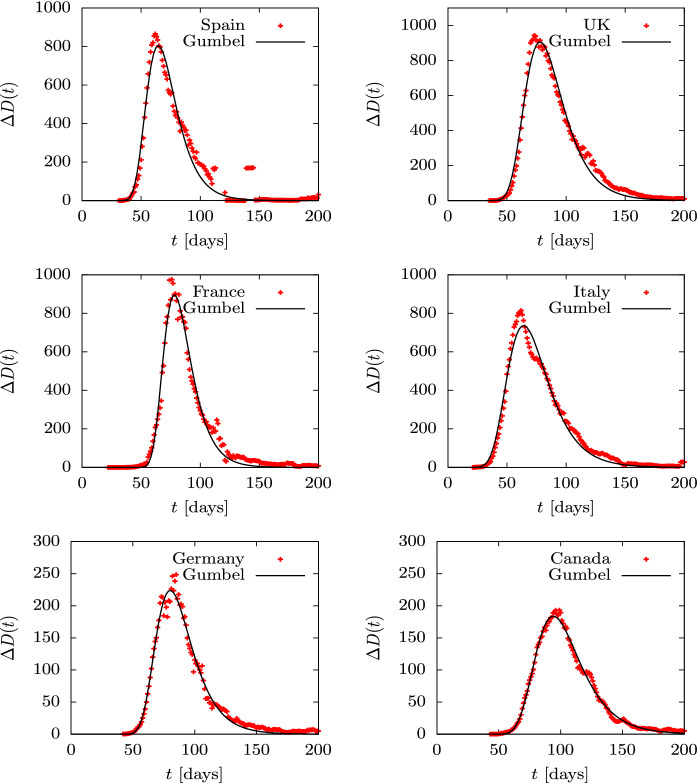
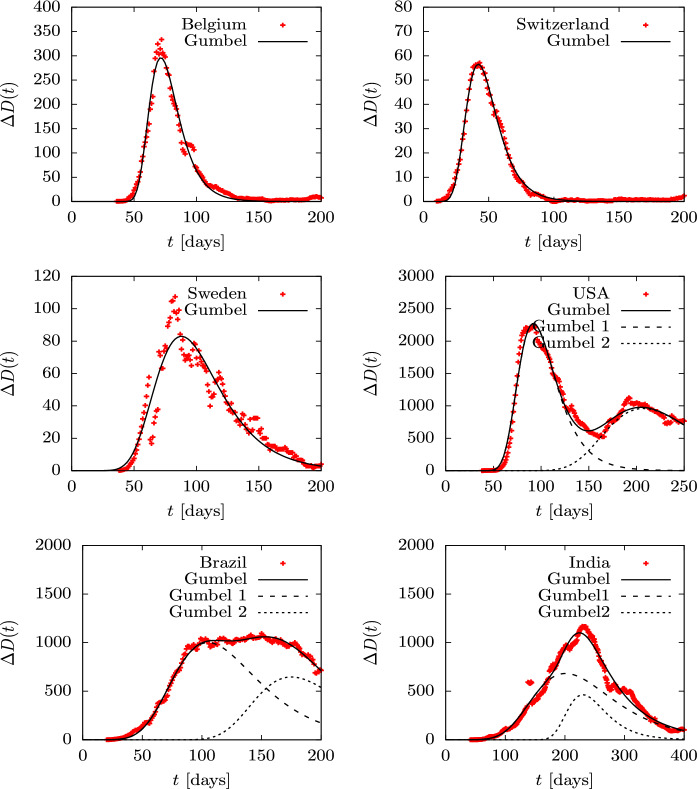
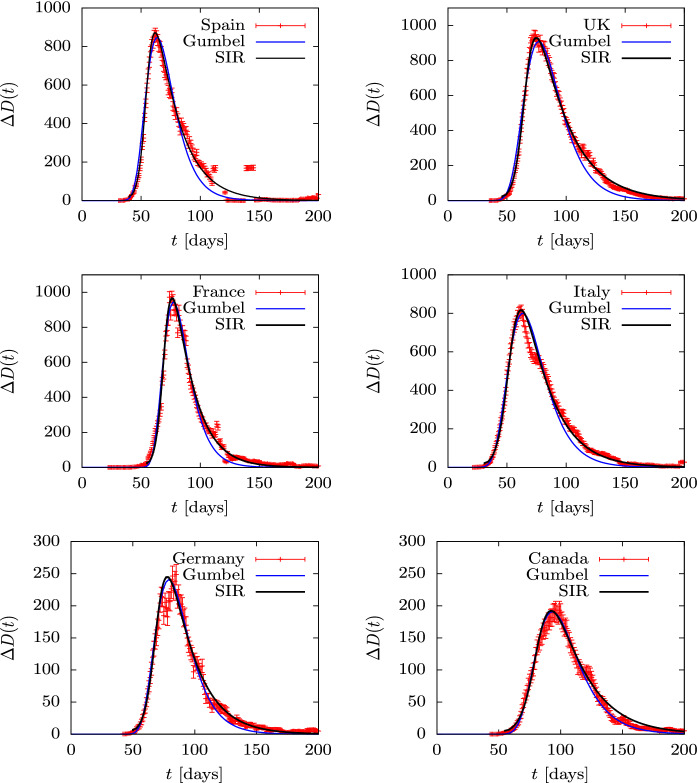
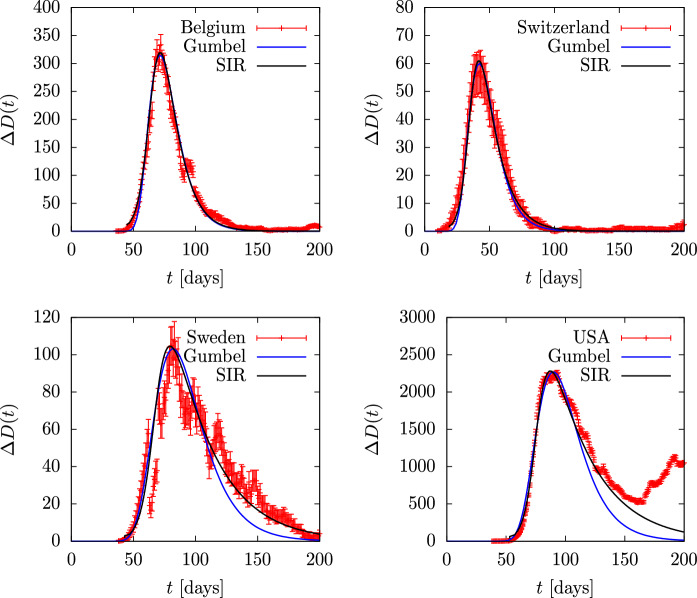
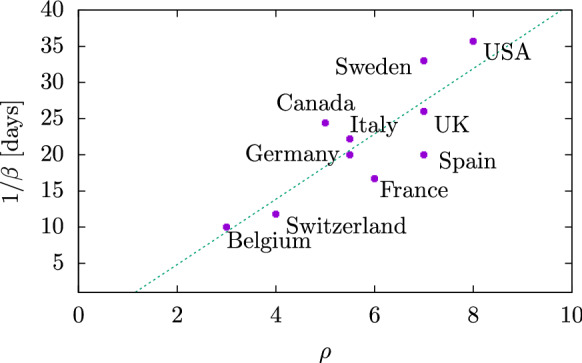
An epidemiological study is carried out in several countries analyzing the first wave of the COVID-19 pandemic using the SIR model and Gumbel distribution. The equations of the SIR model are solved exactly using the proper time as a parameter. The physical time is obtained by integration of the inverse of the infected function over proper time. Some properties of the solutions of the SIR model are studied such as time scaling and the asymmetry, which allows to obtain the basic reproduction number from the data. Approximations to the solutions of the SIR model are studied using Gumbel distributions by least squares fit or by adjusting the maximum of the infected function. Finally, the parameters of the SIR model and the Gumbel function are extracted from the death data and compared for the different countries. It is found that ten of the selected countries are very well described by the solutions of the SIR model, with a basic reproduction number between 3 and 8.

Keywords: COVID-19 coronavirus; Differential equations; Gumbel distribution; SIR model.


Conflict of interest statement

Conflict of interestThe author declare that he has no known competing financial interest or financial relationships that could have appeared to influence the work reported in this paper.

Figures

Fig. 1
Fig. 1
Solution of the SIR equations as a function of proper time τ for initial susceptible s0=0.99 and for several values of the basic reproduction number ρ=R0
Fig. 2
Fig. 2
The peak values of i, τ as a function of the basic reproduction number ρ. For s0=0.99 the peak values are almost independent of s0
Fig. 3
Fig. 3
Solution of the SIR equations as a function of physical time, t, for initial susceptible s0=0.99, for β=0.3d-1, and for several values of the reproduction number ρ=R0
Fig. 4
Fig. 4
Gumbel distribution compared to the exact Solution of the SIR equations for s0=0.99, β=0.3d-1, and for several values of the reproduction number ρ
Fig. 5
Fig. 5
Three Gumbel distributions as a function of the proper time, compared to the exact Solution of the SIR equations for s0=0.99, β=0.3d-1, and for several values of the reproduction number ρ. The parameters of the Gumbel distributions correspond to the mean-square fit, proper-time fit 1 and proper-time fit 2. In proper-time fit 1, the value of t0 is taken from Table 1
Fig. 6
Fig. 6
Three Gumbel distributions compared to the exact Solution of the SIR equations for s0=0.99, β=0.3d-1, and for several values of the basic reproduction number ρ. The parameters of the Gumbel distributions correspond to the mean-square fit, proper-time fit 1 and proper-time fit 2. In proper-time fit 1, the value of t0 is taken from Table 1
Fig. 7
Fig. 7
Solutions of the SIR equations for values of the basic reproduction number ρ from 1.5 to 500. The functions i(t) and τ(t)=r(t) are Plotted as a function of the normalized time βt
Fig. 8
Fig. 8
Solutions of the SIR equations for several values of the basic reproduction number ρ, and for s0=0.99. The functions i(t) and τ(t)=r(t) are plotted as a function of the normalized time βt. These are compared to the approximate solution obtained with a Gumbel function G(t) fitted to τ(t), and with the corresponding infected function iG(t)=1-G(t)-s0exp(-ρG(t)) of the extended SIR model
Fig. 9
Fig. 9
Parameters of the Gumbel function G(t) fitted to τ(t) in Fig. 8. These are compared to the functions a(ρ) and b(ρ) from Eqs. (39, 40)
Fig. 10
Fig. 10
Asymmetry of the SIR solutions as a function of ρ. The points are the values of the asymmetry computed numerically for discrete values of ρ=1.5,2,3,,9. The solid line is a fitted right line A+Bρ. The dashed line is the Jacobian |dτ/dτ|i0 evaluated for i0=0.84ipeak
Fig. 11
Fig. 11
The function i(t) obtained for ρ=3, and computed for different initial values of i(0)
Fig. 12
Fig. 12
Total deaths D(t) during the first wave of the COVID-19 pandemic for several countries, compared to the Gumbel function G(t). The parameter b of the Gumbel function fitted to the data is given in Table 2. Data are from Ref. [49]
Fig. 13
Fig. 13
Total deaths D(t) during the first wave of the COVID-19 pandemic for several countries, compared to the Gumbel function G(t). The parameter b of the Gumbel function fitted to the data is given in Table 2. Data are from Ref. [49]
Fig. 14
Fig. 14
Daily deaths ΔD(t) during the first wave of the COVID-19 pandemic for several countries compared to the Gumbel function G(t). The parameter b of the Gumbel function fitted to the data is given in Table 2. Data are from Ref. [49]
Fig. 15
Fig. 15
Daily deaths ΔD(t) during the first wave of the COVID-19 pandemic for several countries compared to the Gumbel function G(t). The parameter b of the Gumbel function fitted to the data is given in Table 2. Data are from Ref. [49]
Fig. 16
Fig. 16
Daily deaths ΔD(t) during the first wave of the COVID-19 pandemic for several countries compared to the Gumbel function G(t). The parameter b of the Gumbel function fitted to the data is given in Table 2. Data are from Ref. [49]
Fig. 17
Fig. 17
Daily deaths ΔD(t) in the first wave of coronavirus pandemic for several countries, compared to the Gumbel function G(t). The parameter b of the Gumbel function fitted to the data is given in Table 2. Data are from Ref. [49]
Fig. 18
Fig. 18
Locations of the different countries studied in the plane of SIR parameters (ρ,1/β)

References

    1. Hui DS, Azhar E, Madani TA, et al. The continuing 2019-nCoV epidemic threat of novel coronaviruses to global health—the latest 2019 novel coronavirus outbreak in Wuhan, China. Int. J. Infect. Dis. 2020;91:264. - PMC - PubMed
    1. Tang B, Wang X, Li Q, Bragazzi NL, Tang S, Xiao Y, Wu J. Estimation of the transmission risk of the 2019-nCoV and its implication for public health interventions. J. Clin. Med. 2020;9(2):462. - PMC - PubMed
    1. Wu JT, Leung K, Leung GM. Nowcasting and forecasting the potential domestic and international spread of the 2019-nCoV outbreak originating in Wuhan, China: a modelling study. Lancet. 2020;395(10225):689. - PMC - PubMed
    1. Kraemer MUG, Yang CH, Gutierrez B, Wu CH, Klein B, Pigott DM, Brownstein JS. The effect of human mobility and control measures on the COVID-19 epidemic in China. Science. 2020;368(6490):493. - PMC - PubMed
    1. Hamer WH. The Milroy Lectures on Epidemic disease in England—the evidence of variability and of persistency of type. Lancet. 1906;167(4305):569.

LinkOut - more resources