. 2022 Sep 23:2022:4764609.
doi: 10.1155/2022/4764609. eCollection 2022.

Prognostic Value of Combination of Controlling Nutritional Status and Tumor Marker in Patients with Radical Non-Small-Cell Lung Cancer

Affiliations

Prognostic Value of Combination of Controlling Nutritional Status and Tumor Marker in Patients with Radical Non-Small-Cell Lung Cancer

Keru Ma et al. Dis Markers. .

Abstract

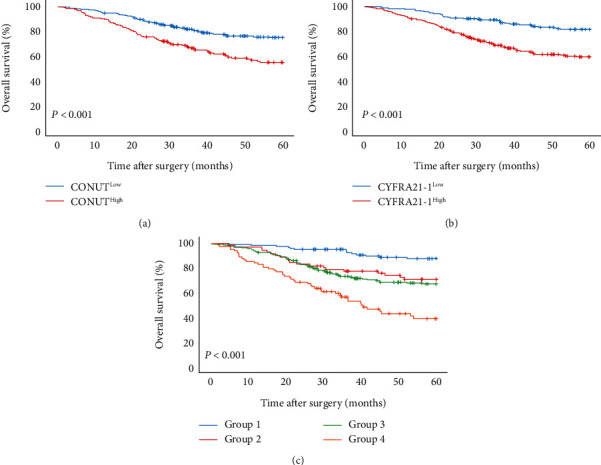
Background: Controlling nutritional status (CONUT) and tumor markers are associated with prognosis in patients with non-small-cell lung cancer (NSCLC). This study is aimed at exploring the potential usefulness of T-CONUT, constructed by combining CONUT and tumor markers, for NSCLC patients undergoing radical surgery.

Methods: A total of 483 patients with NSCLC underwent radical surgical resection. The receiver characteristic operating curve (ROC) was used to select the tumor marker with the highest predictive performance, and CONUT was combined with this marker to construct the T-CONUT. The Kaplan-Meier method and log-rank test were used to analyze the overall survival (OS), and chi-square analysis was used to analyze the association between T-CONUT and clinicopathological characteristics. The independent risk factors were analyzed by Cox regression. A nomogram was constructed by R studio. Calibration plots, the c-index, and decision curves were evaluated for the performance of the nomogram.

Results: ROC analysis showed that the predictive performance of CYFRA21-1 was better than that of CEA, NSE, and SCC. CYFRA21-1 was selected for combining with CONUT to construct T-CONUT. Elevated T-CONUT indicates poor prognosis of patients. Histological type, pTNM, and T-CONUT are independent risk factors associated with patient prognosis. The areas under the curve of the nomogram for predicting 3- and 5-year OS were 0.760 and 0.761, respectively.

Conclusion: T-CONUT comprising CYFRA21-1 and CONUT can effectively predict the prognosis of NSCLC patients.


Conflict of interest statement

The authors declare that they have no conflict of interest.

Figures

Figure 1
Figure 1
ROC of tumor markers and nutritional markers among total patients. (a) Comparison of predictive performance of different tumor markers. (b) Comparison of predictive performance of T-CONUT with nutritional markers. (c) Comparison of predictive performance of different tumor markers combined with CONUT.
Figure 2
Figure 2
Time-dependent ROC curves for the T-CONUT, PNI, and SIS. The horizontal axis represents month after surgery, and the vertical axis represents the estimated AUC for survival at the time of interest. Red, green, and blue solid lines represent the estimated AUCs for the T-CONUT, PNI, and SIS, respectively.
Figure 3
Figure 3
Kaplan–Meier analysis of OS of overall NSCLC patients. (a) Association of the CONUT with the OS of overall patients. (b) Association of the CYFRA21-1 with the OS of overall patients. (c) Association of the T-CONUT with the OS of overall patients.
Figure 4
Figure 4
Kaplan–Meier analysis of OS of NSCLC patients at each pTNM stage according to the T-CONUT. (a) Association of the T-CONUT with the OS of patients with stage I NSCLC. (b) Association of the T-CONUT with the OS of patients with stage II NSCLC. (c) Association of the T-CONUT with the OS of patients with stage III NSCLC.
Figure 5
Figure 5
(a) Nomogram model predicting the 3- and 5-year OS of all patients. (b) ROC curve of the nomogram model predicting the 3-year OS of all patients. (c) Calibration curve for 3-year nomogram predictions. (d) ROC curve of the nomogram model predicting the 5-year OS of all patients. (e) Calibration curve for 3-year nomogram predictions.
Figure 6
Figure 6
Decision curve analysis for the 5-year survival predictions. In the decision curve analysis, the y-axis indicates net beneft, calculated by summing the benefts (true positives) and subtracting the harms (false positives). The nomogram model (red dotted line) had the highest net benefit compared with the pTNM staging system (green dotted line). The straight line represents the assumption that all the patients will die, and the horizontal line represents the assumption that none of the patients will die.

References

    1. Sung H., Ferlay J., Siegel R. L., et al. Global cancer statistics 2020: GLOBOCAN estimates of incidence and mortality worldwide for 36 cancers in 185 countries. CA: a Cancer Journal for Clinicians . 2021;71(3):209–249. doi: 10.3322/caac.21660. - DOI - PubMed
    1. Planchard D., Popat S., Kerr K., et al. Metastatic non-small cell lung cancer: ESMO Clinical Practice Guidelines for diagnosis, treatment and follow-up†. Annals of Oncology . 2018;29:p. iv192. doi: 10.1093/annonc/mdy275. - DOI - PubMed
    1. Maemondo M., Inoue A., Kobayashi K., et al. Gefitinib or chemotherapy for non-small-cell lung cancer with mutated EGFR. The New England Journal of Medicine . 2010;362(25):2380–2388. doi: 10.1056/NEJMoa0909530. - DOI - PubMed
    1. Govindan R., Bogart J., Vokes E. E. Locally advanced non-small cell lung cancer: the past, present, and future. Journal of Thoracic Oncology . 2008;3(8):917–928. doi: 10.1097/JTO.0b013e318180270b. - DOI - PubMed
    1. Kovarik M., Hronek M., Zadak Z. Clinically relevant determinants of body composition, function and nutritional status as mortality predictors in lung cancer patients. Lung Cancer . 2014;84(1):1–6. doi: 10.1016/j.lungcan.2014.01.020. - DOI - PubMed