

The mechanism of the Nfe2l2/Hmox1 signaling pathway in ferroptosis regulation in acute compartment syndrome
- PMID: 36193742
- PMCID: PMC10078270
- DOI: 10.1002/jbt.23228
The mechanism of the Nfe2l2/Hmox1 signaling pathway in ferroptosis regulation in acute compartment syndrome
Abstract
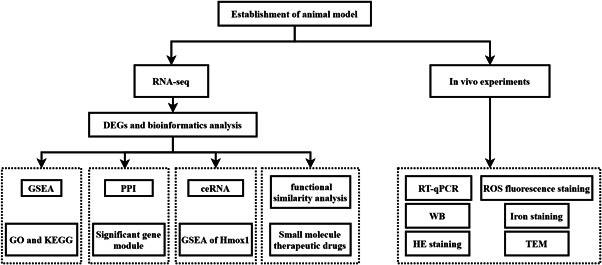
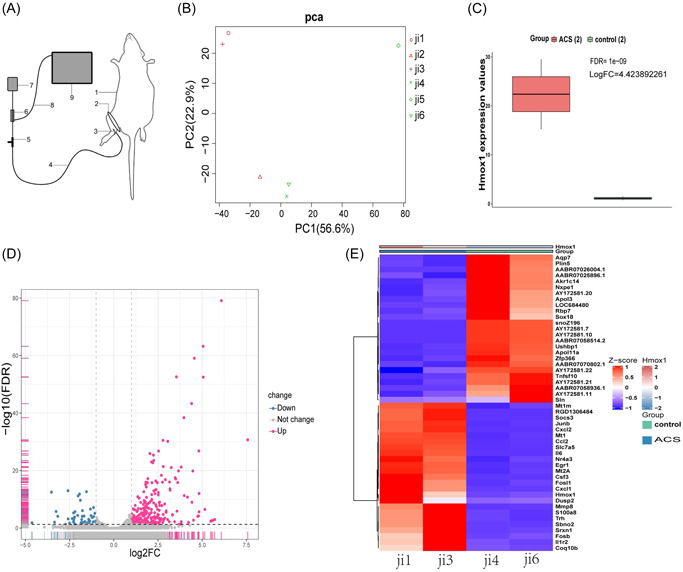
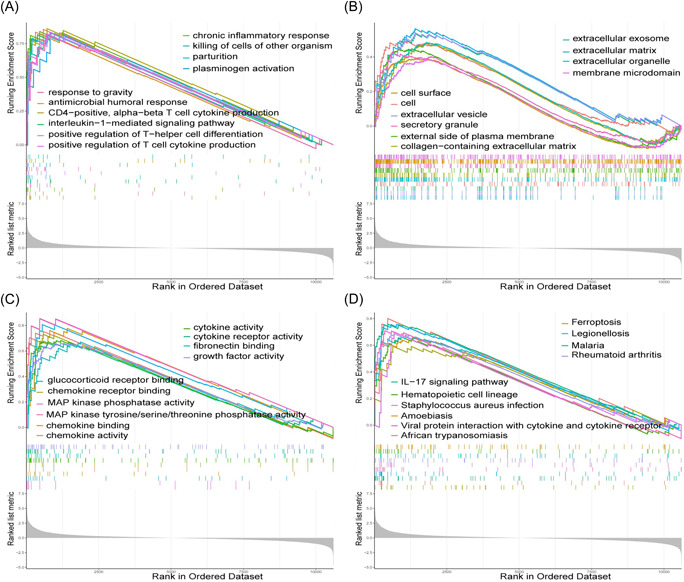
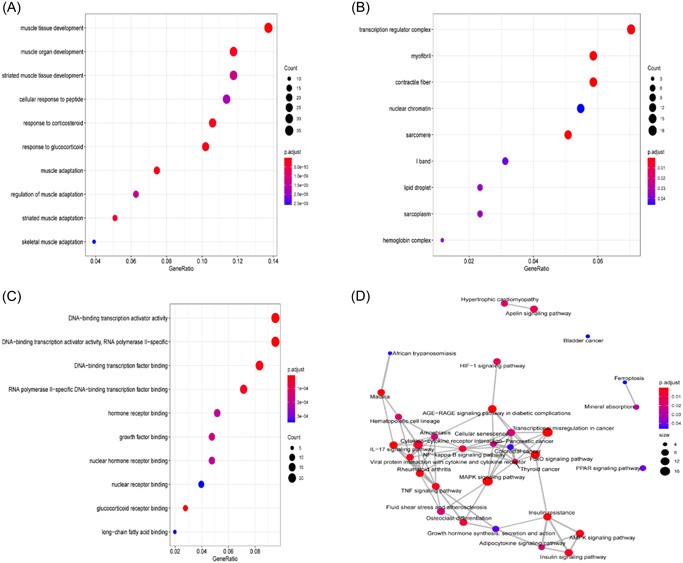
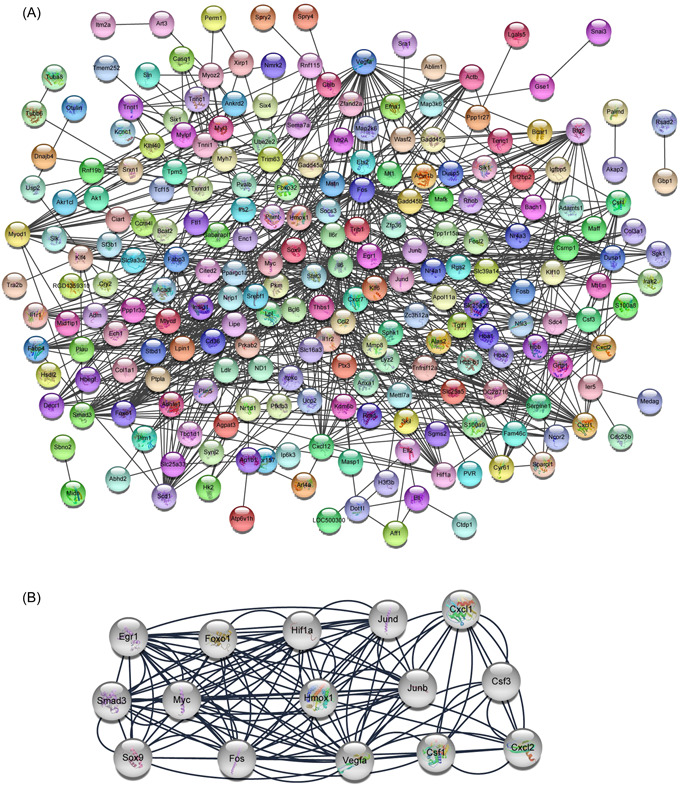
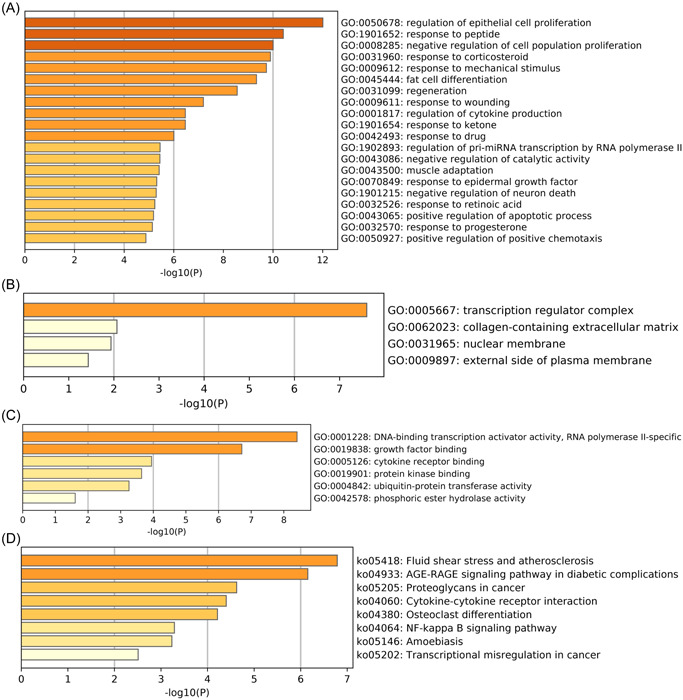
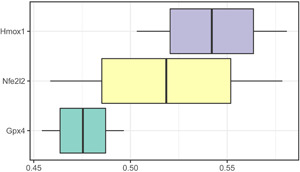
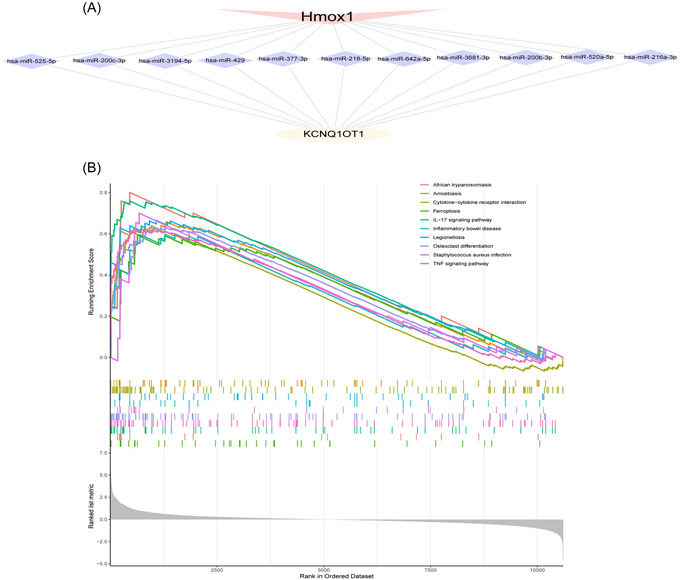
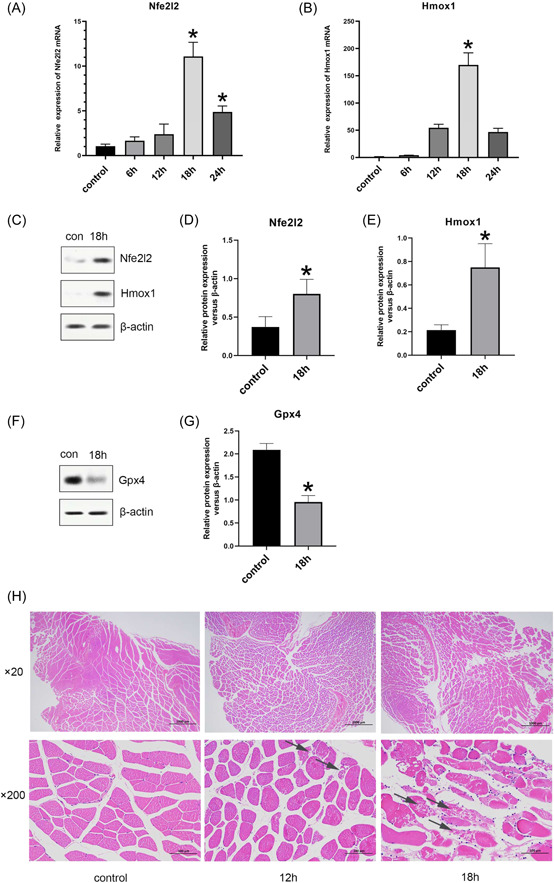
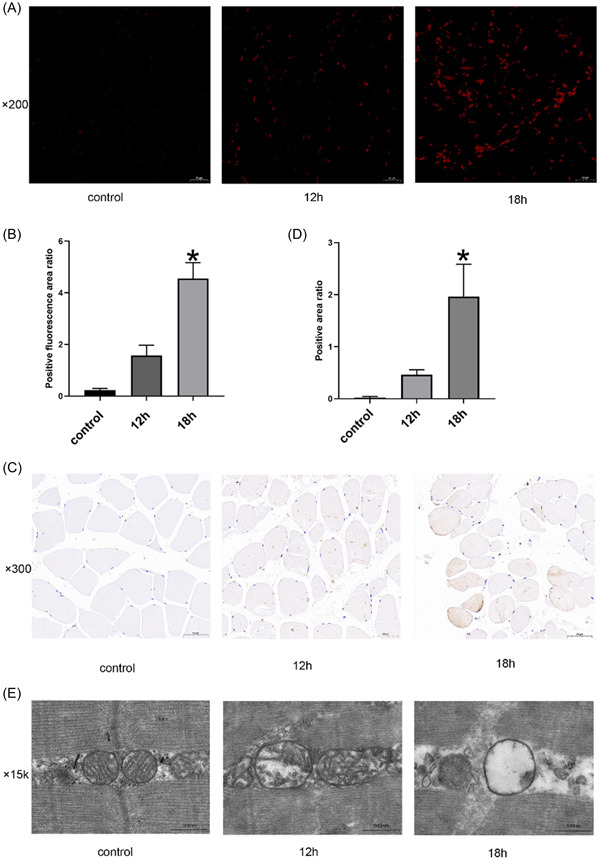
Acute compartment syndrome (ACS) is a life-threatening orthopedic emergency, which can even result in amputation. Ferroptosis is an iron-dependent form of nonapoptotic cell death. This study investigated the mechanism of ferroptosis in ACS, explored candidate markers, and determined effective treatments. This study identified pathways involved in the development of ACS through gene set enrichment analysis (GSEA), Gene Ontology, Kyoto Encyclopedia of Genes and Genomes (KEGG), and GSEA of heme oxygenase 1 (Hmox1). Bioinformatics methods, combined with real-time quantitative polymerase chain reaction, western blot analysis, and iron staining, were applied to determine whether ferroptosis was involved in the progression of ACS and to explore the mechanism of nuclear factor erythroid-2-related factor 2 (Nfe2l2)/Hmox1 in ferroptosis regulation. Optimal drugs for the treatment of ACS were also investigated using Connectivity Map. The ferroptosis pathway was enriched in GSEA, KEGG of DEGs, and GSEA of Hmox1. After ACS, the reactive oxygen species content, tissue iron content, and oxidative stress level increased, whereas glutathione peroxidase 4 protein expression decreased. The skeletal muscle was swollen and necrotized; the number of mitochondrial cristae became fewer or even disappeared, and Nfe2l2/Hmox1 expression increased at the transcriptional and protein levels. Hmox1 was highly expressed in ACS, indicating that Hmox1 is a possible marker for ACS. we could predict 12 potential target drugs for the treatment of ACS. In conclusion, Hmox1 was a potential candidate marker for ACS diagnosis. Ferroptosis was involved in the progression of ACS. It was speculated that ferroptosis is inhibited by the Nfe2l2/Hmox1 signaling pathway.
Keywords: Nfe2l2/Hmox1 signaling pathway; RNA-sequencing; acute compartment syndrome; bioinformatics analysis; ferroptosis.
© 2022 The Authors. Journal of Biochemical and Molecular Toxicology published by Wiley Periodicals LLC.
Conflict of interest statement
The authors declare no conflict of interest.
Figures
Similar articles
-
Mechanism of minocycline activating Nrf2/Hmox1 pathway to prevent ferroptosis and alleviate acute compartment syndrome.J Orthop Surg Res. 2024 Oct 24;19(1):686. doi: 10.1186/s13018-024-05183-z. J Orthop Surg Res. 2024. PMID: 39443986 Free PMC article.
-
EF24 induces ferroptosis in osteosarcoma cells through HMOX1.Biomed Pharmacother. 2021 Apr;136:111202. doi: 10.1016/j.biopha.2020.111202. Epub 2021 Jan 14. Biomed Pharmacother. 2021. PMID: 33453607
-
Cryptotanshinone promotes ferroptosis in glioblastoma via KEAP1/NRF2/HMOX1 signaling pathway.Biochem Biophys Res Commun. 2025 Jul 1;768:151959. doi: 10.1016/j.bbrc.2025.151959. Epub 2025 May 7. Biochem Biophys Res Commun. 2025. PMID: 40345007
-
[Kelch-like ech-associated protein 1/nuclear factor E2-related factor 2/antioxidant response element pathway alleviates ferroptosis in sepsis by regulating oxidative stress].Zhonghua Wei Zhong Bing Ji Jiu Yi Xue. 2021 Jul;33(7):881-884. doi: 10.3760/cma.j.cn121430-20210130-00180. Zhonghua Wei Zhong Bing Ji Jiu Yi Xue. 2021. PMID: 34412763 Review. Chinese.
-
NFE2L2 and ferroptosis resistance in cancer therapy.Cancer Drug Resist. 2024 Oct 25;7:41. doi: 10.20517/cdr.2024.123. eCollection 2024. Cancer Drug Resist. 2024. PMID: 39534872 Free PMC article. Review.
Cited by
-
A risk score model based on endoplasmic reticulum stress related genes for predicting prognostic value of osteosarcoma.BMC Musculoskelet Disord. 2023 Jun 23;24(1):519. doi: 10.1186/s12891-023-06629-x. BMC Musculoskelet Disord. 2023. PMID: 37353812 Free PMC article.
-
Reduced GLP-1R availability in the caudate nucleus with Alzheimer's disease.Front Aging Neurosci. 2024 Jun 10;16:1350239. doi: 10.3389/fnagi.2024.1350239. eCollection 2024. Front Aging Neurosci. 2024. PMID: 38915346 Free PMC article.
-
Mechanism of miR-107/HMOX1 axis in hepatic sinusoidal endothelial cells stimulated by ischemia-reperfusion injury.Hereditas. 2025 Jul 16;162(1):133. doi: 10.1186/s41065-025-00495-4. Hereditas. 2025. PMID: 40671163 Free PMC article.
References
-
- McQueen M. M., Gaston P., Court‐Brown C. M., J. Bone Jt. Surg. Br. 2000, 82(2), 200. - PubMed
MeSH terms
Substances
Grants and funding
LinkOut - more resources
Full Text Sources
