Randomized Controlled Trial
. 2022 Dec 1;95(1140):20220058.
doi: 10.1259/bjr.20220058. Epub 2022 Oct 27.

Artificial intelligence-based model for COVID-19 prognosis incorporating chest radiographs and clinical data; a retrospective model development and validation study

Affiliations
Randomized Controlled Trial

Artificial intelligence-based model for COVID-19 prognosis incorporating chest radiographs and clinical data; a retrospective model development and validation study

Shannon L Walston et al. Br J Radiol. .

Abstract

Objectives: The purpose of this study was to develop an artificial intelligence-based model to prognosticate COVID-19 patients at admission by combining clinical data and chest radiographs.

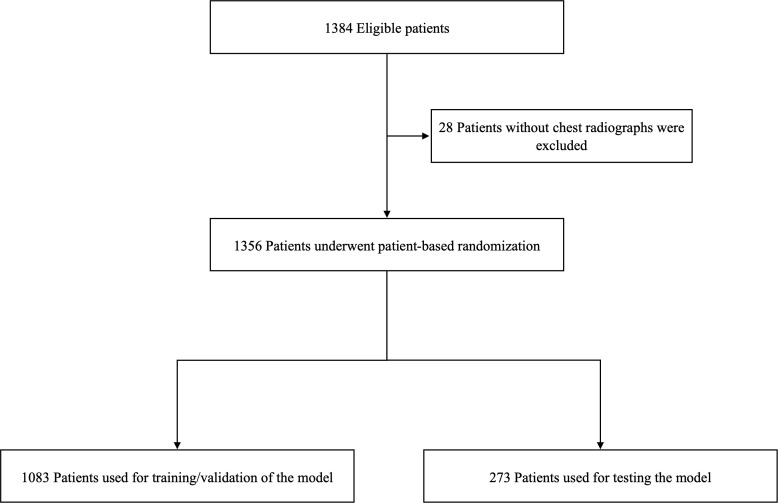
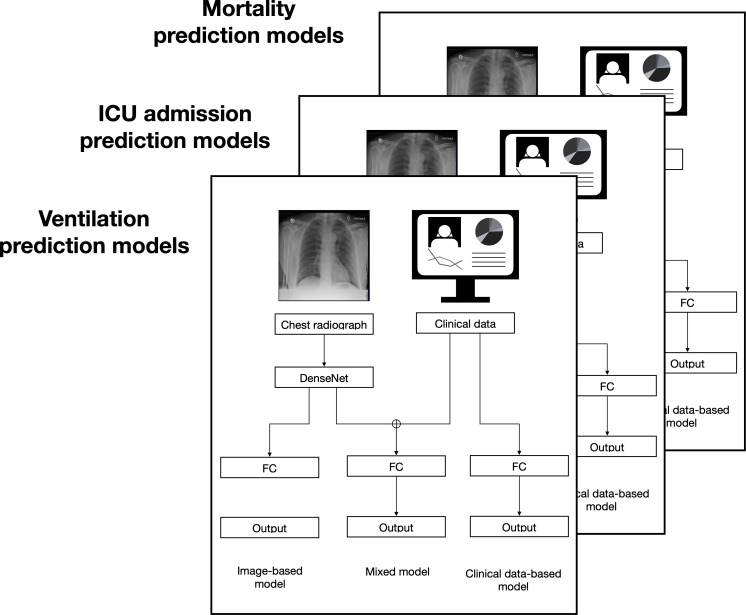
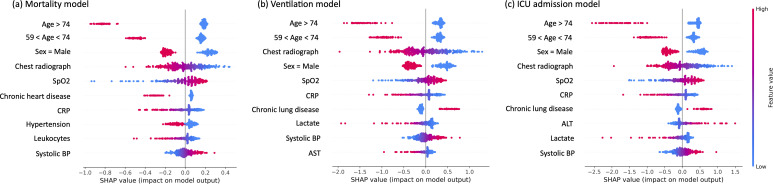
Methods: This retrospective study used the Stony Brook University COVID-19 dataset of 1384 inpatients. After exclusions, 1356 patients were randomly divided into training (1083) and test datasets (273). We implemented three artificial intelligence models, which classified mortality, ICU admission, or ventilation risk. Each model had three submodels with different inputs: clinical data, chest radiographs, and both. We showed the importance of the variables using SHapley Additive exPlanations (SHAP) values.

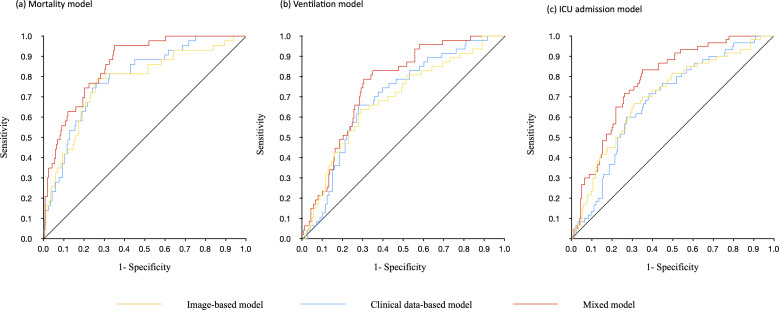
Results: The mortality prediction model was best overall with area under the curve, sensitivity, specificity, and accuracy of 0.79 (0.72-0.86), 0.74 (0.68-0.79), 0.77 (0.61-0.88), and 0.74 (0.69-0.79) for the clinical data-based model; 0.77 (0.69-0.85), 0.67 (0.61-0.73), 0.81 (0.67-0.92), 0.70 (0.64-0.75) for the image-based model, and 0.86 (0.81-0.91), 0.76 (0.70-0.81), 0.77 (0.61-0.88), 0.76 (0.70-0.81) for the mixed model. The mixed model had the best performance (p value < 0.05). The radiographs ranked fourth for prognostication overall, and first of the inpatient tests assessed.

Conclusions: These results suggest that prognosis models become more accurate if AI-derived chest radiograph features and clinical data are used together.

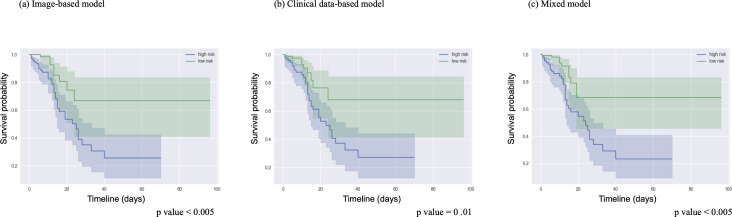
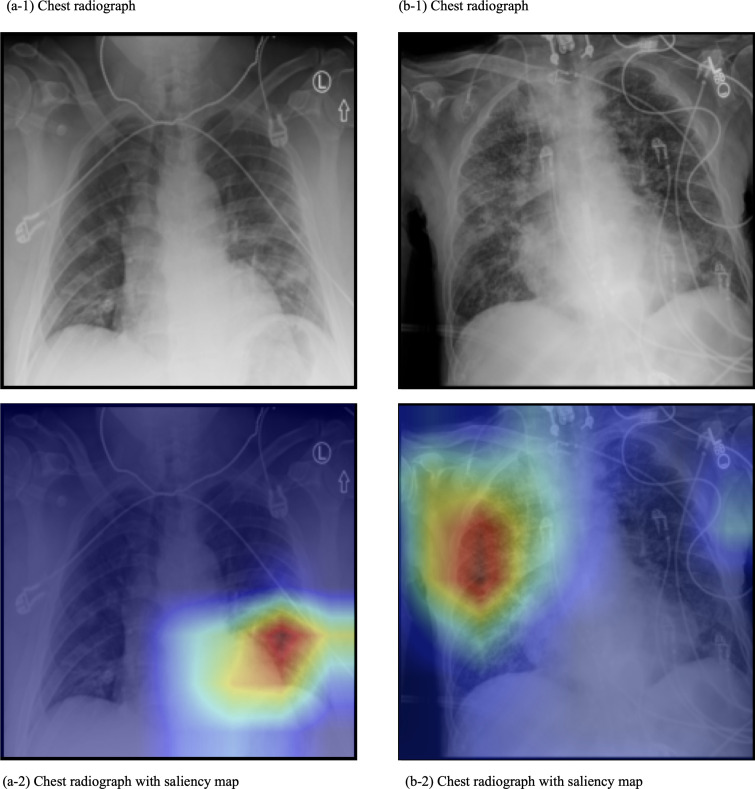
Advances in knowledge: This AI model evaluates chest radiographs together with clinical data in order to classify patients as having high or low mortality risk. This work shows that chest radiographs taken at admission have significant COVID-19 prognostic information compared to clinical data other than age and sex.


Figures

Figure 1.
Figure 1.
Eligibility flowchart.
Figure 2.
Figure 2.
Overview of the classification and prognostic models. The chest radiographs were input as PNG images, and the clinical data were in a CSV file. Three sets of models were created; one each with the output arranged to show if the COVID-19 patient was expected to die, require mechanical ventilation, or require ICU admission. FC = Fully connected layers
Figure 3.
Figure 3.
Receiver operating characteristic curves. Each panel represents different outcome targets for the models. (a) Risk of death. The clinical data-based model had an AUC of 0.79 (0.72–0.86), the image-based model had an AUC of 0.77 (0.69–0.85), and the mixed model had an AUC of 0.86 (0.81–0.91). (b) Risk of mechanical ventilation. The clinical data-based model had an AUC of 0.70 (0.62–0.77), the image-based model had an AUC of 0.68 (0.60–0.77), and the mixed model had an AUC of 0.76 (0.69–0.83). (c) Risk of ICU admission. The clinical data-based model had an AUC of 0.68 (0.61–0.75), the image-based model had an AUC of 0.70 (0.62–0.77), and the mixed model had an AUC of 0.78 (0.72–0.84). AUC = area under the curve
Figure 4.
Figure 4.
Kaplan–Meier survival plots for each model. The high-risk and low-risk patients from each mortality model were divided based on the median model output value. This plot shows the ground truth survival of these patients and the shaded area represents the accuracy of the prediction.
Figure 5.
Figure 5.
SHAP values for each variable. Beeswarm plots of the SHAP value for each patient for the top ten variables. The plots relate to risk of death (a), risk of mechanical ventilation (b), and risk of ICU admission (c). Each dot represents one patient. The location of the dot represents if changing the value for that patient would have a positive (less likely to predict outcome) or negative (more likely to predict outcome) effect on the model, and to what extent. The color represents the value range of the variable from lowest (blue) to highest (red). Some variables only have binomial representations; for sex, red represents male. For age, red represents an age above the cutoff. When there are many patients with very similar SHAP values, the swarm expands vertically.
Figure 6.
Figure 6.
Representative saliency maps. These are chest radiographs and the saliency map overlay of two patients (labeled a and b) from the Stony Brook Hospital dataset. The mortality prediction model was used. In these images, the model focus was on an area of infiltration.

Similar articles

Cited by

References

    1. WHO . Weekly epidemiological update—16 november 2021 . Available from : https://www.who.int/publications/m/item/weekly-epidemiological-update-on... ( accessed 16 Nov 2021 )
    1. Wynants L, Van Calster B, Collins GS, Riley RD, Heinze G, Schuit E, et al. . Prediction models for diagnosis and prognosis of covid-19: systematic review and critical appraisal . BMJ 2020. ; 369 : m1328 . doi: 10.1136/bmj.m1328 - DOI - PMC - PubMed
    1. Gidari A, De Socio GV, Sabbatini S, Francisci D . Predictive value of national early warning score 2 (NEWS2) for intensive care unit admission in patients with sars-cov-2 infection . Infect Dis (Lond) 2020. ; 52 : 698 – 704 . doi: 10.1080/23744235.2020.1784457 - DOI - PubMed
    1. Piva S, Filippini M, Turla F, Cattaneo S, Margola A, De Fulviis S, et al. . Clinical presentation and initial management critically ill patients with severe acute respiratory syndrome coronavirus 2 (SARS-CoV-2) infection in Brescia, Italy . J Crit Care 2020. ; 58 : 29 – 33 : S0883-9441(20)30547-5 . doi: 10.1016/j.jcrc.2020.04.004 - DOI - PMC - PubMed
    1. Singer M, Deutschman CS, Seymour CW, Shankar-Hari M, Annane D, Bauer M, et al. . The third international consensus definitions for sepsis and septic shock (sepsis-3) . JAMA 2016. ; 315 : 801 – 10 . doi: 10.1001/jama.2016.0287 - DOI - PMC - PubMed

Publication types