

Antagonizing microRNA-19a/b augments PTH anabolic action and restores bone mass in osteoporosis in mice
- PMID: 36193848
- PMCID: PMC9641424
- DOI: 10.15252/emmm.202013617
Antagonizing microRNA-19a/b augments PTH anabolic action and restores bone mass in osteoporosis in mice
Abstract
Postmenopausal bone loss often leads to osteoporosis and fragility fractures. Bone mass can be increased by the first 34 amino acids of human parathyroid hormone (PTH), parathyroid hormone-related protein (PTHrP), or by a monoclonal antibody against sclerostin (Scl-Ab). Here, we show that PTH and Scl-Ab reduce the expression of microRNA-19a and microRNA-19b (miR-19a/b) in bone. In bones from patients with lower bone mass and from osteoporotic mice, miR-19a/b expression is elevated, suggesting an inhibitory function in bone remodeling. Indeed, antagonizing miR-19a/b in vivo increased bone mass without overt cytotoxic effects. We identified TG-interacting factor 1 (Tgif1) as the target of miR-19a/b in osteoblasts and essential for the increase in bone mass following miR-19a/b inhibition. Furthermore, antagonizing miR-19a/b augments the gain in bone mass by PTH and restores bone loss in mouse models of osteoporosis in a dual mode of action by supporting bone formation and decreasing receptor activator of NF-κB ligand (RANKL)-dependent bone resorption. Thus, this study identifies novel mechanisms regulating bone remodeling, which opens opportunities for new therapeutic concepts to treat bone fragility.
Keywords: Tgif1; anti-miRNA; osteoporosis; parathyroid hormone; treatment.
© 2022 The Authors. Published under the terms of the CC BY 4.0 license.
Figures
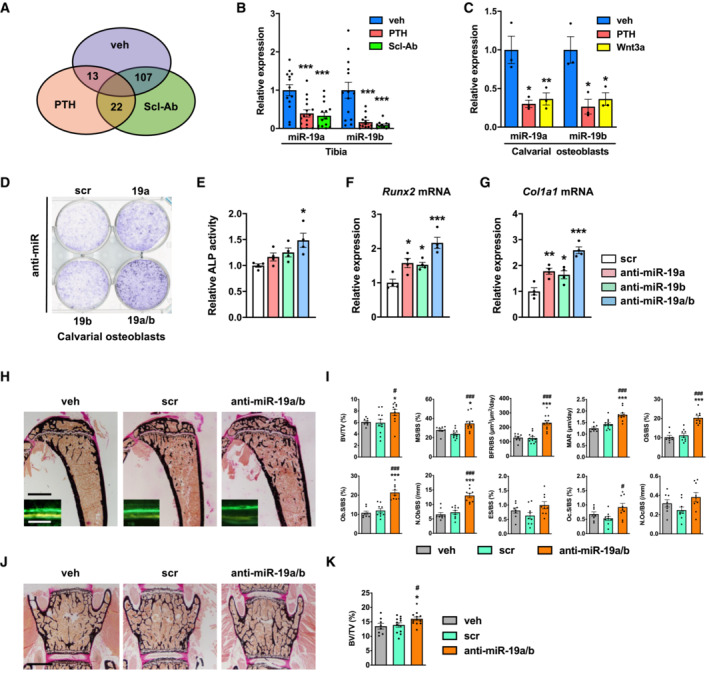
- A
Venn diagram illustrating the number of miRNAs whose expression was reduced in mouse bones in vivo upon injection of PTH (n = 4) or an antibody against Sclerostin (Scl‐Ab; n = 4) compared with vehicle (veh; n = 4) control.
- B
Quantification of the expression of miR‐19a and miR‐19b in bones of mice treated with PTH (n = 15) or Scl‐Ab (n = 14) compared with veh (n = 13) control.
- C
Quantification of the expression of miR‐19a and miR‐19b in calvarial osteoblasts upon in vitro stimulation with PTH or Wnt3a compared with veh control (n = 3).
- D
Alkaline phosphatase staining of differentiating calvarial osteoblasts transfected with a scrambled (scr) control miRNA, anti‐sense microRNA (anti‐miR) inhibiting miR‐19a or miR‐19b or a combination thereof (anti‐miR‐19a/b) (representative image of 4 independent experiments).
- E
Quantification of alkaline phosphatase staining of calvarial osteoblasts transfected with scr, anti‐miR‐19a, anti‐miR‐19b, or anti‐miR‐19a/b (n = 4).
- F, G
Expression analysis of osteoblast marker genes (F) Runx2 and (G) Type I Collagen (Col1a1) in calvarial osteoblasts transfected with scr, anti‐miR‐19a, anti‐miR‐19b, or anti‐miR‐19a/b (n = 4).
- H
Images of von Kossa‐stained histological sections of the proximal tibiae of 12‐week‐old male C57Bl/6J mice and fluorescence double labeling to visualize bone formation (insets) after 4 weeks of treatment with anti‐miR‐19a/b (n = 12), scr control oligonucleotides (n = 11) or veh (n = 8). Scale bars indicate 1 mm (black) and 50 μm (white).
- I
Bone histomorphometric analysis of the proximal tibiae of the same animals as in (H). BFR/BS, bone formation rate/bone surface; BV/TV, bone volume/tissue volume; ES/BS, eroded surface/bone surface; MAR, mineral apposition rate; MS/BS, mineralizing surface/bone surface; N.Ob/BS, number of osteoblasts/bone surface; N.Oc/BS, number of osteoclasts/bone surface; Ob.S/BS, osteoblast surface/bone surface; Oc.S/BS, osteoclast surface/bone surface; OS/BS, osteoid surface/bone surface.
- J
Images of von Kossa‐stained histological sections of the fourth lumbar vertebral body of 12‐week‐old mice after 4 weeks of treatment with anti‐miR‐19a/b, scr, or veh. Scale bar indicates 1 mm.
- K
Quantification of bone mass (BV/TV) of the fourth lumbar vertebral body of 12‐week‐old mice after 4 weeks of treatment with anti‐miR‐19a/b (n = 12), scr (n = 12) or veh (n = 8).
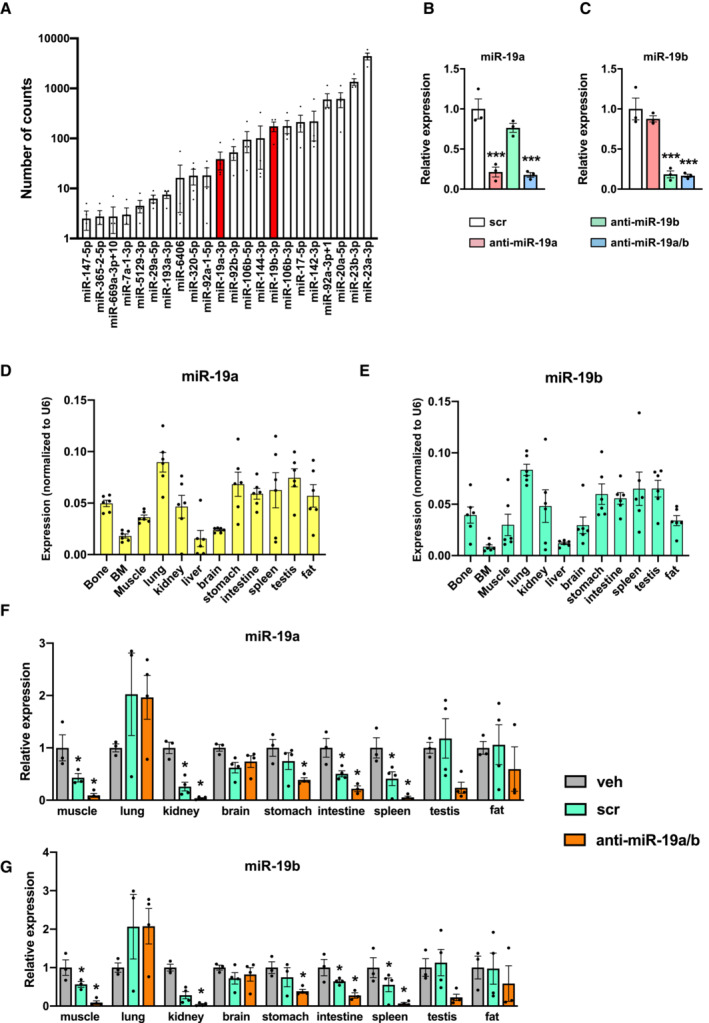
- A
Absolute expression (number of counts) of the 22 miRNAs in vehicle‐treated samples (n = 4) whose expression is decreased in mouse tibiae by PTH and Scl‐Ab treatment.
- B, C
Expression of miR‐19a (B) and miR‐19b (C) in MC3T3‐E1 cells after transfection with scrambled (scr) control oligonucleotide, anti‐miR‐19a, anti‐miR‐19b, or anti‐miR‐19a/b (n = 3).
- D, E
Expression of miR‐19a (D) and miR‐19b (E) in mouse organs and tissues (n = 6). Values are normalized to U6 as an internal control (ΔC T).
- F, G
Relative expression of miR‐19a (F) and miR‐19b (G) in mouse organs and tissues after 4‐weeks of intravenous (i.v.) treatment with vehicle (veh, n = 3), scrambled (scr, n = 4) or anti‐miR‐19a/b (n = 4).
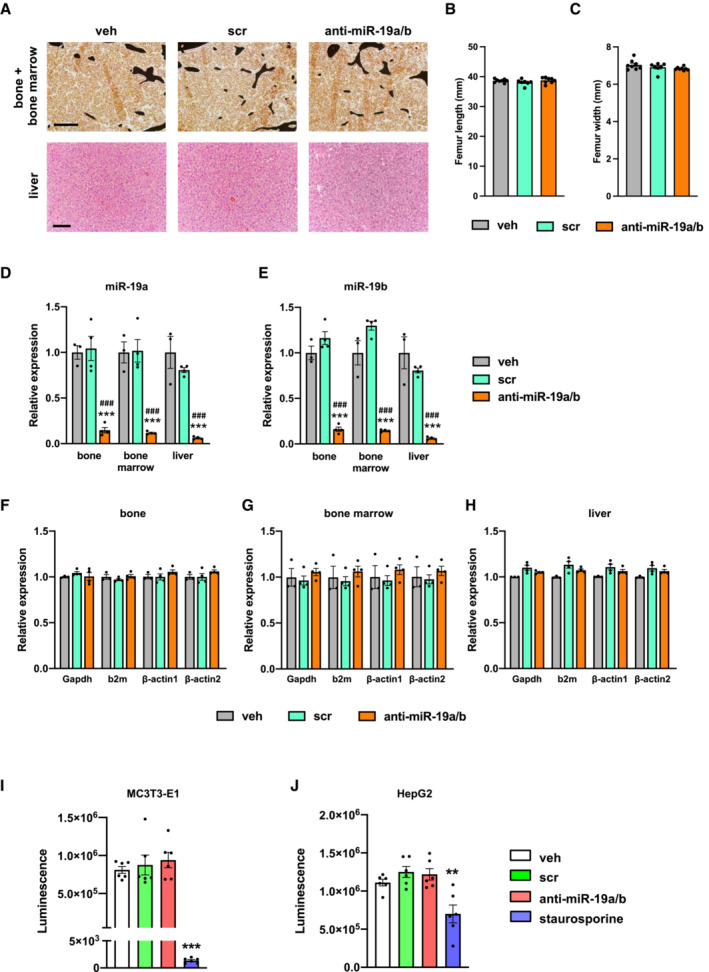
- A
Images of von Kossa‐stained histological sections of the bone and bone marrow (upper panel) and of hematoxylin–eosin‐stained liver sections (lower panel) of 12‐week‐old mice after treatment with anti‐miR‐19a/b (n = 12), scrambled (scr) control oligonucleotides (n = 11) or vehicle (veh) (n = 8). Scale bars indicate 100 μm (upper panel) and 50 μm (lower panel).
- B, C
Quantification of the femur length (B) and width (C) after treatment with anti‐miR‐19a/b (n = 8), scr (n = 7) or veh (n = 8).
- D, E
Quantification of the expression of miR‐19a (D) and miR‐19b (E) in the bone, bone marrow and liver after treatment with anti‐miR‐19a/b (n = 4), scr (n = 4) or veh (n = 3).
- F–H
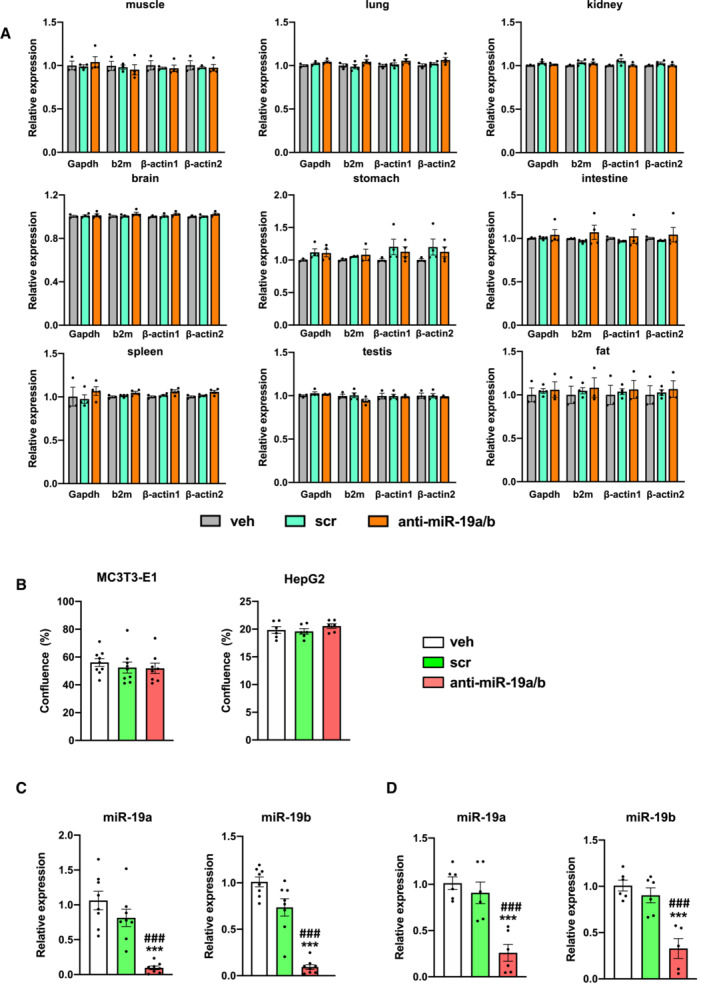
Quantification of the expression of the housekeeping genes glyceraldehyde‐3‐phosphate dehydrogenase (Gapdh), beta‐2 microglobulin (b2m), beta‐actin 1 (β‐actin 1) and beta‐actin 2 (β‐actin 2) in the bone (F), bone marrow (G) and liver (H) after treatment with anti‐miR‐19a/b (n = 4), scr (n = 4) or veh (n = 3).
- I, J
CTG assay‐based quantification of luminescence signal intensity as a surrogate parameter of metabolically active osteoblasts of the MC3T3‐E1 cell line (I) and of hepatocytes of the HepG2 cell line (J) treated with anti‐miR‐19a/b, scr or veh and after stimulation with staurosporine to induce cell death as a positive control. n = 6.
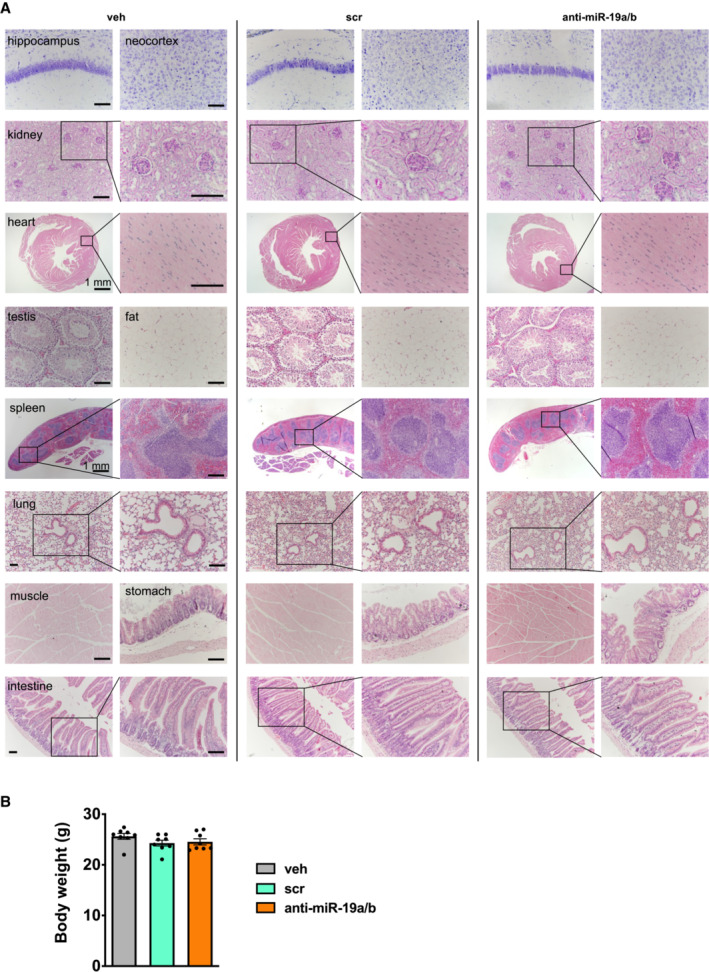
Histology of various mouse organs as indicated after 4 weeks of treatment with vehicle (veh, n = 8), scrambled control oligonucleotide (scr, n = 11) or anti‐miR‐19a/b (n = 11). Organs were stained by Nissl stain (brain sections), with periodic acid–Schiff (PAS) (kidney sections), or with hematoxylin and eosin (all other tissues). Scale bars indicate 100 μm unless otherwise noted. Representative images are shown.
Body weight of mice after 4 weeks of treatment with veh (n = 8), scr (n = 8) or anti‐miR‐19a/b (n = 8).
- A
Quantification of the expression of the housekeeping genes glyceraldehyde‐3‐phosphate dehydrogenase (Gapdh), beta‐2 microglobulin (b2m), beta‐actin 1 (β‐actin 1) and beta‐actin 2 (β‐actin 2) in several organs upon treatment with anti‐miR‐19a/b (n = 4), scrambled control oligonucleotide (scr, n = 4) or vehicle (veh, n = 3).
- B
Growth of osteoblasts of the MC3T3‐E1 cell line (n = 9) and of hepatocytes of the Hep2G cell line (n = 6) 24 h after treatment with anti‐miR‐19a/b, scrambled control oligonucleotide (scr) or vehicle (veh).
- C–D
(C) Quantification of the expression of endogenous miR‐19a and miR‐19b in cells of the MC3T3‐E1 (n = 8) and (D) HepG2 (n = 6) cell lines after treatment with anti‐miR‐19a/b, scr or veh. Data information: Mean values ± SEM. Three groups were compared using one‐way ANOVA followed by Tukey's post hoc analysis. ***P < 0.001 vs. veh. ### P < 0.001 vs. scr.
- A
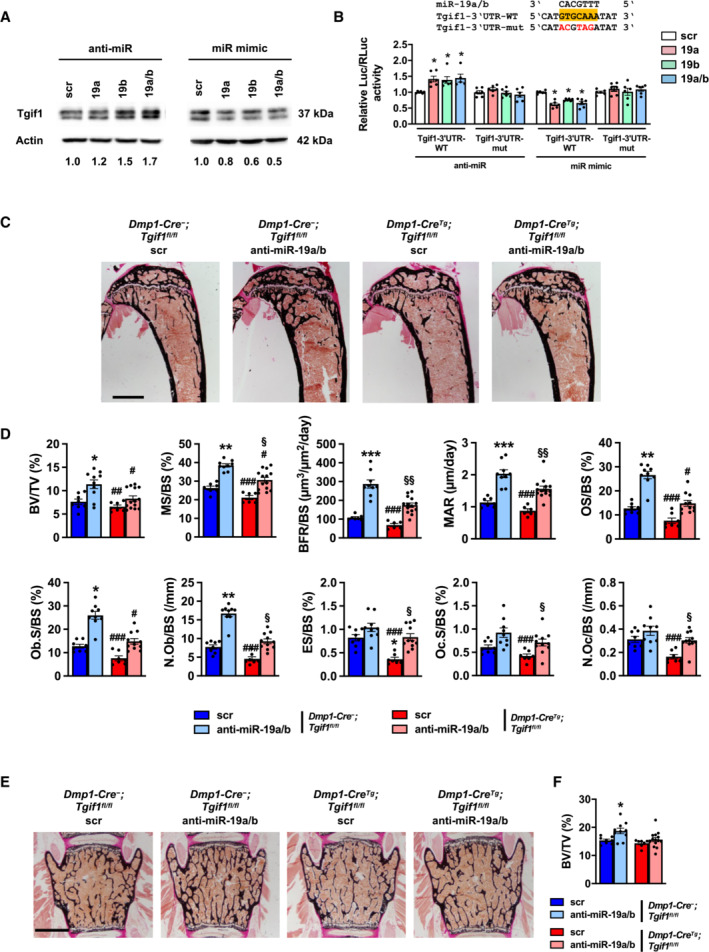
Immunoblot of Tgif1 protein expression in calvarial osteoblasts transfected with scrambled (scr), or with anti‐miR‐19a, anti‐miR‐19b and anti‐miR‐19a/b (left), or with miR‐19a, mir‐19b and mir‐19a/b mimics (right) as indicated. Immunoblot for Actin was used as a loading control. Normalized fold expression and molecular weight in kilo Dalton (kDa) are indicated (representative image of 3 independent experiments).
- B
Luciferase activity in MC3T3‐E1 cells transfected with a reporter plasmid containing the 3′ untranslated region (UTR) of the wild‐type (WT) Tgif1 mRNA (Tgif1‐3′UTR‐WT) or an alternative version bearing mutations (mut, marked in red) of the putative miR‐19a/b binding site (yellow box) to disable the binding of miR‐19a/b (Tgif1‐3′UTR‐mut). In addition to the respective reporter plasmid, cells were co‐transfected with scr, or with anti‐miR‐19a, anti‐miR‐19b and anti‐miR‐19a/b (left), or with miR‐19a, mir‐19b and mir‐19a/b mimics (right) as indicated. n = 6.
- C
Images of von Kossa‐stained histological sections of the proximal tibiae of 12‐week‐old male mice of the genotypes Dmp1‐Cre‐;Tgif1 fl/fl treated weekly with scr (n = 8) or anti‐miR‐19a/b (n = 10) and Dmp1‐Cre Tg ;Tgif1 fl/fl treated weekly with scr (n = 7) or anti‐miR‐19a/b (n = 14) for 4 weeks. Scale bar indicates 1 mm.
- D
Bone histomorphometric analysis of the proximal tibiae of the same animals as in (C). For abbreviations see legend to Fig 1.
- E, F
Images of von Kossa‐stained histological sections of the fourth lumbar vertebral bodies of the same animals as in (C) and (F) quantification of the BV/TV. Scale bar represents 1 mm.
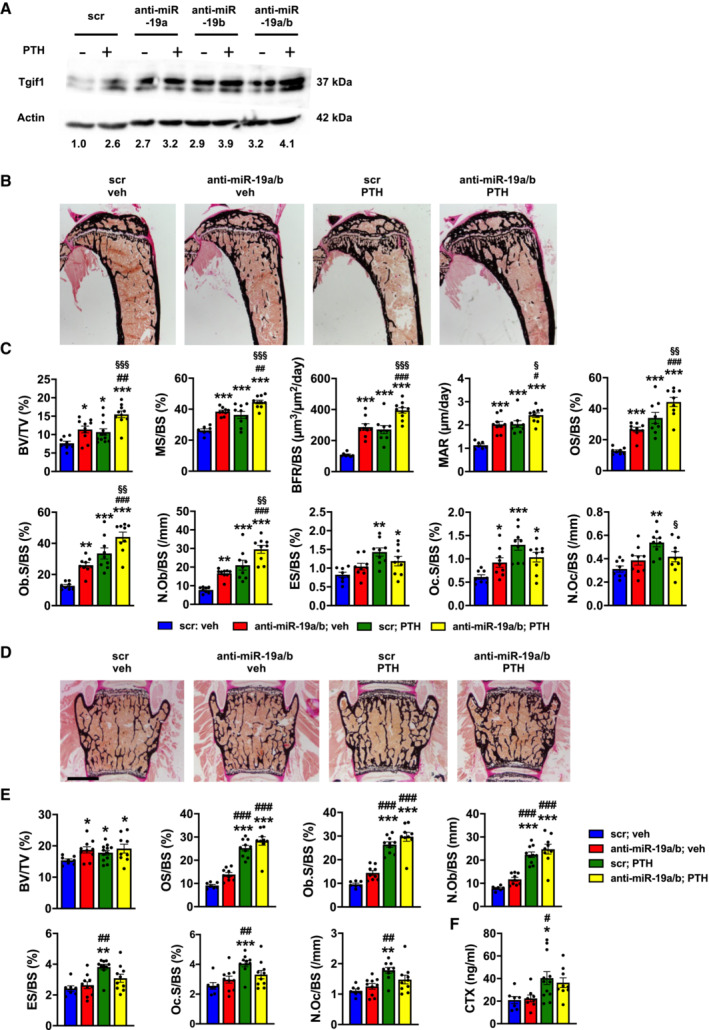
Immunoblot of Tgif1 protein expression in calvarial osteoblasts after stimulation with PTH (+) or vehicle (−) and after transfection with scrambled (scr), anti‐miR‐19a, anti‐miR‐19b, or anti‐miR‐19a/b as indicated. Immunoblot for Actin was used as a loading control. Normalized fold expression and molecular weight in kilo Dalton (kDa) are indicated (representative image of 3 independent experiments).
Images of von Kossa‐stained histological sections of the proximal tibiae of 12‐week‐old male wild‐type mice after treatment with scr oligonucleotides and vehicle (veh) (n = 8), anti‐miR‐19a/b and veh (n = 10), scr and intermittent PTH (n = 12) or a co‐treatment with anti‐miR‐19a/b and PTH (n = 10) for 4 weeks. Scale bar indicates 1 mm.
Histomorphometric analysis of the proximal tibiae of the same animals as in (B) after treatment with intermittent PTH or veh and/or weekly injections of anti‐miR‐19a/b or scr control for 4 weeks. For abbreviations see legend to Fig 1.
Images of von Kossa‐stained histological sections of the fourth lumbar vertebral bodies of the same animals as in (B). Scale bars indicate 1 mm.
Histomorphometric analysis of the fourth lumbar vertebral body. For abbreviations see legend to Fig 1, scr, veh (n = 8); anti‐miR‐19a/b, veh (n = 10); scr, PTH (n = 12); anti‐miR‐19a/b, veh (n = 10).
Analysis of serum carboxy‐terminal collagen crosslinks (CTX) in the same animals as in (B).
- A
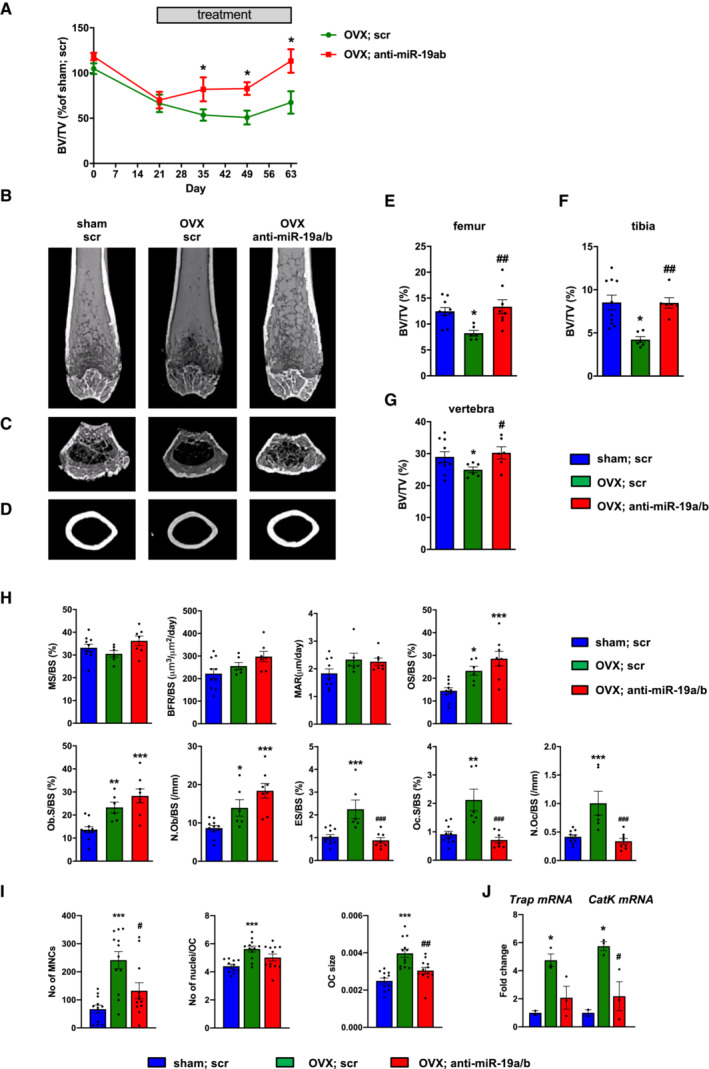
Time course of the relative change (compared with sham‐operated and scr‐treated control, n = 10) of bone mass (BV/TV, bone volume/tissue volume) in the tibiae of female mice in which osteoporosis was induced by ovariectomy (OVX) 21 days before the start of weekly intravenous (i.v.) treatment with scrambled (scr, n = 6) or anti‐miR‐19a/b (n = 8).
- B–D
Microcomputed tomography (μCT) of the distal femora (B, C) and midshaft femoral cross sections (D) of the same animals as in A, after the termination of the experiment.
- E–G
Quantification of trabecular BV/TV by μCT in femora (E), tibiae (F), and the fourth lumbar vertebral bodies (G) of the same animals as in (A–D) 70 days after OVX.
- H
Histomorphometric analysis of the proximal tibiae of the same mice as in (A–D) after termination of the experiment. For abbreviations see legend to Fig 1.
- I
Analysis of the number of TRAP‐positive multinucleated cells (No of MNCs), number of nuclei per osteoclast (No of nuclei/OC), and osteoclast size (OC size) after 4 days of ex vivo osteoclast differentiation of bone marrow macrophages isolated from sham‐operated (n = 11) or ovariectomized mice treated with scr (n = 12) or anti‐miR‐19a/b (n = 12).
- J
Expression analysis of the osteoclast marker genes Trap and Cathepsin K (CatK) in bone marrow macrophages isolated from sham‐operated (n = 2) or ovariectomized mice treated with scr (n = 3) or anti‐miR‐19a/b (n = 3) after 4 days of differentiation.
- A‐C
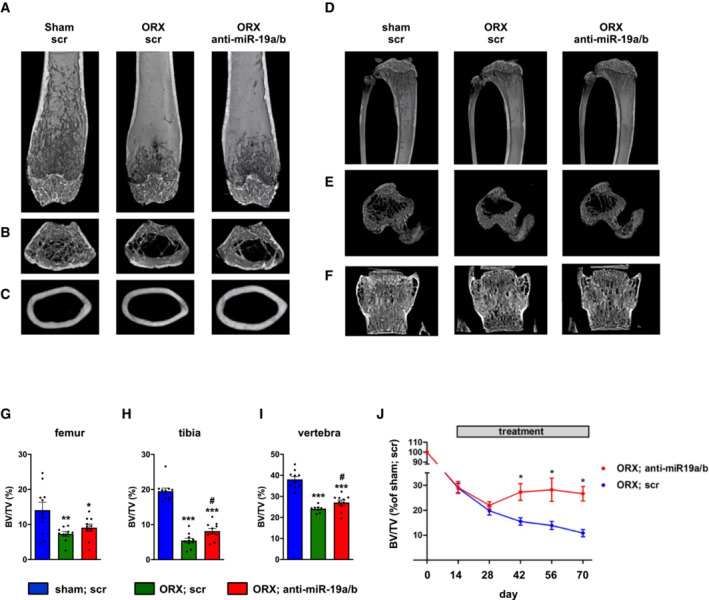
(A, B) μCT scans of the distal femora and (C) of midshaft femoral cross sections of sham‐operated male mice treated with scrambled control oligonucleotides (scr, n = 10) and of male mice in which osteoporosis was induced by orchiectomy (ORX) 14 days before the start of weekly treatment with anti‐miR‐19a/b (n = 10) or scr (n = 10).
- D–F
(D, E) μCT scans of the proximal tibiae and (F) the fourth lumbar vertebral bodies of the same mice as in (A–C).
- G–I
(G) μCT‐based quantification of the trabecular bone mass (BV/TV, bone volume/tissue volume) in distal femora, (H) proximal tibiae, and (I) fourth lumbar vertebral bodies 70 days after ORX, sham, scr (n = 10); ORX, scr (n = 10); ORX, anti‐miR‐19a/b (n = 10).
- J
Time course of the relative change (compared with sham‐operated and scr‐treated control) in BV/TV in the tibiae of male mice in which osteoporosis was induced by ORX 14 days before the start of weekly treatment with scr or anti‐miR‐19a/b, sham, scr (n = 10); ORX, scr (n = 10); ORX, anti‐miR‐19a/b (n = 10).
- A, B
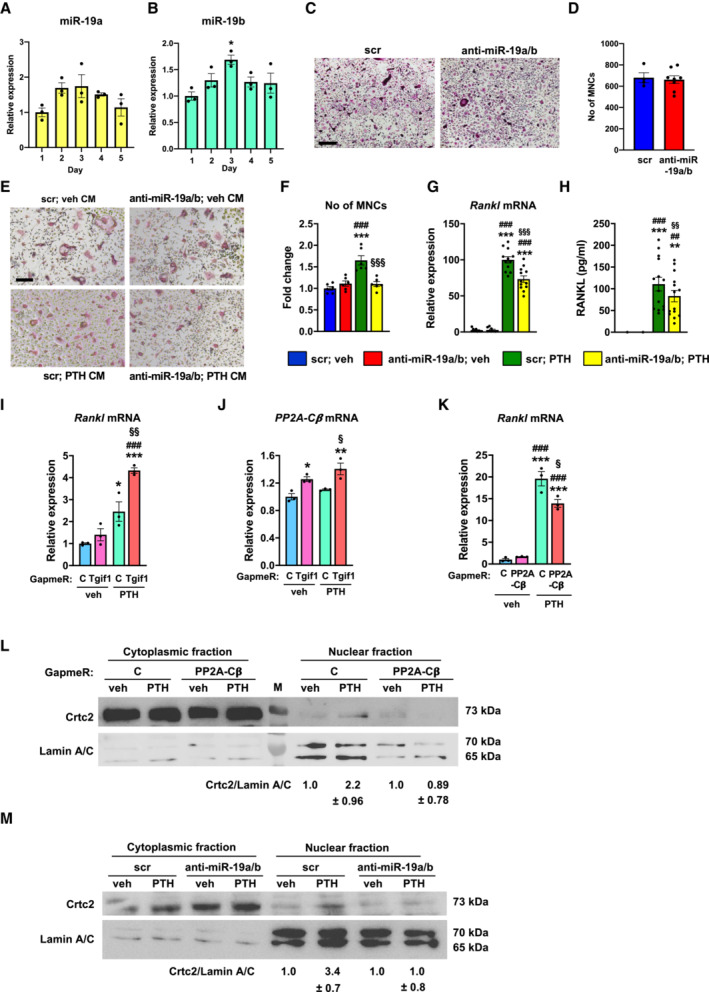
Expression of miR‐19a (A) and miR‐19b (B) during osteoclast differentiation of bone marrow macrophages (n = 3).
- C
Representative images of TRAP‐stained osteoclast cultures of bone marrow cells transfected with scrambled (scr) control oligonucleotide or anti‐miR‐19a/b (representative images of 3 independent experiments). Scale bar indicates 200 μm.
- D
Quantification of multinucleated TRAP‐positive multinucleated cells (MNCs) after 4 days of osteoclast differentiation of bone marrow cells transfected with scr (n = 4) or anti‐miR‐19a/b (n = 8).
- E, F
Representative images (E) and quantification of MNCs (F) after transfection with scr or anti‐miR‐19a/b and stimulation with conditioned medium (CM) collected from Ocy454 cells that were stimulated with vehicle (veh) or PTH (n = 6). Scale bar indicates 200 μm.
- G
Rankl mRNA expression in Ocy454 cells transfected with scr or anti‐miR‐19a/b and stimulated with veh or PTH (n = 12).
- H
Quantification of RANKL protein abundance in CM collected from Ocy454 cells transfected with scr or anti‐miR‐19a/b and stimulated with veh or PTH (n = 14).
- I, J
Expression of Rankl (I) and PP2A‐Cβ (J) mRNA in Ocy454 cells transfected with control GapmeR or GapmeR against Tgif1 and treated with veh or PTH (n = 3).
- K
Rankl mRNA expression in Ocy454 cells transfected with control GapmeR or GapmeR against PP2A‐Cβ and treated with veh or PTH (n = 3).
- L
Immunoblot of Crtc2 protein expression in the cytoplasm and nucleus of Ocy454 cells transfected with control GapmeR or GapmeR against PP2A‐Cβ and stimulated with veh or PTH. Immunoblot for Lamin A/C was used as a loading control and purity control of the nuclear fraction. Normalized fold expression and molecular weight in kilo Dalton (kDa) are indicated (representative image of 3 independent experiments).
- M
Immunoblot of Crtc2 protein expression in the cytoplasm and nucleus of Ocy454 cells transfected with scr or anti‐miR‐19a/b and stimulated with veh or PTH. Immunoblot for Lamin A/C was used as a loading control and purity control of the nuclear fraction. Normalized fold expression and molecular weight in kilo Dalton (kDa) are indicated (representative image of 3 independent experiments).
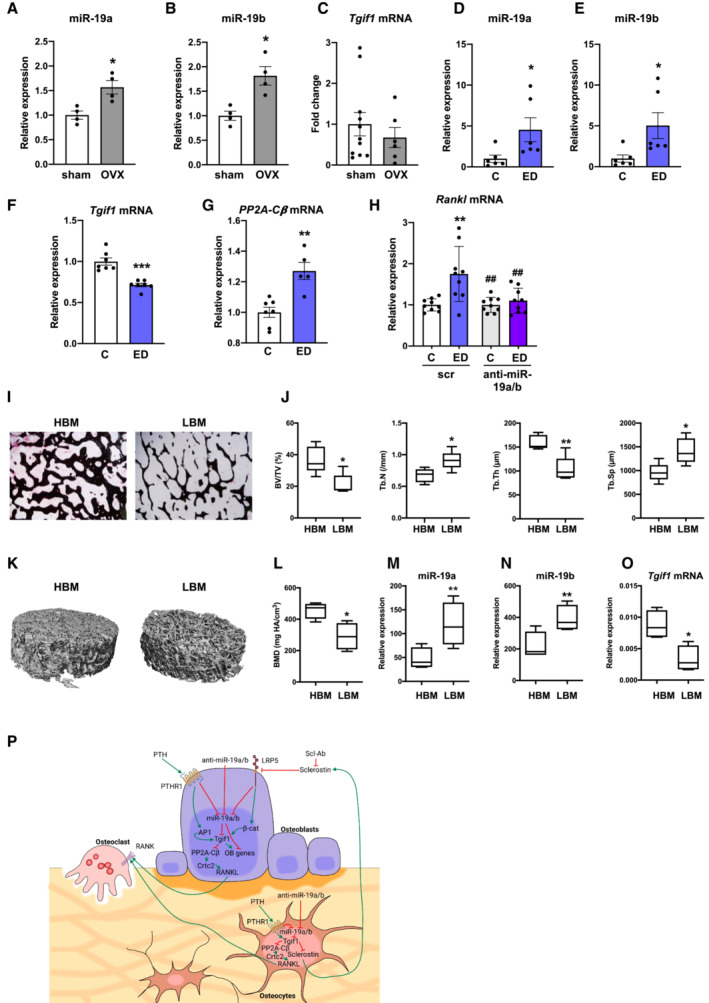
- A, B
Relative miR‐19a (A) and miR‐19b (B) expression in long bones of sham‐operated (n = 4) and ovariectomized (OVX) (n = 4) mice.
- C
Expression of Tgif1 mRNA in long bones of sham‐operated (n = 11) and OVX (n = 6) mice.
- D, E
Relative expression of miR‐19a (D) and miR‐19b (E) in Ocy454 cells upon estrogen deficiency (ED) and control (C) treatment (n = 6).
- F, G
Expression of Tgif1 (F) and PP2A‐Cβ (G) mRNA in Ocy454 cells after control in response to ED (n = 5–7).
- H
Expression of Rankl mRNA in Ocy454 cells transfected with scrambled (scr) control oligonucleotide or anti‐miR‐19a/b in the context of ED (n = 9).
- I
Representative images of von Kossa‐stained human bone samples obtained from nonfractured femoral heads of postmenopausal women after assignment to groups of relatively higher bone mass (HBM, n = 4) and relatively lower bone mass (LBM, n = 4).
- J
Histomorphometric analysis of bone mass (BV/TV, bone volume/tissue volume), Trabecular number (Tb.N/mm), trabecular thickness (Tb.Th), and trabecular separation (Tb.Sp) of the same human bone samples as in (I).
- K, L
Representative μCT images of 3D reconstructed human bone samples (K) and quantification of bone mineral density (BMD) (L). (HBM, n = 4), (LBM, n = 4).
- M, N
Relative expression of miR‐19a (M) and miR‐19b (N) in association with higher and lower bone mass, (HBM, n = 4), (LBM, n = 4).
- O
Expression of Tgif1 mRNA in human bone samples, (HBM, n = 4), (LBM, n = 4).
- P
Schematic model of the mechanism by which miR‐19a/b and anti‐miR‐19a/b treatment affects bone remodeling.
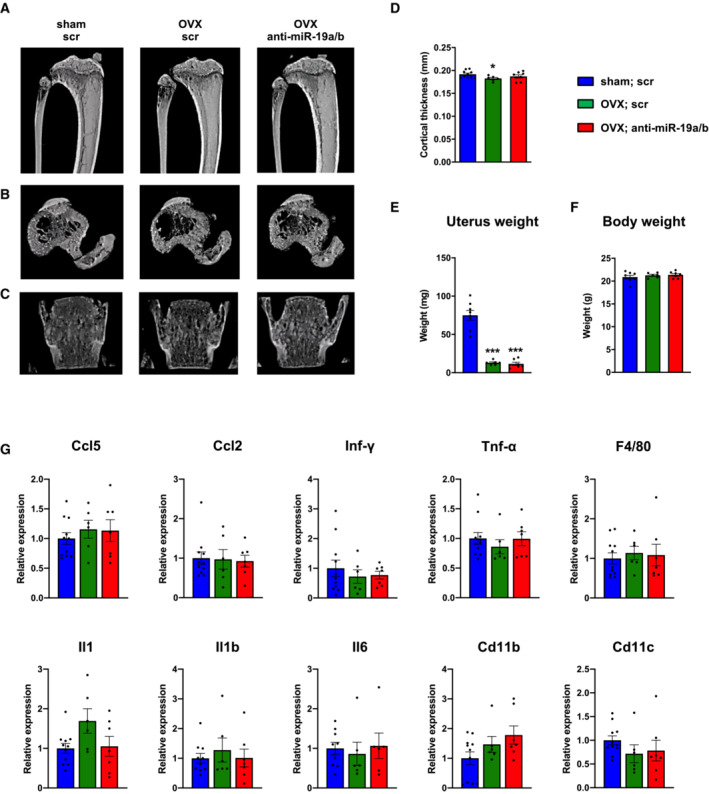
- A–C
(A, B) μCT scans of the proximal tibiae and (C) the fourth lumbar vertebral bodies of female mice in which osteoporosis was induced by ovariectomy (OVX) 21 days before the start of weekly treatment with scrambled control oligonucleotides (scr, n = 6) or anti‐miR‐19a/b (n = 8). Sham‐operated and scr‐treated animals served as controls (n = 10).
- D
Histomorphometric analysis of the cortical thickness at the midshaft femora of the same mice as in (A–C) after termination of the experiment.
- E, F
(E) Uterus weight and (F) body weight of female mice after sham operation (n = 8) or ovariectomy (OVX) and 7 weeks of treatment with scr (n = 6) or anti‐miR‐19a/b (n = 7).
- G
mRNA expression of inflammatory markers Ccl5, Ccl2, Interferon gamma (Inf‐γ), Tumor necrosis factor alpha (Tnf‐α), F4/80, Interleukin 1 (Il1), Interleukin 1b (Il1b), Interleukin 6 (Il6), cluster of differentiation 11b (Cd11b) and cluster of differentiation 11c (Cd11c) in tibiae of sham‐operated scr‐treated mice (n = 11) and OVX mice treated with scr (n = 6) or anti‐miR‐19a/b (n = 7).
References
-
- Bilezikian JP, Matsumoto T, Bellido T, Khosla S, Martin J, Recker RR, Heaney R, Seeman E, Papapoulos S, Goldring SR (2009) Targeting bone remodeling for the treatment of osteoporosis: summary of the proceedings of an ASBMR workshop. J Bone Miner Res 24: 373–385 - PubMed
-
- Bouchie A (2013) First microRNA mimic enters clinic. Nat Biotechnol 31: 577 - PubMed
Publication types
MeSH terms
Substances
LinkOut - more resources
Full Text Sources
Other Literature Sources
Medical
Molecular Biology Databases
Research Materials
Miscellaneous
