What Is the Normal Trajectory of C-Reactive Protein, Erythrocyte Sedimentation Rate, Plasma Fibrinogen and D-Dimer after Two-Stage Exchange for Periprosthetic Joint Infection?
- PMID: 36193876
- PMCID: PMC9627072
- DOI: 10.1111/os.13533
What Is the Normal Trajectory of C-Reactive Protein, Erythrocyte Sedimentation Rate, Plasma Fibrinogen and D-Dimer after Two-Stage Exchange for Periprosthetic Joint Infection?
Abstract
Objective: C-reactive protein (CRP), erythrocyte sedimentation rate (ESR), plasma fibrinogen and D-Dimer are used as diagnostic biomarkers of prosthetic joint infection (PJI) after total joint arthroplasty (TJA). The purpose of the study was to investigate the normal trajectory of CRP, ESR, plasma fibrinogen and D-Dimer at different time points after two-stage exchange arthroplasty for PJI.
Methods: We studied 53 patients undergoing two-stage exchange for PJI at five time points: preoperatively (T0), duration of hospital stays (T1), 30 days (T2), 30-90 days (T3), and 90-180 days (T4) after surgery. The medical records of all patients were well documented and carefully reviewed. The Shapiro-Wilk test was utilized to compare the normal distribution for continuous variables, and the nonnormally distributed data were used for Friedmann's one-way repeat measures analysis of variances. Post hoc Dunnett's test was used to compare each pair of data to find differences from baseline.
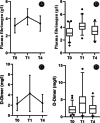
Results: Compare with T0 point, the levels of CRP and ESR increased significantly and reached peak values at T1 point (all P < 0.001), with median values of 56.40 mg/L (range, 5.54-161.0 mg/L) and 49.00 mm/h (range, 13.00-113.0 mm/h), respectively. In addition, the levels of plasma fibrinogen and D-Dimer increased significantly and reached peak values at T1 point (all P < 0.001), with median values of 4.13g/L (range, 2.27-6.80 mg/L) and 4.00 mg/L (range, 0.19-14.01 mg/L), respectively. CRP and ESR rapidly declined at the T2 point with significantly compared with T0 point (P = 0.001 and P < 0.001). The levels of CRP, ESR, plasma fibrinogen and D-Dimer returned to preoperative levels of 5.23 mg/L (range, 1.01-21.70 mg/L), 19.00 mm/h (range, 6.00-60.00 mm/h), 3.38g/L (range, 1.71-5.10 g/L) and 2.33 mm/h (range, 0.19-6.87 mg/L) at T4 point, and there was no significant difference compared with T0 point (all P > 0.05).
Conclusions: The study demonstrated the normal trajectory of CRP, ESR, plasma fibrinogen and D-Dimer at five time points in patients who underwent two-stage exchange for PJI. Thus, the results have the possibility of providing signs of infection after the patient receives two-stage exchange arthroplasty for PJI, which can benefit from early treatment.
Keywords: C-reactive protein; D-Dimer; Erythrocyte sedimentation rate; Plasma fibrinogen; Prosthetic joint infection; Total joint arthroplasty.
© 2022 The Authors. Orthopaedic Surgery published by Tianjin Hospital and John Wiley & Sons Australia, Ltd.
Figures


Similar articles
-
Plasma D-dimer Does Not Anticipate the Fate of Reimplantation in Two-stage Exchange Arthroplasty for Periprosthetic Joint Infection: A Preliminary Investigation.Clin Orthop Relat Res. 2021 Jul 1;479(7):1458-1468. doi: 10.1097/CORR.0000000000001738. Clin Orthop Relat Res. 2021. PMID: 33830953 Free PMC article.
-
[Diagnostic value of D-dimer for chronic periprosthetic infection after hip and knee joint replacement].Zhonghua Wai Ke Za Zhi. 2020 Jun 1;58(6):464-468. doi: 10.3760/cma.j.cn112139-20191106-00550. Zhonghua Wai Ke Za Zhi. 2020. PMID: 32498487 Chinese.
-
Which serum markers predict the success of reimplantation after periprosthetic joint infection?J Orthop Traumatol. 2022 Sep 16;23(1):45. doi: 10.1186/s10195-022-00664-5. J Orthop Traumatol. 2022. PMID: 36112243 Free PMC article.
-
Non-Tuberculosis Mycobacterium Periprosthetic Joint Infections Following Total Hip and Knee Arthroplasty: Case Series and Review of the Literature.Orthop Surg. 2023 Jun;15(6):1488-1497. doi: 10.1111/os.13661. Epub 2023 May 8. Orthop Surg. 2023. PMID: 37154097 Free PMC article. Review.
-
Role of D-dimer and Fibrinogen in the Diagnosis of Periprosthetic Joint Infection: A Systematic Review and Meta-Analysis.Orthop Surg. 2021 May;13(3):692-700. doi: 10.1111/os.12969. Epub 2021 Mar 7. Orthop Surg. 2021. PMID: 33682337 Free PMC article.
Cited by
-
Population Pharmacokinetics and Pharmacodynamics of Dalbavancin and C-Reactive Protein in Patients with Staphylococcal Osteoarticular Infections.Clin Pharmacokinet. 2024 Sep;63(9):1271-1282. doi: 10.1007/s40262-024-01410-2. Epub 2024 Aug 22. Clin Pharmacokinet. 2024. PMID: 39172334 Free PMC article.
References
-
- Bozic KJ, Kurtz SM, Lau E, Ong K, Vail TP, Berry DJ. The epidemiology of revision total hip arthroplasty in the United States. J Bone Jt Surg. 2009;91:128–33. - PubMed
-
- Vahedi H, Aali‐Rezaie A, Shahi A, Conway JD. Irrigation, débridement, and implant retention for recurrence of periprosthetic joint infection following two‐stage revision total knee arthroplasty: a matched cohort study. J Arthroplasty. 2019;34:1772–5. - PubMed
-
- van den Kieboom J, Tirumala V, Box H, Oganesyan R, Klemt C, Kwon YM. One‐stage revision is as effective as two‐stage revision for chronic culture‐negative periprosthetic joint infection after total hip and knee arthroplasty. Bone Joint J. 2021;103:515–21. - PubMed
MeSH terms
Substances
Grants and funding
LinkOut - more resources
Full Text Sources
Medical
Research Materials
Miscellaneous

