. 2022 Nov 30;222(4):iyac151.
doi: 10.1093/genetics/iyac151.

The contribution of sex chromosome conflict to disrupted spermatogenesis in hybrid house mice

Affiliations

The contribution of sex chromosome conflict to disrupted spermatogenesis in hybrid house mice

Emily E K Kopania et al. Genetics. .

Abstract

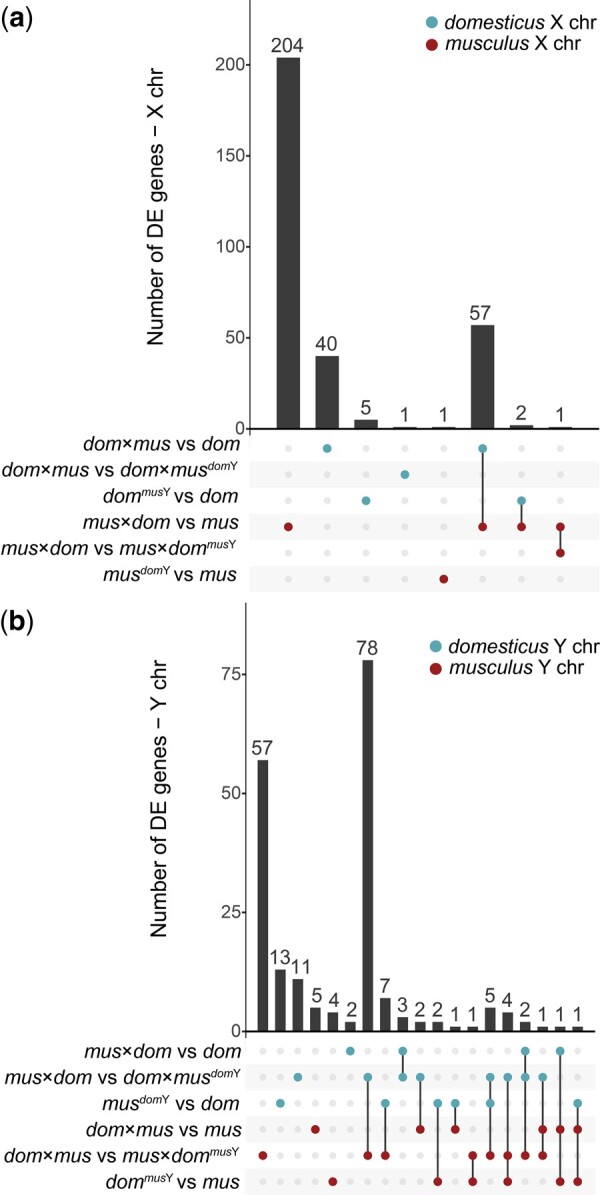
Incompatibilities on the sex chromosomes are important in the evolution of hybrid male sterility, but the evolutionary forces underlying this phenomenon are unclear. House mice (Mus musculus) lineages have provided powerful models for understanding the genetic basis of hybrid male sterility. X chromosome-autosome interactions cause strong incompatibilities in M. musculus F1 hybrids, but variation in sterility phenotypes suggests a more complex genetic basis. In addition, XY chromosome conflict has resulted in rapid expansions of ampliconic genes with dosage-dependent expression that is essential to spermatogenesis. Here, we evaluated the contribution of XY lineage mismatch to male fertility and stage-specific gene expression in hybrid mice. We performed backcrosses between two house mouse subspecies to generate reciprocal Y-introgression strains and used these strains to test the effects of XY mismatch in hybrids. Our transcriptome analyses of sorted spermatid cells revealed widespread overexpression of the X chromosome in sterile F1 hybrids independent of Y chromosome subspecies origin. Thus, postmeiotic overexpression of the X chromosome in sterile F1 mouse hybrids is likely a downstream consequence of disrupted meiotic X-inactivation rather than XY gene copy number imbalance. Y chromosome introgression did result in subfertility phenotypes and disrupted expression of several autosomal genes in mice with an otherwise nonhybrid genomic background, suggesting that Y-linked incompatibilities contribute to reproductive barriers, but likely not as a direct consequence of XY conflict. Collectively, these findings suggest that rapid sex chromosome gene family evolution driven by genomic conflict has not resulted in strong male reproductive barriers between these subspecies of house mice.

Keywords: FACS; ampliconic genes; hybrid male sterility; intragenomic conflict; sex chromosomes; speciation; testis expression.


Figures

Fig. 1.
Fig. 1.
Experimental design. a) Backcrosses used to generate Y-introgression mouse strains. We performed 10 generations of backcrosses in reciprocal directions to generate mice with a M. musculus domesticus (domesticus) genetic background and M. musculus musculus (musculus) Y chromosome (domesticusmusY) and mice with a musculus genetic background and domesticus Y chromosome (musculusdomY). The thin horizontal line on the autosomes represents residual autosomal introgression, which is theoretically expected to represent about 0.1% of the autosomes. b) Crosses were performed with Y-introgression mice to produce two types of experimental F1 mice. For Hybrid F1 XY Match, we crossed Y-introgression males to females from the other subspecies to generate F1 mice with hybrid autosomes but matched sex chromosomes. For Nonhybrid XY Mismatch, we crossed Y-introgression males to females from a different strain but the same subspecies to generate F1 mice with XY mismatch and nonhybrid autosomes. Autos, autosomes; X, X chromosome; Y, Y chromosome.
Fig. 2.
Fig. 2.
Copy number estimates for ampliconic gene families in wild mice, wild-derived inbred strains, and Y-introgression strains. Copy number was estimated using a 97% identity cutoff for paralogs. a–d) Copy numbers in male mice, with Y chromosome genes on the y-axis and their X chromosome homologs on the x-axis. Image (e) includes both males and females and shows haploid copy number for the autosomal gene family α-takusan on the y-axis and haploid copy number for the X-linked family Slx on the x-axis. Note that images (a) and (b) show the same information on the y-axis and images (c) and (d) show the same information on the x-axis to compare copy numbers for ampliconic gene families that have two different homologous gene families on the opposite sex chromosome. Correlations and P-values are based on a Pearson’s correlation test. P-values were FDR corrected for multiple tests.
Fig. 3.
Fig. 3.
a) Relative testes mass (mg/g), b) sperm nucleus bounding width (µm), and c) sperm nucleus bounding height (µm) by cross type. Letters above each violin plot indicate significant differences (FDR-corrected P < 0.05) based on a Welch’s t-test (relative testes mass) or Wilcoxon rank-sum test (bounding width and height). Sample size for each cross type is indicated below each violin plot. Bounding width and height sample sizes indicate the number of sperm nuclei observed. Representative sperm nuclei morphologies for each cross type are depicted above each violin plot in (b).
Fig. 4.
Fig. 4.
Normalized expression levels of Slx (a), Slxl1 (b), Sly (c), Ssty1 (d), Ssty2 (e), and α-takusan (f) ampliconic gene families in different cross types plotted against their copy numbers. Copy number estimates are based on estimates from wild-derived strains used in experimental and control crosses (see Fig. 2). Cross types with the same sex chromosome and therefore same copy number estimate are jittered slightly along the x-axis for clarity. Expression level was calculated by summing TPM for each paralog of the gene family with at least 97% sequence identity to the ampliconic gene. Points represent values for individual samples, and lines indicate median and standard deviation for each cross type.
Fig. 5.
Fig. 5.
Histograms of relative expression levels between experimental cross types and control mice. a–c) Contrasts that all have a musculus X chromosome, d–f) contrasts with a domesticus Y chromosome, g–i) contrasts with a musculus Y chromosome, and j–l) contrasts with a domesticus X chromosome. Images (a)–(f) represent sex chromosome mismatch present in sterile hybrids (musculus X and domesticus Y), while images (g)–(l) represent sex chromosome mismatch present in more fertile hybrids (domesticus X and musculus Y). The first column (a, d, g, and j) shows data reanalyzed from (Larson et al. 2017). The second column (b, e, h, and k) tests if gene expression levels are rescued when the sex chromosomes are matched but on a hybrid autosomal background (Hybrid F1 XY Match). The third column (c, f, i, and l) tests for disrupted expression due to sex chromosome mismatch alone, on a nonhybrid autosomal background (Nonhybrid XY Mismatch). The y-axis shows the difference in normalized expression levels between the two cross types being compared. The x-axis shows the proportion of genes in each expression difference bin. Black bars represent the autosomes, purple bars represent the X chromosome, and green bars represent the Y chromosome. Letters indicate significant differences in median expression differences among the chromosome types based on a Mann–Whitney U test (FDR-corrected P < 0.05).
Fig. 6.
Fig. 6.
Upset plots showing the number of DE genes in each cross type comparison, and genes that are DE across multiple comparisons. a) DE genes on the X chromosome. b) DE genes on the Y chromosome. Bars corresponding to multiple dots connected by lines indicate genes that are DE across multiple comparisons. Bars corresponding to single dots indicate genes that are DE in only one comparison. The top three contrasts involve comparisons on the domesticus X chromosome (a) or domesticus Y chromosome (b), and the bottom three contrasts involve comparisons on the musculus X chromosome (a) or musculus Y chromosome (b). Genes that were DE in opposite directions across multiple comparisons of the same sex chromosome were excluded.
Fig. 7.
Fig. 7.
Example WGCNA module eigengene values plotted by cross type. Note that WGCNA was performed separately for each experiment, so there is not necessarily a relationship between Hybrid F1 XY Match and Nonhybrid XY Mismatch modules with the same number. Modules that were significantly associated with cross types are also labeled based on these associations (a, b, and d). Other modules shown were not significantly associated with a cross type but trended toward an association with X-autosomal background by Y chromosome type interaction and were enriched for DE genes in at least one comparison (c, e, and f; Table 3). Letters indicate significant differences in module association based on linear models with post hoc Tukey tests (P < 0.05).

Similar articles

Cited by

References

    1. Baker CL, Kajita S, Walker M, Saxl RL, Raghupathy N, Choi K, Petkov PM, Paigen K.. PRDM9 drives evolutionary erosion of hotspots in Mus musculus through haplotype-specific initiation of meiotic recombination. PLoS Genet. 2015;11(1):e1004916. - PMC - PubMed
    1. Balcova M, Faltusova B, Gergelits V, Bhattacharyya T, Mihola O, Trachtulec Z, Knopf C, Fotopulosova V, Chvatalova I, Gregorova S, et al.Hybrid sterility locus on chromosome X controls meiotic recombination rate in mouse. PLoS Genet. 2016;12(4):e1005906. - PMC - PubMed
    1. Bellott DW, Skaletsky H, Cho T-J, Brown L, Locke D, Chen N, Galkina S, Pyntikova T, Koutseva N, Graves T, et al.Avian W and mammalian Y chromosomes convergently retained dosage-sensitive regulators. Nat Genet. 2017;49(3):387–394. - PMC - PubMed
    1. Bhattacharyya T, Gregorova S, Mihola O, Anger M, Sebestova J, Denny P, Simecek P, Forejt J.. Mechanistic basis of infertility of mouse intersubspecific hybrids. Proc Natl Acad Sci U S A. 2013;110(6):E468–E477. - PMC - PubMed
    1. Bhattacharyya T, Reifova R, Gregorova S, Simecek P, Gergelits V, Mistrik M, Martincova I, Pialek J, Forejt J.. X chromosome control of meiotic chromosome synapsis in mouse inter-subspecific hybrids. PLoS Genet. 2014;10(2):e1004088. - PMC - PubMed

Publication types