

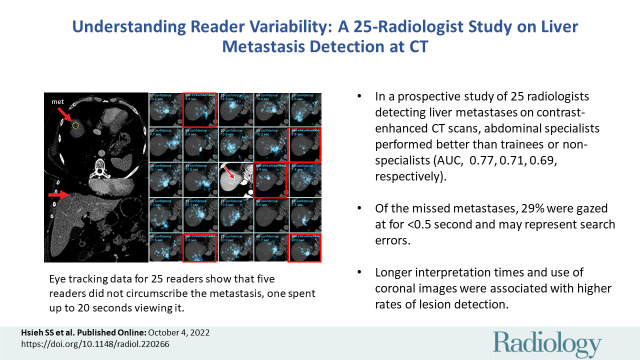
Understanding Reader Variability: A 25-Radiologist Study on Liver Metastasis Detection at CT
- PMID: 36194112
- PMCID: PMC9870852
- DOI: 10.1148/radiol.220266
Understanding Reader Variability: A 25-Radiologist Study on Liver Metastasis Detection at CT
Abstract
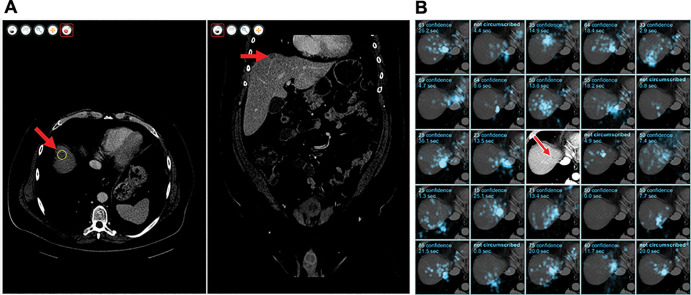
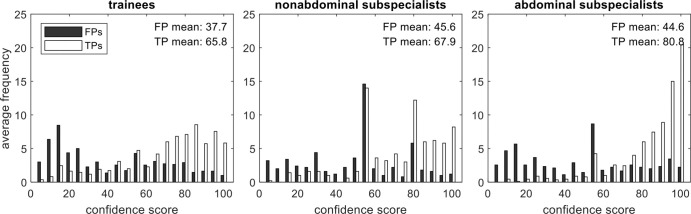
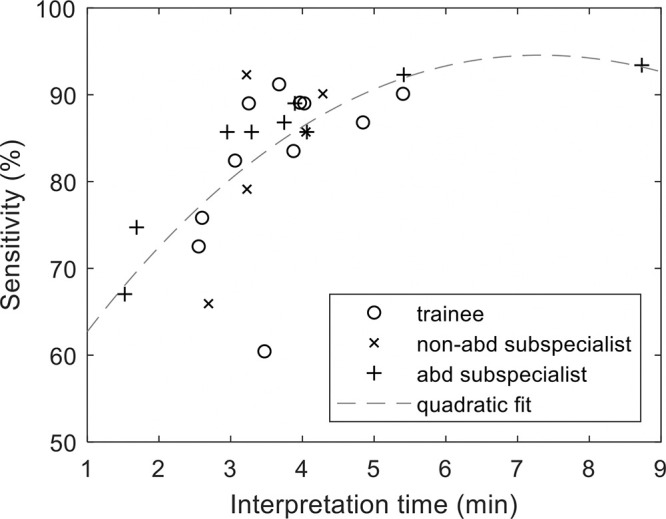
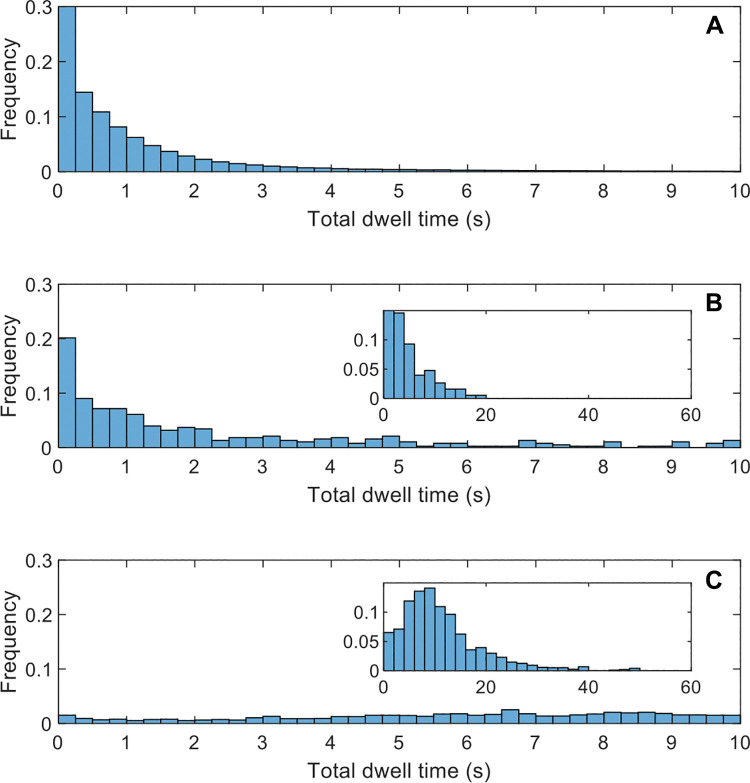
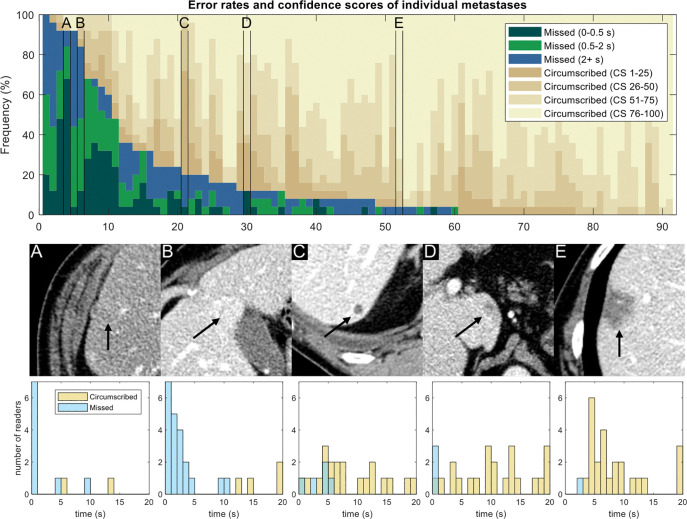
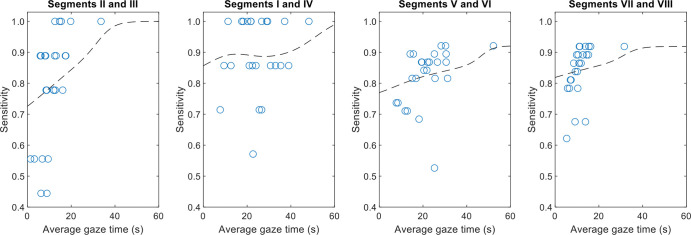
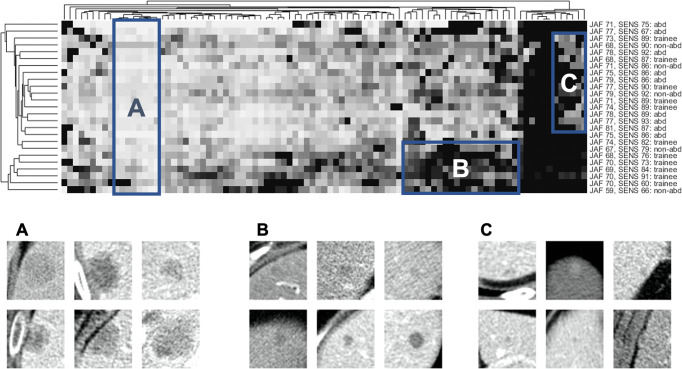
Background Substantial interreader variability exists for common tasks in CT imaging, such as detection of hepatic metastases. This variability can undermine patient care by leading to misdiagnosis. Purpose To determine the impact of interreader variability associated with (a) reader experience, (b) image navigation patterns (eg, eye movements, workstation interactions), and (c) eye gaze time at missed liver metastases on contrast-enhanced abdominal CT images. Materials and Methods In a single-center prospective observational trial at an academic institution between December 2020 and February 2021, readers were recruited to examine 40 contrast-enhanced abdominal CT studies (eight normal, 32 containing 91 liver metastases). Readers circumscribed hepatic metastases and reported confidence. The workstation tracked image navigation and eye movements. Performance was quantified by using the area under the jackknife alternative free-response receiver operator characteristic (JAFROC-1) curve and per-metastasis sensitivity and was associated with reader experience and image navigation variables. Differences in area under JAFROC curve were assessed with the Kruskal-Wallis test followed by the Dunn test, and effects of image navigation were assessed by using the Wilcoxon signed-rank test. Results Twenty-five readers (median age, 38 years; IQR, 31-45 years; 19 men) were recruited and included nine subspecialized abdominal radiologists, five nonabdominal staff radiologists, and 11 senior residents or fellows. Reader experience explained differences in area under the JAFROC curve, with abdominal radiologists demonstrating greater area under the JAFROC curve (mean, 0.77; 95% CI: 0.75, 0.79) than trainees (mean, 0.71; 95% CI: 0.69, 0.73) (P = .02) or nonabdominal subspecialists (mean, 0.69; 95% CI: 0.60, 0.78) (P = .03). Sensitivity was similar within the reader experience groups (P = .96). Image navigation variables that were associated with higher sensitivity included longer interpretation time (P = .003) and greater use of coronal images (P < .001). The eye gaze time was at least 0.5 and 2.0 seconds for 71% (266 of 377) and 40% (149 of 377) of missed metastases, respectively. Conclusion Abdominal radiologists demonstrated better discrimination for the detection of liver metastases on abdominal contrast-enhanced CT images. Missed metastases frequently received at least a brief eye gaze. Higher sensitivity was associated with longer interpretation time and greater use of liver display windows and coronal images. © RSNA, 2022 Online supplemental material is available for this article.
Conflict of interest statement
Figures
References
-
- Mileto A , Guimaraes LS , McCollough CH , Fletcher JG , Yu L . State of the art in abdominal CT: the limits of iterative reconstruction algorithms . Radiology 2019. ; 293 ( 3 ): 491 – 503 . - PubMed
-
- Patel AG , Pizzitola VJ , Johnson CD , Zhang N , Patel MD . Radiologists make more errors interpreting off-hours body CT studies during overnight assignments as compared with daytime assignments . Radiology 2020. ; 297 ( 2 ): 374 – 379 . - PubMed
-
- Ruutiainen AT , Durand DJ , Scanlon MH , Itri JN . Increased error rates in preliminary reports issued by radiology residents working more than 10 consecutive hours overnight . Acad Radiol 2013. ; 20 ( 3 ): 305 – 311 . - PubMed
-
- Branstetter BF 4th , Morgan MB , Nesbit CE , et al . Preliminary reports in the emergency department: is a subspecialist radiologist more accurate than a radiology resident? Acad Radiol 2007. ; 14 ( 2 ): 201 – 206 . - PubMed
Publication types
MeSH terms
Grants and funding
LinkOut - more resources
Full Text Sources
Medical
