

Retention, Fasting Patterns, and Weight Loss With an Intermittent Fasting App: Large-Scale, 52-Week Observational Study
- PMID: 36194463
- PMCID: PMC9579929
- DOI: 10.2196/35896
Retention, Fasting Patterns, and Weight Loss With an Intermittent Fasting App: Large-Scale, 52-Week Observational Study
Abstract
Background: Intermittent fasting (IF) is an increasingly popular approach to dietary control that focuses on the timing of eating rather than the quantity and content of caloric intake. IF practitioners typically seek to improve their weight and other health factors. Millions of practitioners have turned to purpose-built mobile apps to help them track and adhere to their fasts and monitor changes in their weight and other biometrics.
Objective: This study aimed to quantify user retention, fasting patterns, and weight loss by users of 2 IF mobile apps. We also sought to describe and model starting BMI, amount of fasting, frequency of weight tracking, and other demographics as correlates of retention and weight change.
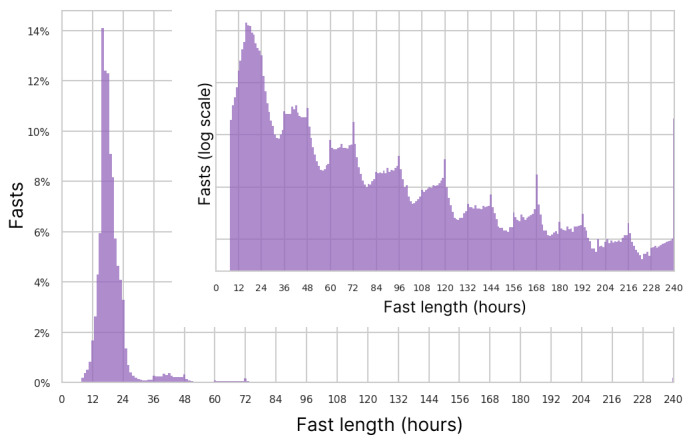
Methods: We assembled height, weight, fasting, and demographic data of adult users (ages 18-100 years) of the LIFE Fasting Tracker and LIFE Extend apps from 2018 to 2020. Retention for up to 52 weeks was quantified based on recorded fasts and correlated with user demographics. Users who provided height and at least 2 readings of weight and whose first fast and weight records were contemporaneous were included in the weight loss analysis. Fasting was quantified as extended fasting hours (EFH; hours beyond 12 in a fast) averaged per day (EFH per day). Retention was modeled using a Cox proportional hazards regression. Weight loss was analyzed using linear regression.
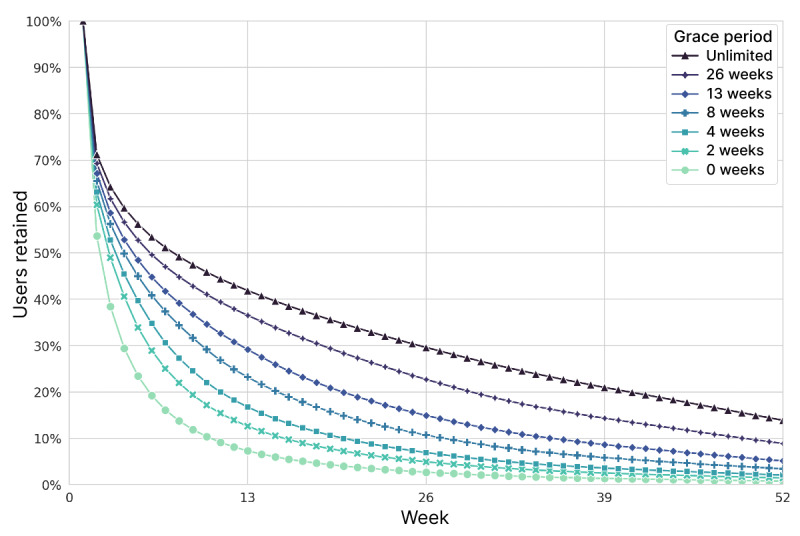
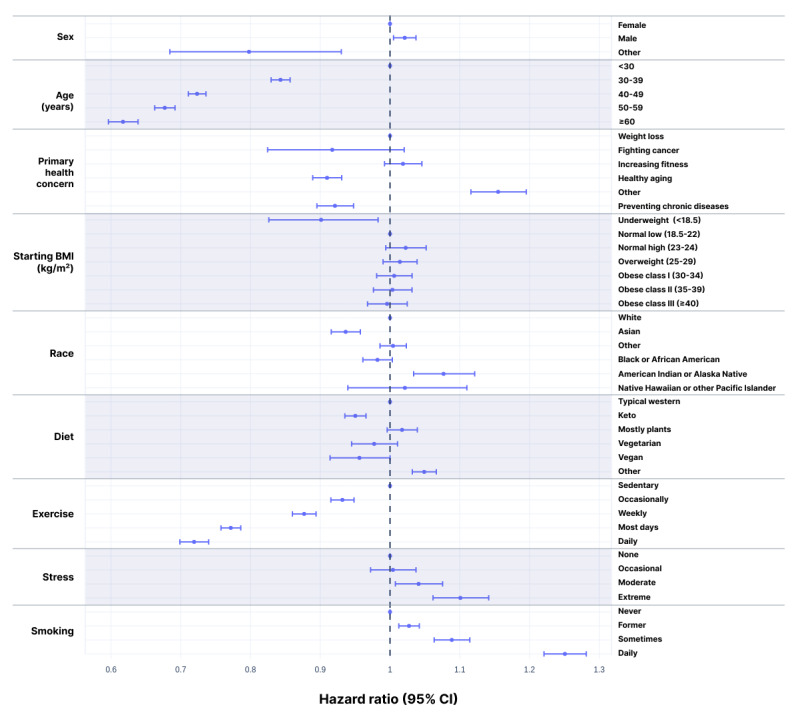
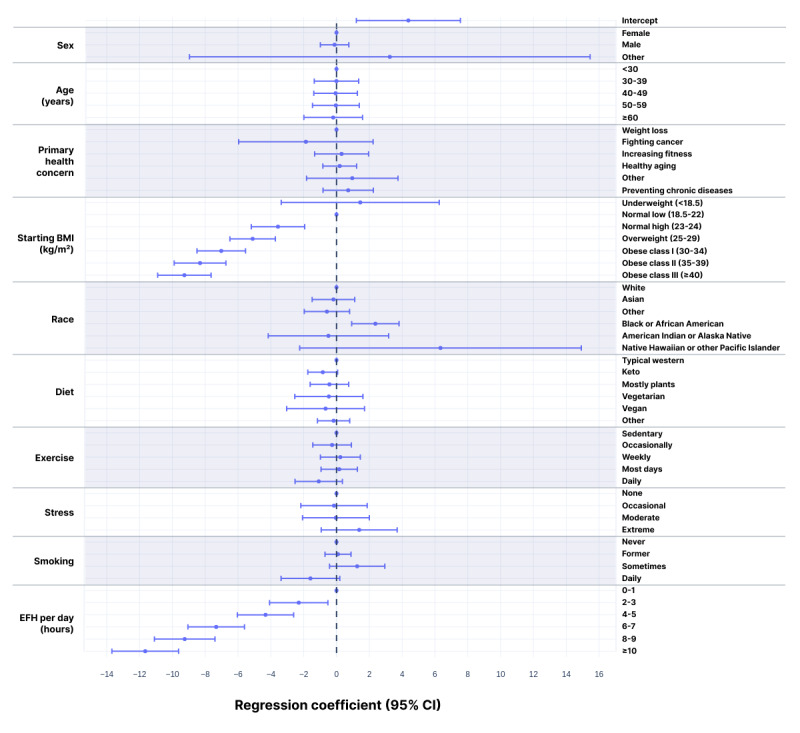
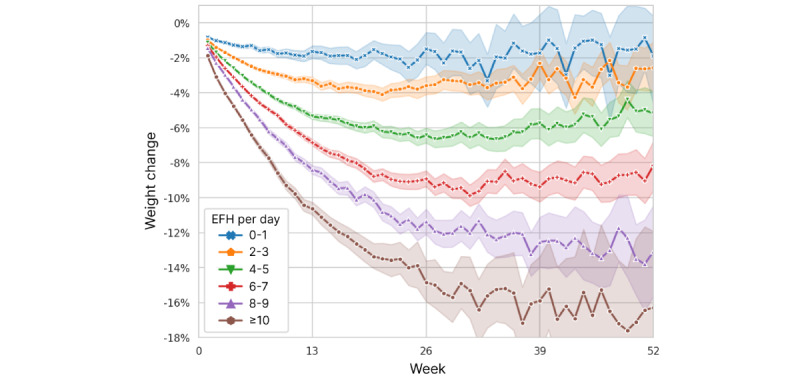
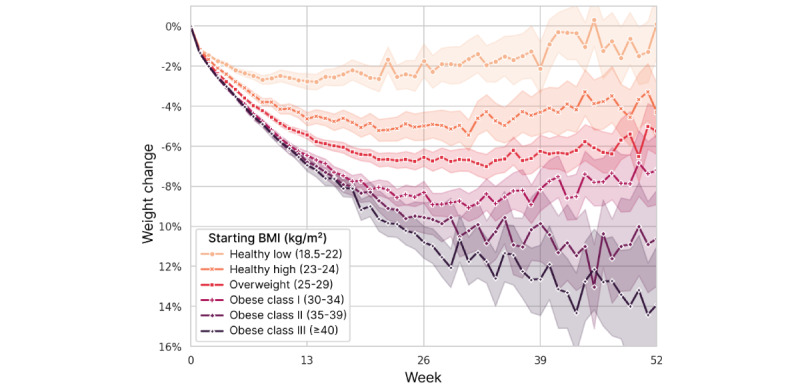
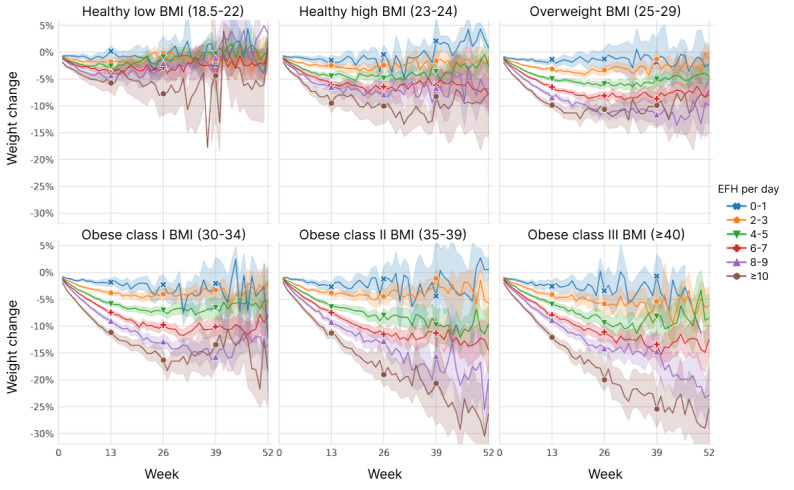
Results: A total of 792,692 users were followed for retention based on 26 million recorded fasts. Of these, 132,775 (16.7%) users were retained at 13 weeks, 54,881 (6.9%) at 26 weeks, and 16,478 (2.1%) at 52 weeks, allowing 4 consecutive weeks of inactivity. The survival analysis using Cox regression indicated that retention was positively associated with age and exercise and negatively associated with stress and smoking. Weight loss in the qualifying cohort (n=161,346) was strongly correlated with starting BMI and EFH per day, which displayed a positive interaction. Users with a BMI ≥40 kg/m2 lost 13.9% of their starting weight by 52 weeks versus a slight weight gain on average for users with starting BMI <23 kg/m2. EFH per day was an approximately linear predictor of weight loss. By week 26, users lost over 1% of their starting weight per EFH per day on average. The regression analysis using all variables was highly predictive of weight change at 26 weeks (R2=0.334) with starting BMI and EFH per day as the most significant predictors.
Conclusions: IF with LIFE mobile apps appears to be a sustainable approach to weight reduction in the overweight and obese population. Healthy weight and underweight individuals do not lose much weight on average, even with extensive fasting. Users who are obese lose substantial weight over time, with more weight loss in those who fast more.
Keywords: diet trackers; intermittent fasting; mobile apps; obesity; retention; time-restricted eating; weight loss.
©Luisa Torres, Joy L Lee, Seho Park, R Christian Di Lorenzo, Jonathan P Branam, Shelagh A Fraser, Benjamin A Salisbury. Originally published in JMIR mHealth and uHealth (https://mhealth.jmir.org), 04.10.2022.
Conflict of interest statement
Conflicts of Interest: BAS, LT, RCD, JPB, and SF are or were employees of LifeOmic, the makers of the apps studied in this paper, and they have ownership rights in the company. No one at LifeOmic other than the authors had any editorial oversight in performing this study or writing this paper.
Figures
References
-
- Ritchie H, Roser M. Obesity. Our World in Data. 2017. Aug 11, [2021-12-08]. https://ourworldindata.org/obesity .
-
- FastStats. Centers for Disease Control and Prevention. 2021. [2021-12-08]. https://www.cdc.gov/nchs/fastats/obesity-overweight.htm .
-
- Kalam F, Gabel K, Cienfuegos S, Wiseman E, Ezpeleta M, Steward M, Pavlou V, Varady KA. Alternate day fasting combined with a low-carbohydrate diet for weight loss, weight maintenance, and metabolic disease risk reduction. Obes Sci Pract. 2019 Dec;5(6):531–9. doi: 10.1002/osp4.367. https://europepmc.org/abstract/MED/31890243 OSP4367 - DOI - PMC - PubMed
-
- Cienfuegos S, Gabel K, Kalam F, Ezpeleta M, Wiseman E, Pavlou V, Lin S, Oliveira ML, Varady KA. Effects of 4- and 6-h time-restricted feeding on weight and cardiometabolic health: a randomized controlled trial in adults with obesity. Cell Metab. 2020 Sep 01;32(3):366–78.e3. doi: 10.1016/j.cmet.2020.06.018. https://linkinghub.elsevier.com/retrieve/pii/S1550-4131(20)30319-3 S1550-4131(20)30319-3 - DOI - PMC - PubMed
Publication types
MeSH terms
LinkOut - more resources
Full Text Sources
Miscellaneous
