
Androgen receptor activity in prostate cancer dictates efficacy of bipolar androgen therapy through MYC

Laura A Sena et al. J Clin Invest. .

Abstract

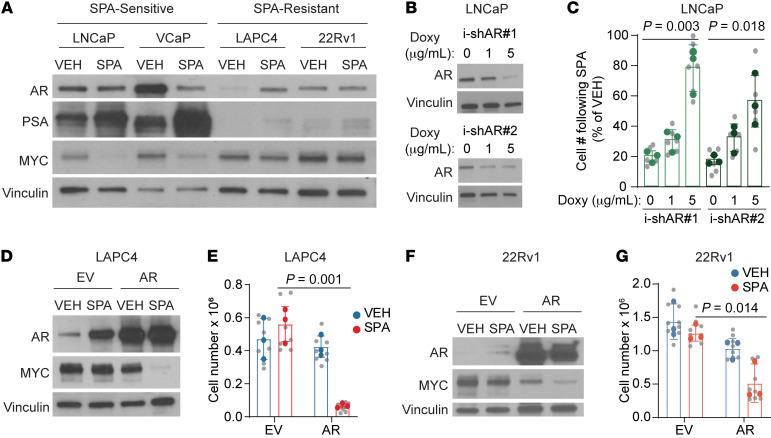
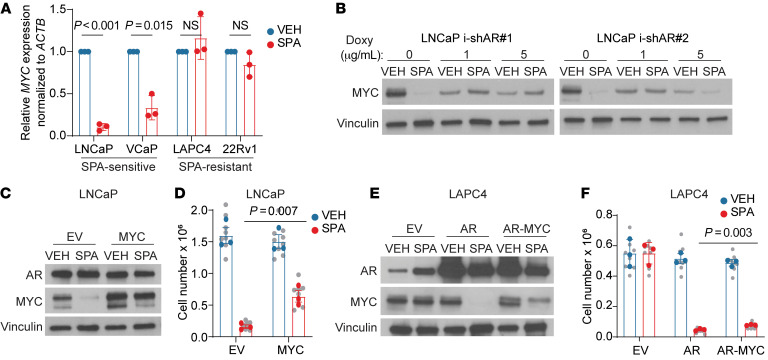
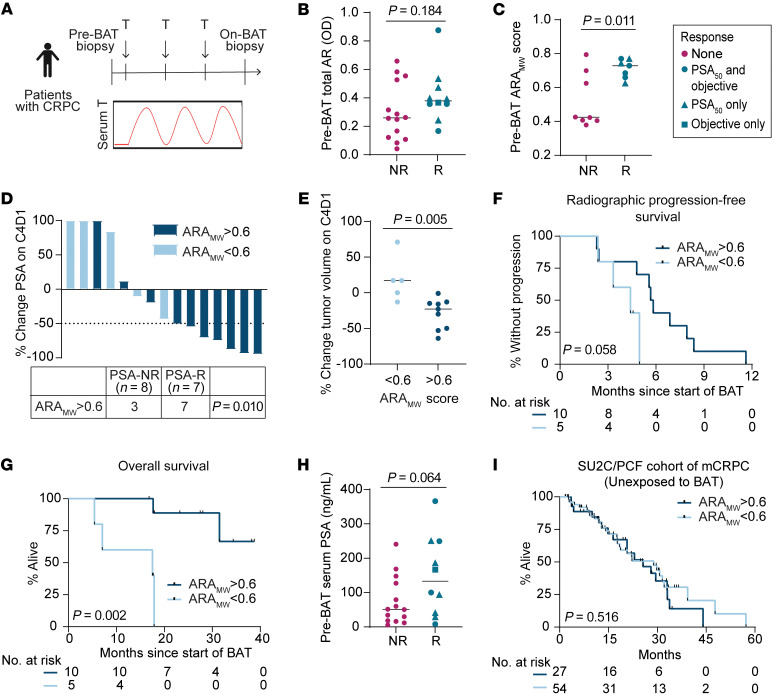
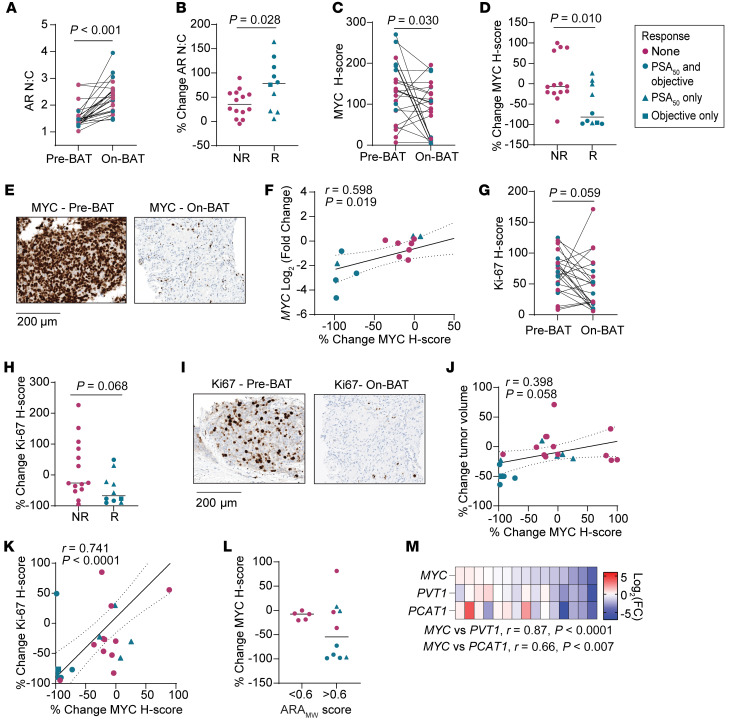
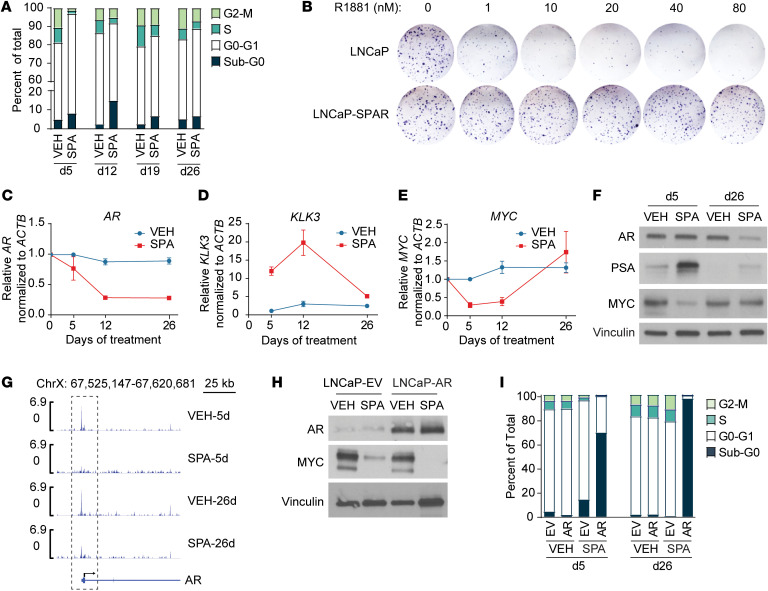
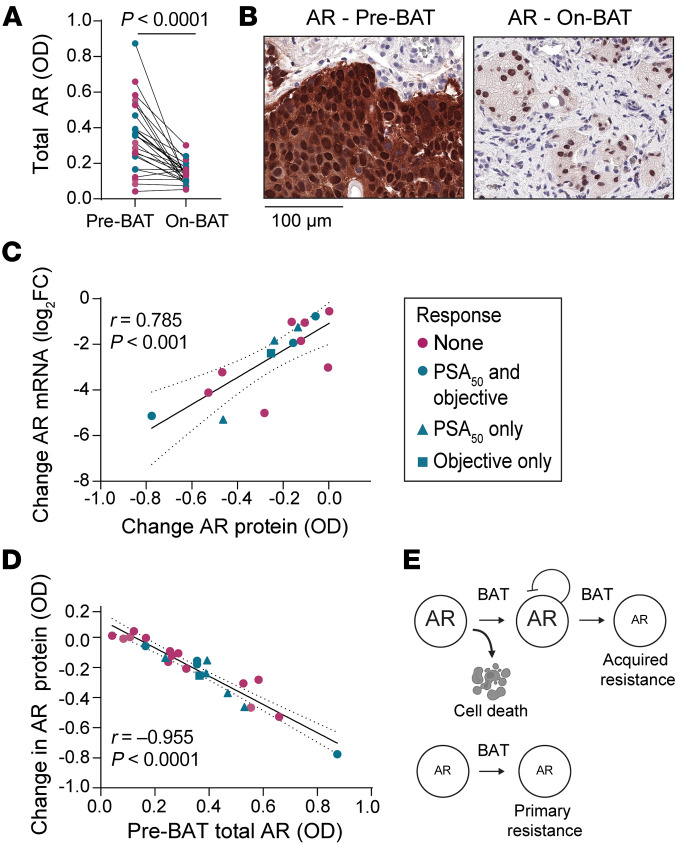
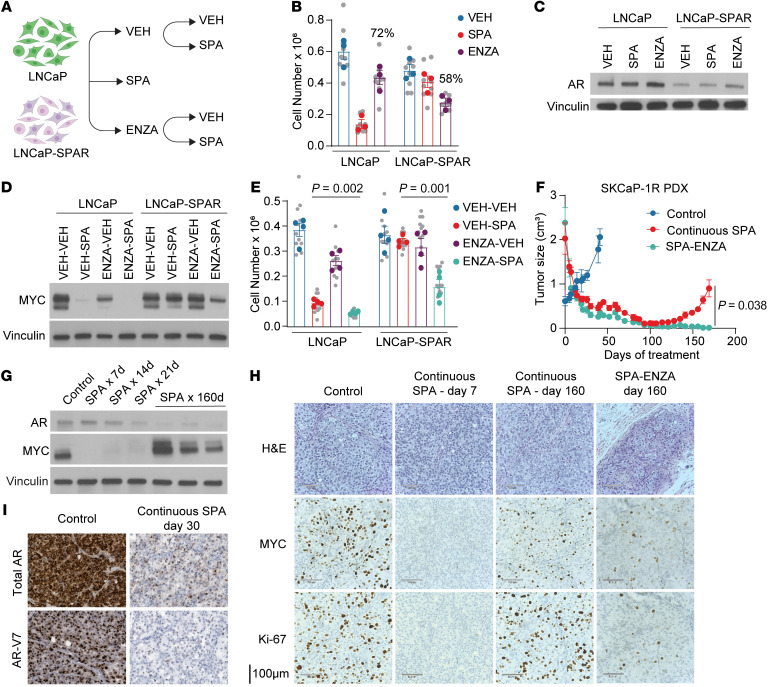
Testosterone is the canonical growth factor of prostate cancer but can paradoxically suppress its growth when present at supraphysiological levels. We have previously demonstrated that the cyclical administration of supraphysiological androgen (SPA), termed bipolar androgen therapy (BAT), can result in tumor regression and clinical benefit for patients with castration-resistant prostate cancer. However, predictors and mechanisms of response and resistance have been ill defined. Here, we show that growth inhibition of prostate cancer models by SPA required high androgen receptor (AR) activity and were driven in part by downregulation of MYC. Using matched sequential patient biopsies, we show that high pretreatment AR activity predicted downregulation of MYC, improved clinical response, and prolonged progression-free and overall survival for patients on BAT. BAT induced strong downregulation of AR in all patients, which is shown to be a primary mechanism of acquired resistance to SPA. Acquired resistance was overcome by alternating SPA with the AR inhibitor enzalutamide, which induced adaptive upregulation of AR and resensitized prostate cancer to SPA. This work identifies high AR activity as a predictive biomarker of response to BAT and supports a treatment paradigm for prostate cancer involving alternating between AR inhibition and activation.

Keywords: Oncology; Prostate cancer.


Figures

Figure 1
Figure 1. High pretreatment AR activity is required and sufficient for growth inhibition by SPA.
(A) AR, PSA, and MYC protein expression by Western blot of prostate cancer cell lines treated with VEH or SPA for 72 hours. Representative blot of n = 3 independent experiments. (B) AR protein expression by Western blot of LNCaP cells expressing doxycycline-inducible shRNA against AR pretreated with the indicated concentration of doxycycline (doxy) for 72 hours. Representative blot of n = 2 experiments. (C) Viable cell counts of LNCaP-shAR pretreated with indicated concentration of doxycycline for 72 hours then VEH or SPA for 96 hours (n = 3 independent experiments). (D) AR and MYC protein expression by Western blot of LAPC4 expressing empty vector (EV) or AR treated with VEH or SPA for 7 days. Representative blot of n = 3 independent experiments. (E) Viable cell counts of LAPC4-EV and LAPC4-AR cell lines treated with VEH or SPA for 7 days (n = 3 independent experiments). (F) AR and MYC protein expression by Western blot of 22Rv1 cells expressing empty vector (EV) or AR treated with VEH or SPA for 4 days. Representative blot of n = 3 independent experiments. (G) Viable cell counts of 22Rv1-EV and 22Rv1-AR cell lines treated with VEH or SPA for 7 days (n = 3 independent experiments). VEH, vehicle control EtOH 0.01%. SPA, R1881 10nM. (C, E, G) P value by unpaired 2-tailed t test comparing final cell counts. Biological replicates indicated in gray with mean of each independent experiment in color. i-shAR, inducible-short hairpin RNA against AR. For Western blots, vinculin was used as a loading control.
Figure 2
Figure 2. High pretreatment AR activity is required for downregulation of MYC by SPA, which contributes to growth inhibition.
(A) MYC mRNA expression by quantitative PCR (qPCR) of prostate cancer cell lines treated with VEH or SPA for 72 hours (n = 3 independent experiments). Ct value was first normalized to ACTB for each sample, then to VEH for each cell line, and expressed as mean ± SD with P values were determined by unpaired 2-tailed t test with Welch correction for unequal variances. (B) MYC protein expression by Western blot of LNCaP cells expressing doxycycline-inducible shRNA against AR pretreated with indicated concentration of doxycycline (doxy) for 72 hours then VEH or SPA for 96 hours. Representative blot of n = 2 experiments. (C) AR and MYC protein expression by Western blot of LNCaP-empty vector (LNCaP-EV) and LNCaP-MYC cell lines treated with VEH or SPA for 72 hours. Representative blot of n = 3 independent experiments. (D) Viable cell counts of LNCaP-EV and LNCaP-MYC cell lines treated with VEH or SPA for 7 days (n = 3 independent experiments). P value was determined by unpaired 2-tailed t test. Biological replicates are indicated in gray with the mean of each independent experiment in color. (E) AR and MYC expression by Western blot of LAPC4-EV, LAPC4-AR, and LAPC4-AR-MYC cell lines treated with VEH or SPA for 7 days. Representative blot of n = 3 independent experiments. (F) Viable cell counts of LAPC4-EV, LAPC4-AR, and LAPC4-AR-MYC cell lines treated with VEH or SPA for 7 days (n = 3 independent experiments). P value was determined by unpaired 2-tailed t test. Biological replicates indicated in gray with the mean of each independent experiment in color. VEH, vehicle control, EtOH 0.01%. SPA, R1881, 10nM. For Western blots, vinculin was used as a loading control.
Figure 3
Figure 3. High pretreatment AR activity predicts clinical benefit from BAT.
(A) Clinical trial design. CRPC, castration-resistant prostate cancer. BAT, Bipolar Androgen Therapy. T, testosterone. (B) PreBAT total AR OD by image analysis among nonresponders (NR) and responders (R) with median indicated by line (n = 24). Responders are those with a PSA50 response or objective response on C4D1. P values determined by unpaired 2-tailed t test. (C) PreBAT ARAMW score among NR and R with median indicated by line (n = 15). P values determined by unpaired 2-tailed t test. (D) Percent change in PSA on C4D1 color-coded by ARAMW score. PSA50 response indicated by dashed line. p value by Chi-squared comparison of proportions. (E) Percent change in tumor volume on C4D1 by ARAMW score. P values determined by unpaired 2-tailed t test. (F) Radiographic progression-free survival on BAT stratified by ARAMW score. P value determined by log-rank. (G) Overall survival on BAT stratified by ARAMW score. P value determined by log-rank. (H) PreBAT serum PSA among NR and R with median indicated by line (n = 24). P value determined by unpaired 2-tailed t test. (I) Overall survival of patients in the SU2C/PCF cohort (n = 81) stratified by ARAMW score. P value determined by log-rank.
Figure 4
Figure 4. BAT downregulates MYC in responding patients.
(A) AR nuclear-to-cytoplasmic ratio (AR N:C) in paired tumor biopsies (n = 24). (B) Percent change in AR N:C among nonresponders (NR) and responders (R) with median indicated by line. (C) MYC H-score in paired tumor biopsies (n = 24). (D) Percent change in MYC H-score among NR and R with median indicated by line. (E) Example of IHC for MYC in paired biopsy samples from a responding patient. Scale bar: 200 μm. (F) Correlation of MYC RNA change from C1D1 to C4D1 with MYC protein change from C1D1 to C4D1 (n = 15). (G) Ki-67 H-score in paired tumor biopsies (n = 24). (H) Percent change in Ki-67 H-score among NR and R with median indicated by line. (I) Example of IHC for Ki-67 in paired biopsy samples from a responding patient. (J) Correlation of percent change in tumor volume from C1D1 to C4D1 with MYC protein change from C1D1 to C4D1 (n = 23; 1 patient excluded for lack of measurable disease). (K) Correlation of percent change in Ki-67 H-score with percent change in MYC H-score (n = 24). (L) Percent change in MYC H-score stratified by ARAMW score (n = 15) with median indicated by line. (M) Correlation of change in expression of genes within the 8q24 TAD with change in MYC expression (n = 15). (A, C, G) P value determined by paired 2-tailed t test. (B, D, H) P value determined by unpaired 2-tailed t test. (F, J, K, and M) r and P values determined by Pearson’s correlation calculation.
Figure 5
Figure 5. Downregulation of AR drives acquired resistance to SPA.
(A) Cell cycle analysis by propidium iodide staining of LNCaP cells treated with VEH or SPA. Average values of n = 2 independent experiments. (B) Clonogenic survival of LNCaP cells treated for 26 days with VEH or SPA, followed by 7 days rest without treatment, then treatment with dose of R1881 as indicated. Representative photograph of n = 2 independent experiments. (CE) AR, KLK3, and MYC mRNA expression by qPCR of LNCaP cells treated with VEH or SPA (n = 3 independent experiments). Ct values were normalized to ACTB for each sample, then to VEH × 5 days, and expressed as median ± SD with P values determined by unpaired 2-tailed t test. (F) AR, PSA, and MYC protein expression by Western blot of LNCaP cells treated with VEH or SPA for 5 or 26 days. Representative blot of n = 3 independent experiments. (G) Chromatin accessibility by ATAC-Seq of the AR promoter (dotted box) of LNCaP cells treated with VEH or SPA for 5 or 26 days (performed in duplicate). (H) AR and MYC protein expression by Western blot of LNCAP-EV and LNCAP-AR cells treated with VEH or SPA for 72 hours. Representative blot of n = 3 independent experiments. (I) Cell cycle analysis by propidium iodide staining of LNCaP-EV and LNCaP-AR cells treated with VEH or SPA. Average values of n = 3 independent experiments. VEH, vehicle control, EtOH 0.01%; SPA, R1881, 10nM; LNCaP-SPAR, LNCaP with acquired resistance to SPA. For Western blots, vinculin was used as a loading control.
Figure 6
Figure 6. BAT downregulates AR.
(A) Total AR OD by image analysis in paired tumor biopsies (n = 24) color-coded by response. P value determined by paired 2-tailed t test. (B) Example of IHC for AR (1:10,000 antibody dilution) in paired biopsy samples from a responding patient. (C) Correlation of AR RNA change from C1D1 to C4D1 with AR protein change from C1D1 to C4D1 (n = 15). r and P values determined by Pearson’s correlation calculation. (D) Correlation of AR protein change with preBAT total AR OD. r and P values determined by Pearson’s correlation calculation. (E) Schematic model of primary and acquired resistance to BAT.
Figure 7
Figure 7. Acquired resistance to SPA can be overcome by alternating between AR activation and inhibition.
(A) Experimental design schematic. LNCaP-SPAR are LNCaP with acquired resistance to SPA; VEH, vehicle; ENZA, Enzalutamide (B) Viable cell number of LNCaP and LNCaP-SPAR cells following treatment with VEH, SPA, or ENZA for 5 days (n = 3 independent experiments). Biological replicates indicated in gray with mean of each independent experiment in color. Percent of VEH is indicated for ENZA-treated cells. (C) AR protein expression by Western blot of cells treated as indicated in A. Representative blot of n = 3 independent experiments. (D) MYC protein expression by Western blot of LNCaP and LNCaP-SPAR cells following treatment with VEH or ENZA for 5 days followed by VEH or SPA for 5 days. Representative blot of n = 3 independent experiments. (E) Viable cell number of cells treated as per D (n = 4 independent experiments). P values determined by unpaired 2-tailed t test. Biological replicates indicated in gray with mean of each independent experiment in color. (F) Tumor size of SKCaP-1R PDX following no treatment (Control; n = 4 mice), continuous testosterone (SPA; n = 4 mice), or SPA alternating with enzalutamide every 3 weeks (SPA-ENZA; n = 3 mice). P value determined by unpaired 2-tailed t test comparing final measurements. (G) AR and MYC protein expression by Western blot of SKCaP-1R untreated (control) or treated with SPA. (H) H&E staining and IHC for MYC and Ki-67 of SKCaP-1R following no treatment (Control), continuous SPA for 7 or 160 days, or SPA-ENZA for 160 days. Representative photograph of n = 3 mice per group. (I) RNA in situ hybridization for AR and AR-V7 in tumors of SKCaP-1R untreated (control) or treated with SPA for 30 days. Representative photograph of n = 3 mice per group. For Western blots, vinculin used as a loading control.

Comment in

  • Is androgen receptor activity in metastatic prostate cancer a good biomarker for bipolar androgen therapy?

Similar articles

Cited by

References

    1. Wolf DA, et al. Synthetic androgens suppress the transformed phenotype in the human prostate carcinoma cell line LNCaP. Br J Cancer. 1991;64(1):47–53. doi: 10.1038/bjc.1991.237. - DOI - PMC - PubMed
    1. Kokontis J, et al. Increased androgen receptor activity and altered c-myc expression in prostate cancer cells after long-term androgen deprivation. Cancer Res. 1994;54(6):1566–1573. - PubMed
    1. Umekita Y, et al. Human prostate tumor growth in athymic mice: inhibition by androgens and stimulation by finasteride. Proc Natl Acad Sci U S A. 1996;93(21):11802–11807. doi: 10.1073/pnas.93.21.11802. - DOI - PMC - PubMed
    1. Denmeade SR, Isaacs JT. Bipolar androgen therapy: the rationale for rapid cycling of supraphysiologic androgen/ablation in men with castration resistant prostate cancer. Prostate. 2010;70(14):1600–1607. doi: 10.1002/pros.21196. - DOI - PMC - PubMed
    1. Schweizer MT, et al. Effect of bipolar androgen therapy for asymptomatic men with castration-resistant prostate cancer: results from a pilot clinical study. Sci Transl Med. 2015;7(269):269ra2. - PMC - PubMed

Publication types

MeSH terms