

NLRP3 activation in neutrophils induces lethal autoinflammation, liver inflammation, and fibrosis
- PMID: 36194627
- PMCID: PMC9638850
- DOI: 10.15252/embr.202154446
NLRP3 activation in neutrophils induces lethal autoinflammation, liver inflammation, and fibrosis
Abstract
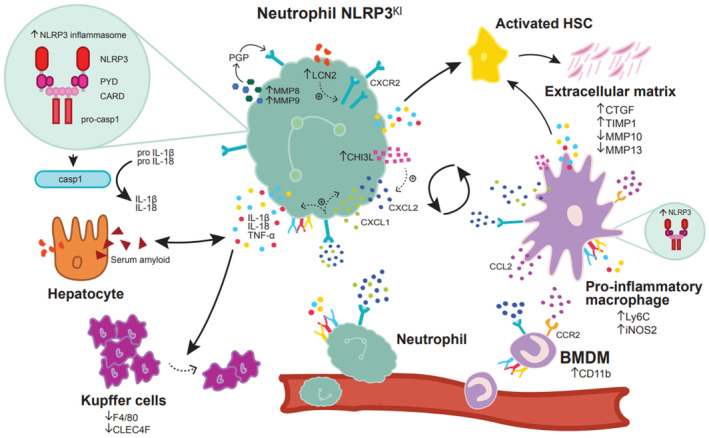
Sterile inflammation is a central element in liver diseases. The immune response following injurious stimuli involves hepatic infiltration of neutrophils and monocytes. Neutrophils are major effectors of liver inflammation, rapidly recruited to sites of inflammation, and can augment the recruitment of other leukocytes. The NLRP3 inflammasome has been increasingly implicated in severe liver inflammation, fibrosis, and cell death. In this study, the role of NLRP3 activation in neutrophils during liver inflammation and fibrosis was investigated. Mouse models with neutrophil-specific expression of mutant NLRP3 were developed. Mutant mice develop severe liver inflammation and lethal autoinflammation phenocopying mice with a systemic expression of mutant NLRP3. NLRP3 activation in neutrophils leads to a pro-inflammatory cytokine and chemokine profile in the liver, infiltration by neutrophils and macrophages, and an increase in cell death. Furthermore, mutant mice develop liver fibrosis associated with increased expression of pro-fibrogenic genes. Taken together, the present work demonstrates how neutrophils, driven by the NLRP3 inflammasome, coordinate other inflammatory myeloid cells in the liver, and propagate the inflammatory response in the context of inflammation-driven fibrosis.
Keywords: NLR Family Pyrin Domain Containing 3; fibrosis; liver inflammation; macrophage; neutrophil.
© 2022 The Authors.
Figures
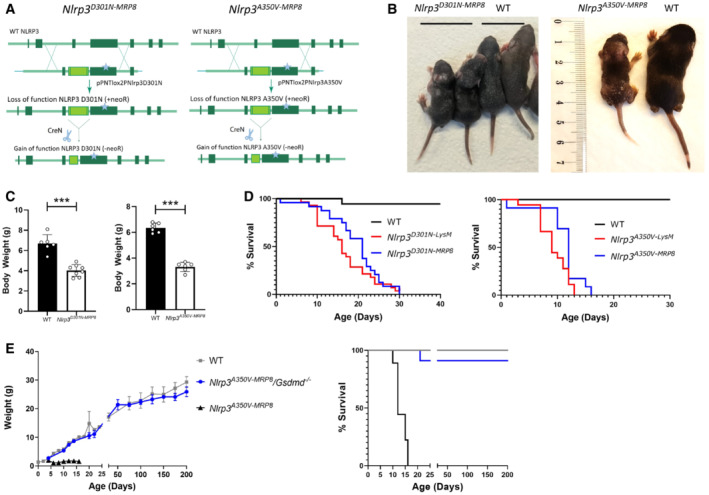
Schematic illustration of generation of both mutant neutrophil‐specific Nlrp3 D301NneoR and Nlrp3 A350VneoR mice.
Representative images of both Nlrp3 D301N‐MRP8 and Nlrp3 A350V‐MRP8 mutant mice.
Body weight of both Nlrp3 D301N‐MRP8 and Nlrp3 A350V‐MRP8 mutant mice at day 10 of age. n = 6–8.
Survival curve of both neutrophil‐ and myeloid‐specific Nlrp3 D301NneoR and Nlrp3 A350VneoR mutant mice. n ≥ 18.
Weight and survival curves of neutrophil‐specific Nlrp3 A350VneoR Gsdmd −/− mice. n ≥ 18.
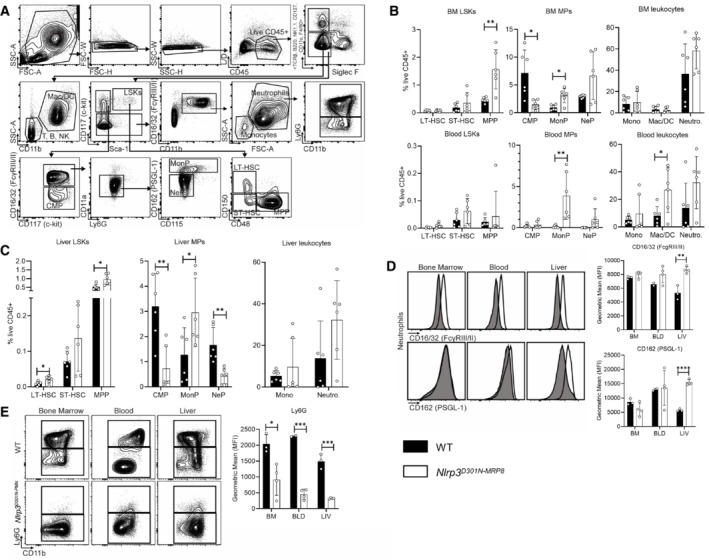
Flow cytometry gating strategy used to identify mature leukocytes and HSPCs in the bone marrow, peripheral blood, and liver.
Frequency of LSKs, MPs, and leukocytes in bone marrow and peripheral blood of live CD45+ cells from WT (n = 6) and Nlrp3 D301N‐MRP8 (n = 6) neonatal mice at P8‐P9.
Frequency of LSKs, MPs, and leukocytes in liver of live CD45+ cells from WT (n = 6) and Nlrp3 D301N‐MRP8 (n = 6) neonatal mice at P8‐P9.
Markers of neutrophil activation FcγRIII/II and PSGL‐1 illustrated by geometric mean fluorescence intensity (gMFI) in neutrophils from the bone marrow (BM), blood (BLD), and liver (LIV) of WT (n = 3) and Nlrp3 D301N‐MRP8 (n = 4) neonatal mice at P8‐P9.
Loss of Ly6G expression in Nlrp3 D301N‐MRP8 neutrophils (n = 4) relative to WT littermate neutrophils (n = 3) by flow cytometry evaluation of gMFI.
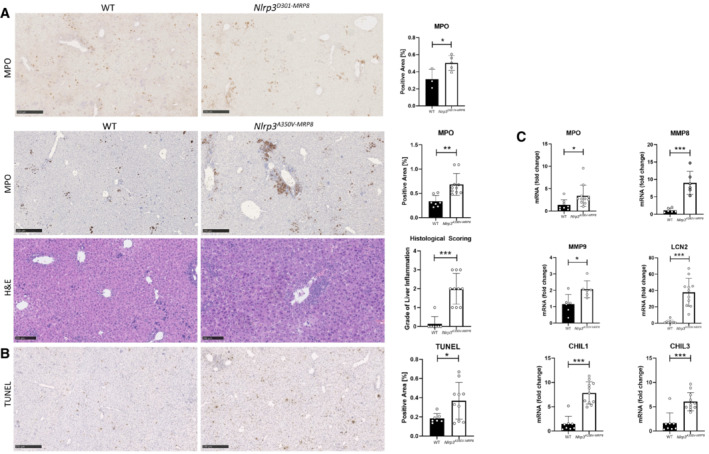
- A, B
MPO staining of liver issue used as a marker for myeloid cells including monocytes in both Nlrp3 D301N‐MRP8 and Nlrp3 A350V‐MRP8 mutant (n ≥ 3 mice per genotype, representative images shown, bar indicates 250 μM). H&E staining of liver tissue with histologic scoring of liver inflammation (bar indicates 100 μM, representative images are shown). TUNEL staining of liver tissue (Representative images shown, bar indicates 250 μM).
- C
Expression of mRNA level in whole liver tissue of MPO, MMP8, MMP9 LCN2, Chitinase‐3‐like proteins CHIL1 and CHIL3.
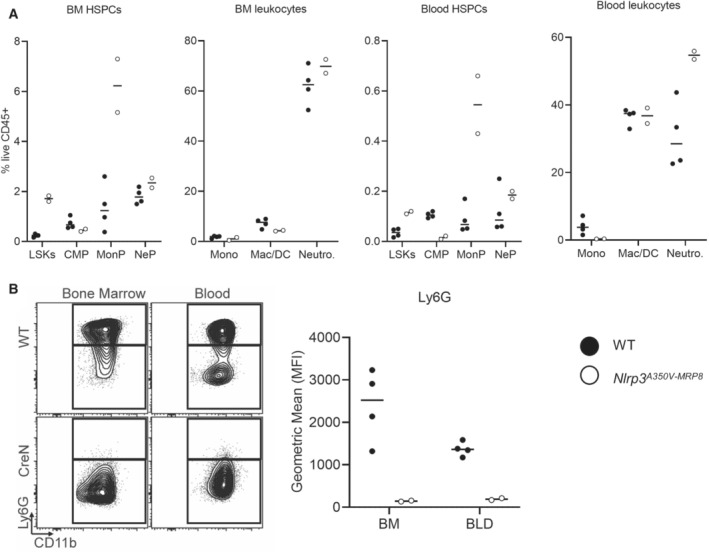
Frequency of leukocytes and HSPC in bone marrow and blood of live CD45+ cells from WT (n = 4) and Nlrp3 A350V‐MRP8 (n = 2) neonatal mice at P0.
Loss of Ly6G expression in Nlrp3 A350V‐MRP8 neutrophils (n = 2) relative to WT littermate neutrophils (n = 4) at P0 by flow cytometry evaluation of gMFI.
- A
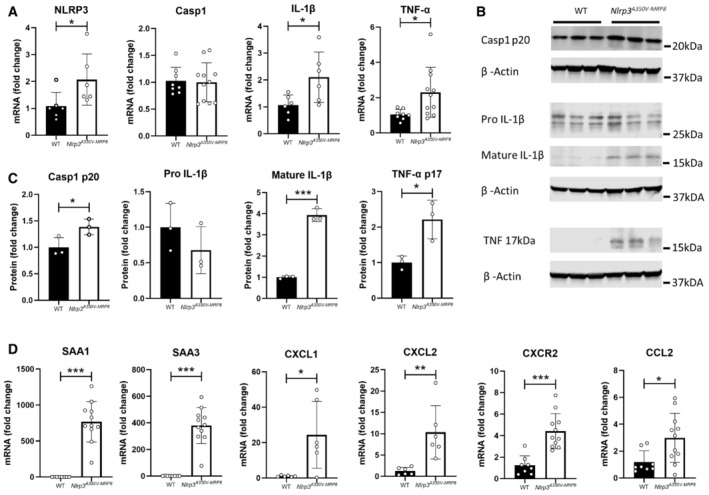
Expression of NLRP3, IL‐1β, and TNF‐α on mRNA level in whole liver lysate.
- B, C
Protein expression in liver tissue of cleaved and mature forms of Casp1 (p20), IL‐1β and TNF‐α (17 kDa; n = 3 mice per genotype for Western blots).
- D
Expression of mRNA of SAA 1 and 3, the chemoattractants CXCL1, CXCL2, its receptor CXCR2, and CCL2.
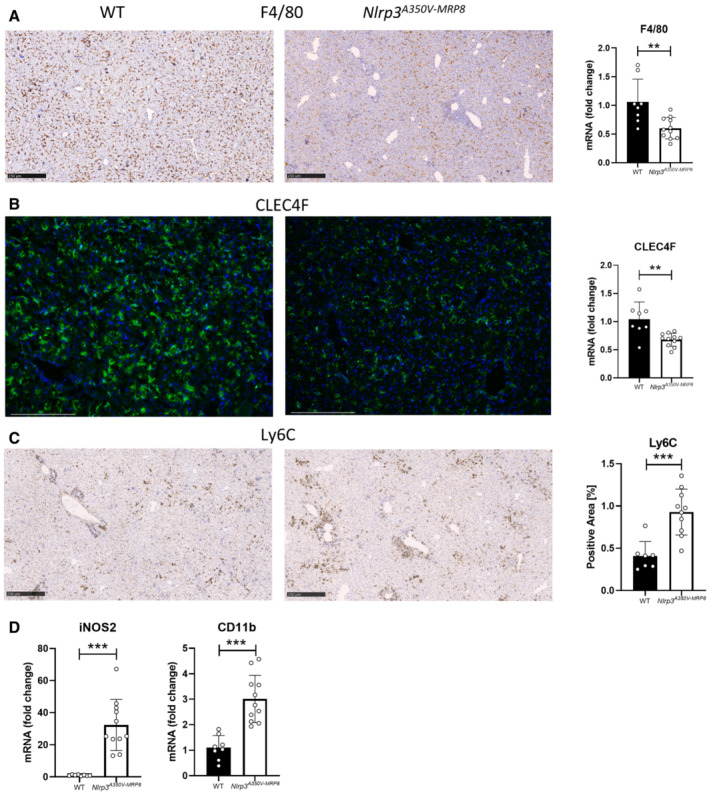
Immunohistochemical staining of F4/80, a marker for resident macrophages, and mRNA expression of F4/80 in liver tissue.
Immunofluorescence staining of CLEC4F, a specific marker of Kupffer cells, and gene expression of CLEC4F in liver tissue.
Immunohistochemical staining of Ly6C, a marker for pro‐inflammatory macrophages, in liver tissue.
Gene expression of the pro‐inflammatory marker of macrophages iNOS as well as gene expression of CD11b.
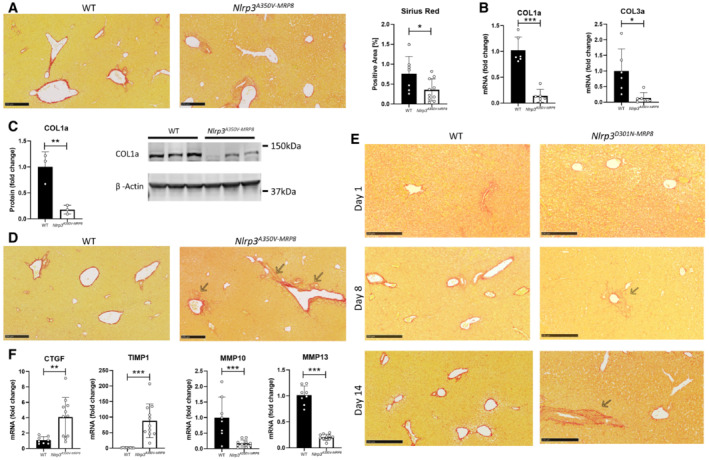
Collagen deposition assessed by Sirius red staining.
Gene expression of collagen 1a and collagen 3a in whole liver lysate analyzed by qPCR.
Protein expression of collagen 1a in whole liver lysate. n = 3.
Collagen deposition and fibrosis assessed by Sirius red staining in WT and Nlrp3 A350V‐MRP8 mutant mice to illustrate vascular as well as bile duct collagen deposition and foci of fibrosis (black arrows) in areas with severe liver inflammation.
Fibrotic foci in Nlrp3 D301N‐MRP8 mice over time. n ≥ 3.
Gene expression in liver tissue of the profibrotic genes CTGF and TIMP1 as well as the metalloproteinases 10 and 13.
Comment in
-
Equally potent: Nlrp3 mutation in macrophages or neutrophils is sufficient to drive autoinflammation.EMBO Rep. 2022 Nov 7;23(11):e56091. doi: 10.15252/embr.202256091. Epub 2022 Oct 4. EMBO Rep. 2022. PMID: 36194522 Free PMC article.
References
-
- Alegre F, Pelegrin P, Feldstein AE (2017) Inflammasomes in liver fibrosis. Semin Liver Dis 37: 119–127 - PubMed
Publication types
MeSH terms
Substances
Grants and funding
LinkOut - more resources
Full Text Sources
Medical
