. 2022 Oct 11;119(41):e2210665119.
doi: 10.1073/pnas.2210665119. Epub 2022 Oct 4.

Life cycle and functional genomics of the unicellular red alga Galdieria for elucidating algal and plant evolution and industrial use

Affiliations

Life cycle and functional genomics of the unicellular red alga Galdieria for elucidating algal and plant evolution and industrial use

Shunsuke Hirooka et al. Proc Natl Acad Sci U S A. .

Abstract

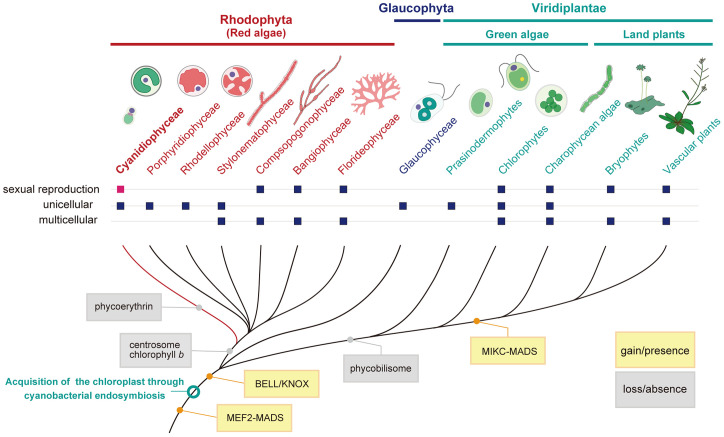
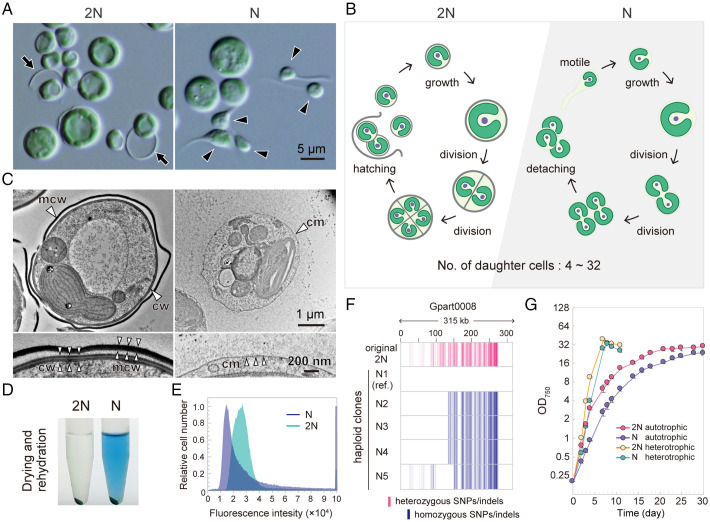
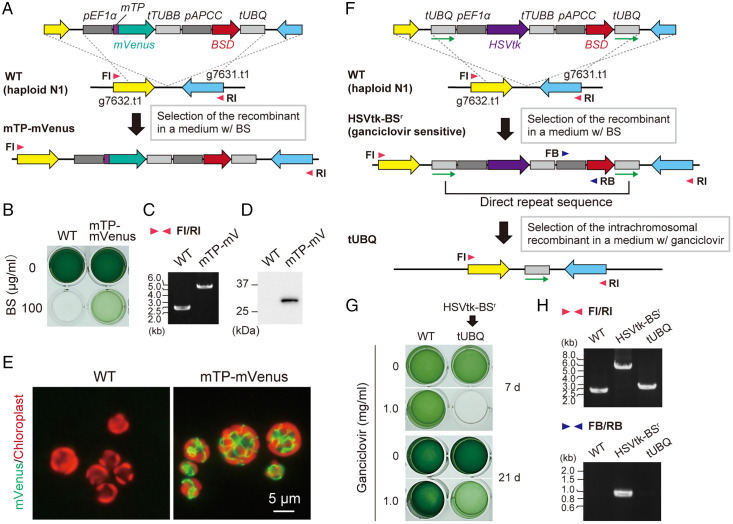
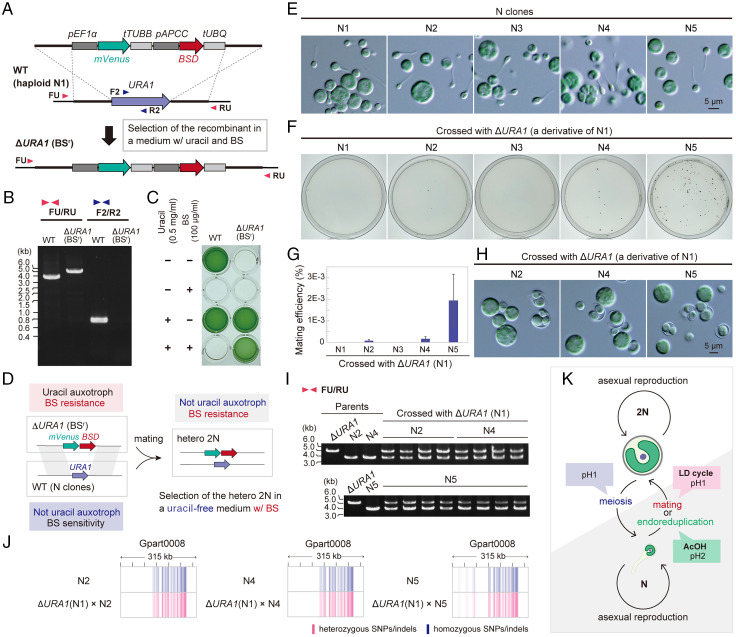
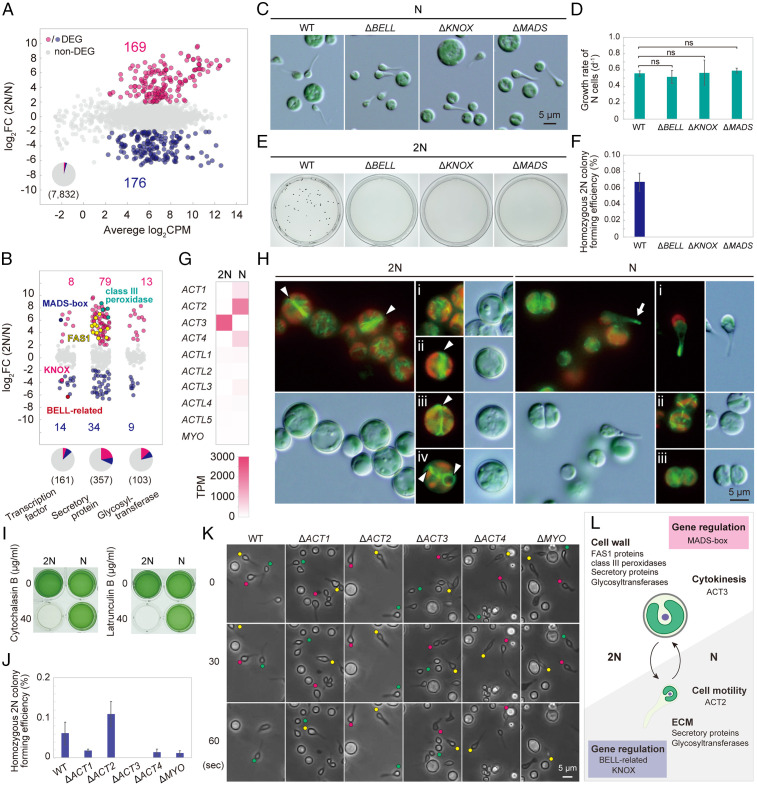
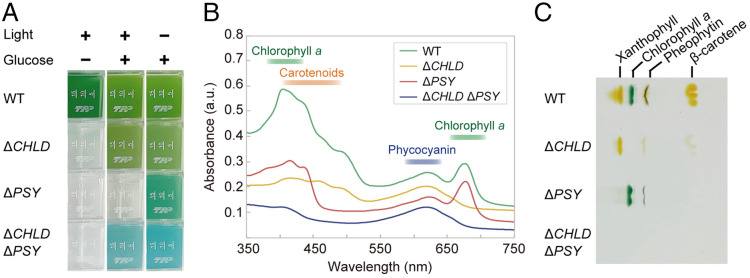
Sexual reproduction is widespread in eukaryotes; however, only asexual reproduction has been observed in unicellular red algae, including Galdieria, which branched early in Archaeplastida. Galdieria possesses a small genome; it is polyextremophile, grows either photoautotrophically, mixotrophically, or heterotrophically, and is being developed as an industrial source of vitamins and pigments because of its high biomass productivity. Here, we show that Galdieria exhibits a sexual life cycle, alternating between cell-walled diploid and cell wall-less haploid, and that both phases can proliferate asexually. The haploid can move over surfaces and undergo self-diploidization or generate heterozygous diploids through mating. Further, we prepared the whole genome and a comparative transcriptome dataset between the diploid and haploid and developed genetic tools for the stable gene expression, gene disruption, and selectable marker recycling system using the cell wall-less haploid. The BELL/KNOX and MADS-box transcription factors, which function in haploid-to-diploid transition and development in plants, are specifically expressed in the haploid and diploid, respectively, and are involved in the haploid-to-diploid transition in Galdieria, providing information on the missing link of the sexual life cycle evolution in Archaeplastida. Four actin genes are differently involved in motility of the haploid and cytokinesis in the diploid, both of which are myosin independent and likely reflect ancestral roles of actin. We have also generated photosynthesis-deficient mutants, such as blue-colored cells, which were depleted in chlorophyll and carotenoids, for industrial pigment production. These features of Galdieria facilitate the understanding of the evolution of algae and plants and the industrial use of microalgae.

Keywords: Galdieria; actin; homeobox; microalgae; sexual reproduction.


Conflict of interest statement

Competing interest statement: The Japan Science and Technology Agency has filed patent applications related to the generation and maintenance of Galdieria spp. haploid cells on behalf of S.H. and S.-y.M. The National Institute of Genetics and the DIC Corporation have filed patent applications related to the genetic modification on behalf of S.H., T.F., and S.-y.M. All other authors declare they have no competing interests.

Figures

Fig. 1.
Fig. 1.
Evolutionary position of the red algae Cyanidiophyceae to which the genus Galdieria belongs. Cladogram showing gain and loss of some traits and genes. Also shown is whether respective groups are unicellular or multicellular organisms and whether sexual reproduction has been observed. The topologies in red algae (Rhodophyta) (66, 67) and Viridiplantae (4) are based on previous studies. The order of branching of red algae and Glaucophyta remains unclear, although a recent study based on large-scale genomic data suggests that red algae branched first in Archaeplastida (4).
Fig. 2.
Fig. 2.
The generation of the cell wall–less haploids from cell-walled diploids of G. partita. (A) Micrographs of the original diploid (2N) clone of G. partita obtained from the Biological Resource Center, NITE, and haploid (N; clone N1) cells. The black arrow indicates the mother cell wall released upon hatching of daughter cells, and the black arrowhead indicates tadpole-shaped cells. See also SI Appendix, Fig. S1 A and B, for other Galdieria spp. (B) Proliferation mode of 2N (Movies S1 and S2) and N (Movies S2–S6) cells based on time-lapse observations. (C) Electron micrographs of 2N and N cells; cm, cell membrane; cw, daughter cell wall; mcw, mother cell wall. More details are indicated in SI Appendix, Fig. S1C. Fluorescent visualization of membranous organelles in 2N and N cells is shown in SI Appendix, Fig. S3. (D) The 2N and N cell pellets were dried, rehydrated with phosphate-buffered saline, and centrifuged. (E) Flow cytometric analysis of 2N and N cells stained with SYTOX Green. Images by fluorescence microscopy are shown in SI Appendix, Fig. S1D. (F) Mapping of SNP/indel positions in the original 2N and five distinct N clones. Sites that match the reference genome sequence (haploid clone N1) are shown in white, heterozygous SNPs/indels are shown in red, and homozygous SNPs/indels are shown in blue. (G) Growth curves of 2N and N cells in rotating suspension cultures under photoautotrophic (in an inorganic medium in the light) and heterotrophic (in a medium supplemented with glucose in the dark) conditions. Data represent the mean and SD of three independent cultures. Growth rates of 2N and N cells at various pH values are shown in SI Appendix, Fig. S1E.
Fig. 3.
Fig. 3.
Genetic manipulation of G. partita haploids and selectable marker removal. (A) DNA encoding an mTP was fused to mVenus orf. The fusion orf was connected with EF1a promotor (pEF1 a) and β-TUBULIN terminator (tTUBB). BSD orf was connected with an APCC promotor (pAPCC) and UBIQUITIN terminator (tUBQ). These gene cassettes were integrated into a chromosomal intergenic region between g7632.t1 and g7631.t1 loci by homologous recombination in haploid (N) clone N1. (B) The transformed cells (mTP–mVenus) were selected in an inorganic medium with BS in the light. (C) The targeted integration of the transgenes into the chromosome was confirmed by PCR using primers FI and RI. (D and E) Expression of mTP–mVenus was confirmed by immunoblotting with an anti-green fluorescent protein antibody (D) and fluorescence microscopy (E); green, mVenus fluorescence; red, chloroplast fluorescence. The wild type (WT) served as a negative control. (F) A schematic diagram of the targeted integration and subsequent removal of the BSD selectable marker. The HSVtk suicide marker, connected with pEF1a and tTUBB, and the BSD selectable marker, connected using pAPCC, were sandwiched between a directly repeated tUBQ (indicated by green arrows). This construct was integrated into the intergenic region between g7632.t1 and g7631.t1 loci of wild-type haploid clone N1 by homologous recombination. After selecting the transformant (HSVtk-BSr) in the presence of BS, the selectable marker was removed through homologous recombination between two copies of tUBQ and selection with ganciclovir, which is converted to a toxic product by HSVtk. (G) The HSVtk-BSr cells were cultured photoautotrophically for 21 d in the presence or absence of ganciclovir. Wild-type clone N1 served as a negative control. (H) Confirmation of the recombination events by PCR using the primers indicated by arrowheads in F (FI, RI, FB, and RB).
Fig. 4.
Fig. 4.
Generation of homozygous and heterozygous diploids of G. partita. See also SI Appendix, Fig. S4, for the generation of homozygous diploids. (A) To select heterozygous diploids, a uracil-auxotrophic BS-resistant haploid was generated. To knock out URA1 and provide BS resistance to G. partita haploid clone N1, mVENUS orf, connected with pEF1a and tTUBB, and BSD selectable marker, connected with pAPCC and tUBQ, were integrated into the chromosomal URA1 locus of haploid clone N1 by homologous recombination. (B) Replacement of the chromosomal URA1 orf with the mVENUS and BSD markers in the resultant ΔURA1 (BSr) clone was confirmed by PCR with the primers FU, F2, RU, and R2, indicated by the arrowheads in A. The wild-type haploid clone N1 (WT) served as a control. (C) The uracil auxotroph and BS resistance of the ΔURA1 (BSr) clone was confirmed through photoautotrophic cultivation (for 7 d) of the cells in the presence or absence of uracil and BS. Wild type served as a control. (D) A scheme showing the selection of heterozygous diploids, which possess both BSD marker and the URA1 gene, after mating ΔURA1 (BSr) haploid clone with a wild-type haploid clone. (E) Micrographs of the haploid clones N1 through N5 obtained from the original diploid clone. (F) ΔURA1 (BSr) N clone N1 was crossed with wild-type N clones, and heterozygous diploids (2N) were selected on gellan gum–solidified medium with BS. (G) Mating efficiency of respective combinations of N clones. Data represent the mean and SD of three independent experiments. (H) Micrographs of the cells in a colony of respective combinations. (I) Heterozygosity was confirmed by PCR using primers FU and RU (primer positions are indicated in A). (J) Confirmation of heterozygosity by mapping SNP/indel positions of heterozygous 2N clones. Sites that match the reference genome sequence (N clone N1) are shown in white, heterozygous SNPs/indels are shown in red, and homozygous SNPs/indels are shown in blue. (K) Schematic representation of the generation of homozygous and heterozygous 2N.
Fig. 5.
Fig. 5.
Comparison of transcriptomes and differences in the function of actin genes between diploids and haploids in G. partita. (A) MA plot showing 169 genes up-regulated in diploids (homozygous 2N derived from N1) and 176 genes up-regulated in haploids (N; clone N1) among 7,832 nucleus-encoded genes (DEGs, FDR < 0.01, log CPM > 2, and log FC > 2 or log FC < −2 in three independent cultures). The result of clone N2 is shown in SI Appendix, Fig. S5A. (B) Ratio of mRNA abundance of genes encoding transcription factors, secretory proteins, and glycosyltransferases between 2N and N cells. (C) Micrographs of the wild-type (WT), ΔBELL, ΔKNOX, and ΔMADS N cells. (D) Photoautotrophic growth rate of wild-type, ΔBELL, ΔKNOX, and ΔMADS N cells. Data represent the mean and SD of three independent cultures. (E and F) Efficiency of generation of homozygous 2N colonies on gellan gum plates supplemented with acetate of wild-type, ΔBELL, ΔKNOX, and ΔMADS cells. (G) Comparison of mRNA abundance of actin (ACT), actin-like (ACTL), and MYO genes between 2N and N cells. The phylogenetic relationship of ACT1, ACT2, ACT3, and ACT4 proteins is shown in SI Appendix, Fig. S6A. (H) Actin filaments visualized using Lifeact-mVenus in 2N and N cells; green, Lifeact fluorescence indicating actin filaments; red, chloroplast fluorescence. (I) Comparison of cytochalasin/latrunculin sensitivity between 2N and N cells. (J) Efficiency of generation of homozygous 2N colonies on gellan gum plates supplemented with acetate of the wild type and actin and myosin knockouts. Data represent the mean and SD of three independent cultures. Photographs of the plates and cells are shown in SI Appendix, Fig. S6B. (K) Time-lapse observation of WT, ΔACT, and ΔMYO N cells in static liquid cultures. Tadpole-shaped cells are indicated by yellow, red, and green circles. (L) Schematic summary of the difference between 2N and N cells.
Fig. 6.
Fig. 6.
The generation of photosynthesis-deficient mutants and blue algal culture by genetic modification of G. partita. (A) Liquid cultures of the wild-type (WT), ΔCHLD, ΔPSY, and ΔCHLD ΔPSY haploid (N) in an inorganic medium in the light and in an organic (supplemented with 100 mM glucose) medium in the light or dark. The growth rate is shown in SI Appendix, Fig. S7D. (B and C) Absorption spectrum (B) and TLC (C) analysis of wild type, ΔCHLD, ΔPSY, and ΔCHLD ΔPSY N cells that are cultured heterotrophically (in a medium supplemented with glucose in the dark). The chlorophyll, carotenoid, and phycocyanin contents are shown in SI Appendix, Fig. S7E.

Comment in

  • Discovery of sex in an extremophilic red alga.
    Goodenough U. Goodenough U. Proc Natl Acad Sci U S A. 2022 Nov;119(44):e2216012119. doi: 10.1073/pnas.2216012119. Epub 2022 Oct 21. Proc Natl Acad Sci U S A. 2022. PMID: 36269868 Free PMC article. No abstract available.

Similar articles

Cited by

References

    1. Seckbach J., Ed., Evolutionary Pathways and Enigmatic Algae: Cyanidium caldarium (Rhodophyta) and Related Cells (Springer Science+Business Media, Dordrecht, The Netherlands, 1981).
    1. Yoon H. S., Hackett J. D., Ciniglia C., Pinto G., Bhattacharya D., A molecular timeline for the origin of photosynthetic eukaryotes. Mol. Biol. Evol. 21, 809–818 (2004). - PubMed
    1. Adl S. M., et al. , Revisions to the classification, nomenclature, and diversity of eukaryotes. J. Eukaryot. Microbiol. 66, 4–119 (2019). - PMC - PubMed
    1. One Thousand Plant Transcriptomes Initiative, One thousand plant transcriptomes and the phylogenomics of green plants. Nature 574, 679–685 (2019). - PMC - PubMed
    1. Matsuzaki M., et al. , Genome sequence of the ultrasmall unicellular red alga Cyanidioschyzon merolae 10D. Nature 428, 653–657 (2004). - PubMed

Publication types