

miR-181a/b downregulation: a mutation-independent therapeutic approach for inherited retinal diseases
- PMID: 36194668
- PMCID: PMC9641422
- DOI: 10.15252/emmm.202215941
miR-181a/b downregulation: a mutation-independent therapeutic approach for inherited retinal diseases
Abstract
Inherited retinal diseases (IRDs) are a group of diseases whose common landmark is progressive photoreceptor loss. The development of gene-specific therapies for IRDs is hampered by their wide genetic heterogeneity. Mitochondrial dysfunction is proving to constitute one of the key pathogenic events in IRDs; hence, approaches that enhance mitochondrial activities have a promising therapeutic potential for these conditions. We previously reported that miR-181a/b downregulation boosts mitochondrial turnover in models of primary retinal mitochondrial diseases. Here, we show that miR-181a/b silencing has a beneficial effect also in IRDs. In particular, the injection in the subretinal space of an adeno-associated viral vector (AAV) that harbors a miR-181a/b inhibitor (sponge) sequence (AAV2/8-GFP-Sponge-miR-181a/b) improves retinal morphology and visual function both in models of autosomal dominant (RHO-P347S) and of autosomal recessive (rd10) retinitis pigmentosa. Moreover, we demonstrate that miR-181a/b downregulation modulates the level of the mitochondrial fission-related protein Drp1 and rescues the mitochondrial fragmentation in RHO-P347S photoreceptors. Overall, these data support the potential use of miR-181a/b downregulation as an innovative mutation-independent therapeutic strategy for IRDs, which can be effective both to delay disease progression and to aid gene-specific therapeutic approaches.
Keywords: inherited retinal diseases; miR-181; mitochondria; photoreceptor; therapy.
©2022 The Authors. Published under the terms of the CC BY 4.0 license.
Figures

- A
qRT–PCR analysis reveals increased levels of most of the miR‐181a/b targets in the eyes of P347S/miR‐181a/b+/− versus P347S animals. N = 4 animals/genotype.
- B–C′
Immunofluorescence analysis of active‐caspase 3 in the ONL of P347S and P347S/miR‐181a/b+/−.
- D, E
TUNEL analysis in the ONL of P347S and P347S/miR‐181a/b+/−.
- F
Quantification of immunofluorescence analysis in (B–C′) (N = 4 eyes P347S and N = 6 eyes P347S/ miR‐181a/b+/−).
- G
Quantification of TUNEL analysis in (D, E) (N = 3 eyes/genotype).
- A–C
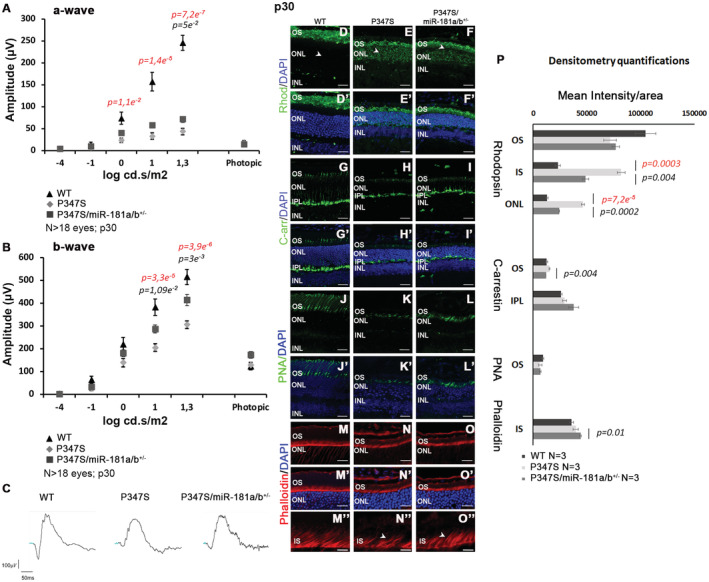
ERG response [a‐wave in (A) and b‐wave in (B)], recorded in scotopic conditions, of WT, P347S and P347S/miR‐181a/b+/− animals at p30; N ≥ 18 eyes. Data are presented as mean ± SD. Two‐way ANOVA test. Representative curves are reported in (C).
- D–P
Immunofluorescence analysis showed amelioration of Rhodopsin localization (D–F′; white arrowheads); C‐arrestin expression (G–I′) and PR outer segment (OS) and inner segment (IS) structures, as determined, respectively, by PNA (J–L′); and Phalloidin staining (M–O″) in P347S/miR‐181a/b+/− versus P347S eyes at p30. (M″–O″) show higher magnification of (M–O). Scale bars 25 μm in (D–O′); 5 μm in (M″–O″). Fluorescence densitometry quantification of each staining is reported in (P), N = 3 eye/genotype for each staining. WT versus P347S P‐values are reported in red, P347S versus P347S/miR‐181a/b+/− P‐values are reported in black. Data are presented as mean ± SEM. Student's t‐test, unpaired.

- A–C
ERG response [a‐wave in (A) and b‐wave in (B)], recorded in scotopic conditions, of P347S and P347S/miR‐181a/b+/− animals at p90; N ≥ 20 eyes/genotype. Data are presented as mean ± SD. Two‐way ANOVA test. Representative curves are reported in (C).
- D–L
Immunofluorescence analysis of Rhodopsin (D–E′), C‐arrestin (F–G′), PNA (H–I′); and Phalloidin staining (J–K″) in P347S and P347S/miR‐181a/b+/− retinas at p90. (J″–K″) show higher magnification of (J–K). Scale bars 25 μm in (D–K′); 10 μm in (J″–K″). Fluorescence densitometry quantification of each staining is reported in (L), N = 3 eye/genotype/staining. Data are presented as mean ± SEM. Student's t‐test, unpaired.
- M
Measurement of P347S and P347S/miR‐181a/b+/− ONL thickness (N ≥ 3 eyes/genotype; Data are presented as mean ± SEM. Student's t‐test, unpaired).
- N
Graphical representation of the results of OKR analysis by the optokinetic tracking assays reported as cycles/degree. Visual acuity is preserved in P347S/miR‐181a/b+/− animals with respect to P347S (N = 4 animals/genotype). Data are presented as mean ± SEM. Student's t‐test, unpaired.

- A–D
DAPI staining of P347S (A) and P347S/miR‐181a/b+/− (B) retinas highlighted no difference in ONL thickness and number of nuclei in the ONL, as quantified in (C) and (D). N = 3 eyes/genotype. Data are presented as mean ± SEM. Student's t‐test, unpaired. Scale bars are 50 μm in (A, B).
- E–H
Immunofluorescence analysis showed amelioration of Recoverin staining in the ONL and the Inner Plexiform Layer (IPL) in P347S/miR‐181a/b+/− versus P347S eyes at p30. Scale bars 25 μm. Fluorescence densitometry quantification of Recoverin staining is reported in (H), N = 3 eye/genotype. WT versus P347S P‐values are reported in red, P347S versus P347S/miR‐181a/b+/− P‐values are reported in black. Data are presented as mean ± SEM. Student's t‐test.
- I–K
Electron microscopy analysis shows increased length of PR OS in P347S/miR‐181a/b+/− versus P347S, quantified in (K) (N = 2 animals/genotype); Data are presented as mean ± SEM. Student's t‐test, unpaired; Scale bars are 1 μm in (I, J).

- A
Gene ontology analysis [Cellular component (CC) terms] shows a significant downregulation of mitochondria‐related gene pathways in P347S versus WT retinas at p12, as assessed by transcriptome analysis.
- B–F
Electron microscopy analysis shows an increase of mitochondrial fragmentation in P347S PRs with respect to WT and amelioration of the mitochondrial phenotype in P347S/miR‐181a/b+/− versus P347S PRs at p12 and p30 (N = 2 animals/genotype). M, mitochondria.
- G–I
The quantitative analysis of mitochondrial phenotype is expressed as measurement of the mitochondria perimeter (G), mitochondria number (H) and as the ratio of mitochondria area per the analyzed field area (I). N = 2 animals/genotype.

- A–E
Immunofluorescence analysis showed a decrease of Citrate Synthase (CS) staining, a mitochondrial marker, in the OS of P347S retinas versus WT (A) at p12 (B) and p30 (D). The analysis highlights an amelioration of CS staining in P347S/miR‐181a/b+/− versus P347S eyes at both p12 (C) and p30 (E) (Red triangles). (A′–E′) show higher magnification of (A–E). Scale bars 25 μm.
- F, G
WB analysis reveals decreased levels of OXPHOS, representative of Mitochondrial Respiratory Chain complexes, and CS proteins in the eyes of P347S with respect to WT, and partial rescue of these parameters in P347S/miR‐181a/b+/− versus P347S PR at p30 [quantified in (G)]. Data are normalized to p115. N = 3 eyes/genotype.
- H, I
WB analysis of key proteins involved in mitochondrial fission/fusion pathway (Fis1 Opa1 and Mfn1/2 proteins) in the eyes of WT, P347S and in P347S/miR‐181a/b+/− at p30 [quantified in (I)]. Data are normalized to Gapdh. N ≥ 4 eye/genotype.
- A
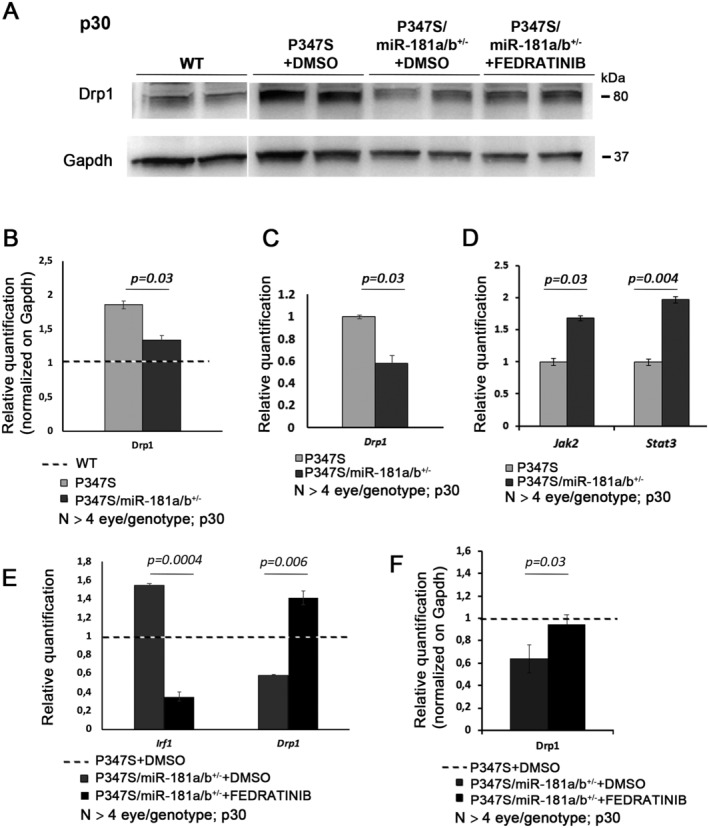
WB analysis of Drp1, one of the key proteins involved in the mitochondrial fission pathway, in the optic cup of WT, P347S DMSO‐treated, P347S/miR‐181a/b+/− DMSO‐treated and of P347S/miR‐181a/b+/− FEDRATINIB‐treated (an inhibitor of the JAK2/STAT3 pathway) mice at p30.
- B
Quantification revealed that Drp1 protein levels are increased in P347S with respect to WT, and partially rescued in P347S/miR‐181a/b+/−. Data are normalized to Gapdh. N ≥ 4 eye/genotype. Please note that all compared bands from WT, P347S, P347S/miR‐181a/b+/− and P347S/miR‐181a/b+/− with FEDRATINIB samples are from the same blots, which were cropped and shown organized in the panel for the sake of data presentation clarity (see source data).
- C, D
qRT–PCR analysis reveals decreased levels of the Drp1 transcript and increased levels of Stat3 and Jak2 transcripts in the eyes of P347S/miR‐181a/b+/− versus those of P347S animals. N ≥ 4 eyes/genotype.
- E
qRT–PCR analysis on ex vivo retinas reveals that the treatment with FEDRATINIB counter‐rescued the upregulation of Irf1 and the downregulation of Drp1 transcript levels in P347S/miR‐181a/b+/− animals. N ≥ 4 eyes/genotype.
- F
Quantification of WB in A reveals decreased levels of Drp1 in P347S/miR‐181a/b+/− DMSO‐treated versus P347S and increased levels in P347S/miR‐181a/b+/− FEDRATINIB‐treated ex‐vivo retinas. N ≥ 4 eyes/genotype.

- A, B
WB analysis of P347S/miR‐181a/b+/− versus P347S total eye protein extracts at p30 showed increased levels of total Stat3 and p705‐Stat3. No statistically significant variation was observed for p‐727‐Stat3. Data are normalized to p115. Relative protein quantifications are reported in (B). N = 4 eyes/genotype. Data are presented as mean of Fold Change ± SEM. Student's t‐test.
- C–G
Immunofluorescence analysis of Stat3 in P347S and P347S/miR‐181a/b+/− retinas at p30. (E, F) and (E′, F′) show higher magnification of (C, D) and (C′, D′), respectivey. Scale bars 25 μm. Fluorescence densitometry quantification of Stat3 in the ONL is reported in (G), N = 3 eye/genotype for each staining. Data are presented as mean ± SEM. Student's t‐test, unpaired.
- H
qRT–PCR analysis reveals increased levels of p705‐Stat3 transcriptional target genes in the eyes of P347S/miR‐181a/b+/− versus P347S animals. N ≥ 4 eyes/genotype. Data are presented as mean of Fold Change ± SEM. Student's t‐test, unpaired.
- I, J
WB analysis of total Stat3 and p705‐Stat3 in the optic cup of P347S DMSO‐treated, P347S/miR‐181a/b+/− DMSO‐treated and of P347S/miR‐181a/b+/− FEDRATINIB‐treated (an inhibitor of the JAK2/STAT3 pathway) mice at p30 [quantified in (J)] revealed that FEDRATINIB is inhibiting JAK2 activity in the treated samples as showed by the reduction of p705‐Stat3 protein levels in P347S/miR‐181a/b+/− FEDRATINIB‐treated. Data are normalized to Gapdh. N ≥ 4 eye/genotype. Data are presented as mean of Fold Change ± SEM. Student's t‐test, unpaired.

- A–C
ERG response (b‐wave) reported as Delta (Δ) amplitude in P347S animals injected at p4 with AAV2/8.CMV.GFP‐Sponge‐miR‐181a/b, AAV2/8.CMV.RHO‐Sponge‐miR‐181a/b, AAV2/8.VMD2.GFP‐Sponge‐miR‐181a/b vectors with respect to the corresponding controls (AAV2/8.CMV.GFP, AAV2/8.RHO.GFP and AAV2/8.VMD2.GFP; red dotted line) at p30 (A; N ≥ 18 eyes/treatment, for each promoter vector) and p70 (B; N ≥ 15 eyes/treatment, for each promoter vector). P‐values of comparison between AAV2/8.CMV.RHO‐Sponge‐miR‐181a/b‐injected eyes and corresponding control (AAV2/8.RHO.GFP) are shown in red, whereas P‐values of comparison between AAV2/8.CMV.GFP‐Sponge‐miR‐181a/b‐injected eyes and corresponding controls (AAV2/8.CMV.GFP) are shown in black. Data are presented as mean of Delta (Δ) amplitude ± SD. Two‐way ANOVA test. P30 representative curves at 20 candles are reported in (C).
- D–U
Immunofluorescence analysis showed amelioration of Rhodopsin localization (p30 D–G′, p70 L–O′; white arrowheads) and C‐arrestin (p30 H–K′, p70 P–S′; white arrowheads) expression in Sponge‐miR‐181a/b‐injected eyes versus the corresponding controls also highlighting improvement of the OS structure. At both time points the effect of amelioration was more significant and evident when the AAV2/8.CMV.GFP‐Sponge‐miR‐181a/b was used. Scale bars are 25 μm. Fluorescence densitometry quantification of each staining is reported in T for p30 and in (U) for p70, N = 3 eye/treatment/staining. Data are presented as mean of Fold Change ± SEM. Student's t‐test, paired.

- A–C
ERG response (a‐wave) reported as Delta (Δ) amplitude in P347S animals injected at p4 with AAV2/8.CMV.GFP‐Sponge‐miR‐181a/b, AAV2/8.CMV.RHO‐Sponge‐miR‐181a/b, AAV2/8.VMD2.GFP‐Sponge‐miR‐181a/b vectors with respect to the corresponding controls (AAV2/8.CMV.GFP, AAV2/8.RHO.GFP and AAV2/8.VMD2.GFP; red dotted line) at p30 (A; N ≥ 18 eyes/treatment, for each promoter vector) and p70 (B; N ≥ 15 eyes/treatment, for each promoter vector). Data are presented as mean of Delta (Δ) amplitude ± SD. Two‐way ANOVA test. P70 representative curves at 20 candles are reported in (C).
- D–H
TUNEL analysis in the ONL of AAV2/8.CMV.GFP (D, F; black triangles N = 3) and AAV2/8.CMV.GFP‐Sponge‐miR‐181a/b (E, G; N = 4) sub‐retinally‐injected P347S retinas at p30; quantification in (H). Data are presented as mean of Fold Change ± SEM. Student's t‐test.
- I–L
Immunofluorescence analysis of Citrate Synthase staining (Red triangles) in AAV2/8.CMV.GFP‐Sponge‐miR‐181a/b (J, J′, L) versus AAV2/8.CMV.GFP (I, I′, K). (I′–J′) show higher magnification of (I–J). Scale bars are 25 μm.
- A–I
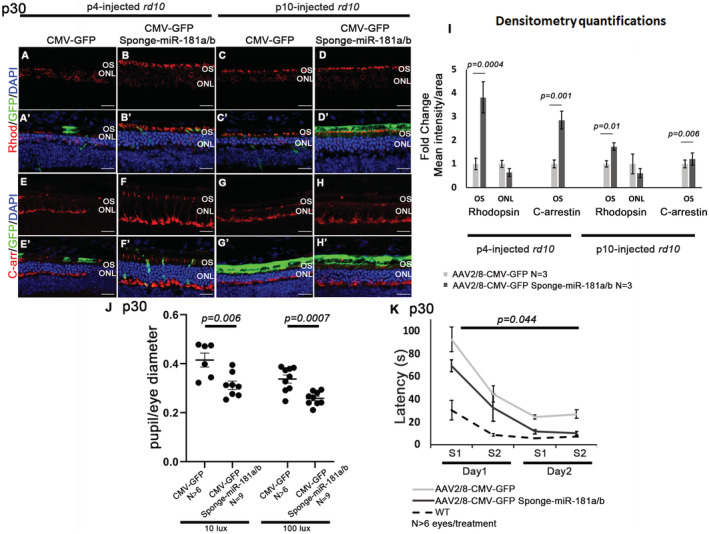
Immunofluorescence analysis on central retinal sections at p30 showed ONL thickness increase, amelioration of Rhodopsin localization (A–D′) and C‐arrestin expression (E–H′) in AAV2/8.CMV.GFP‐Sponge‐miR‐181a/b‐injected versus AAV2/8.CMV.GFP‐injected rd10 eyes. Scale bars are 25 μm. Fluorescence densitometry quantification of each staining is reported in (I), N = 3 eye/treatment/staining. Data are presented as mean of Fold Change ± SEM. Student's t‐test, paired.
- J, K
Analysis of retinal function based on pupillary light responses (PLR) Water Maze tests. (J) PLR showed a significantly higher pupil constriction in rd10 mice injected with AAV2/8.CMV.GFP‐Sponge‐miR‐181a/b than in AAV2/8.CMV.GFP‐injected rd10 eyes, at both 10 lux and 100 lux intensity stimuli (N ≥ 6 eyes/treatment and N = 9 eyes/treatment, respectively). Data are presented as mean ± SEM. Student's t‐test, unpaired. (K) Water maze test highlighted a shorter latency in reaching the platform in AAV2/8.CMV.GFP‐Sponge‐miR‐181a/b‐injected animals respect to control‐injected ones (N ≥ 6 eyes/treatment). Data are presented as mean ± SD. ANOVA test. S1 is for Session1 and S2 is for Session2.

- A–E
Immunofluorescence analysis of Recoverin at p30 in p4‐injected‐ (A–B′) and in p10‐injected‐rd10 (C–D′) with AAV2/8.CMV.GFP‐Sponge‐miR‐181a/b (B, B′ and D, D′) and the corresponding control (AAV2/8.CMV.GFP; A, A′ and C, C′). Scale bars are 25 μm. Fluorescence densitometry quantification of Recoverin staining is reported in (E), N = 3 eye/treatment for each staining. Data are presented as mean of Fold Change ± SEM. Student's t‐test.
- F–I″
Immunofluorescence analysis of Citrate Synthase (Red triangles) at p30 in p4‐injected‐ (F–G″) and in p10‐injected‐rd10 (H–I″) with AAV2/8.CMV.GFP‐Sponge‐miR‐181a/b (G–G″ and I–I″) the corresponding control (AAV2/8.CMV.GFP F–F″ and H–H″). (F′–H′) show higher magnification of (F–I). Scale bars are 25 μm.
- J–L
ERG response in rd10 animals injected at p4 [a‐wave in (J) and b‐wave in (K)] with AAV2/8.CMV.GFP‐Sponge‐miR‐181a/b with respect to the corresponding control vectors (AAV2/8.CMV.GFP) at p30 (N = 8 eyes/treatment). Data are presented as mean ± SD. Two‐way ANOVA test. Representative curves at 20 candles are reported in (L).
- M–O
ERG response in rd10 animals injected at p10 [a‐wave in (M) and b‐wave in (N)] with AAV2/8.CMV.GFP‐Sponge‐miR‐181a/b with respect to the corresponding control vectors (AAV2/8.CMV.GFP) at p30 (N = 10 eyes/treatment). Data are presented as mean ± SD. Two‐way ANOVA test. Representative curves at 20 candles are reported in (O).
References
-
- Anastasia I, Ilacqua N, Raimondi A, Lemieux P, Ghandehari‐Alavijeh R, Faure G, Mekhedov SL, Williams KJ, Caicci F, Valle G et al (2021) Mitochondria‐rough‐ER contacts in the liver regulate systemic lipid homeostasis. Cell Rep 34: 108873 - PubMed
-
- Apte RS (2018) Gene therapy for retinal degeneration. Cell 173: 5 - PubMed
Publication types
MeSH terms
Substances
LinkOut - more resources
Full Text Sources
Miscellaneous
