

Concomitant deletion of Ptpn6 and Ptpn11 in T cells fails to improve anticancer responses
- PMID: 36194675
- PMCID: PMC9638855
- DOI: 10.15252/embr.202255399
Concomitant deletion of Ptpn6 and Ptpn11 in T cells fails to improve anticancer responses
Abstract
Anticancer T cells acquire a dysfunctional state characterized by poor effector function and expression of inhibitory receptors, such as PD-1. Blockade of PD-1 leads to T cell reinvigoration and is increasingly applied as an effective anticancer treatment. Recent work challenged the commonly held view that the phosphatase PTPN11 (known as SHP-2) is essential for PD-1 signaling in T cells, suggesting functional redundancy with the homologous phosphatase PTPN6 (SHP-1). Therefore, we investigated the effect of concomitant Ptpn6 and Ptpn11 deletion in T cells on their ability to mount antitumour responses. In vivo data show that neither sustained nor acute Ptpn6/11 deletion improves T cell-mediated tumor control. Sustained loss of Ptpn6/11 also impairs the therapeutic effects of anti-PD1 treatment. In vitro results show that Ptpn6/11-deleted CD8+ T cells exhibit impaired expansion due to a survival defect and proteomics analyses reveal substantial alterations, including in apoptosis-related pathways. These data indicate that concomitant ablation of Ptpn6/11 in polyclonal T cells fails to improve their anticancer properties, implying that caution shall be taken when considering their inhibition for immunotherapeutic approaches.
Keywords: PD-1 checkpoint blockade; Ptpn11; Ptpn6; T cell exhaustion.
© 2022 The Authors. Published under the terms of the CC BY 4.0 license.
Figures
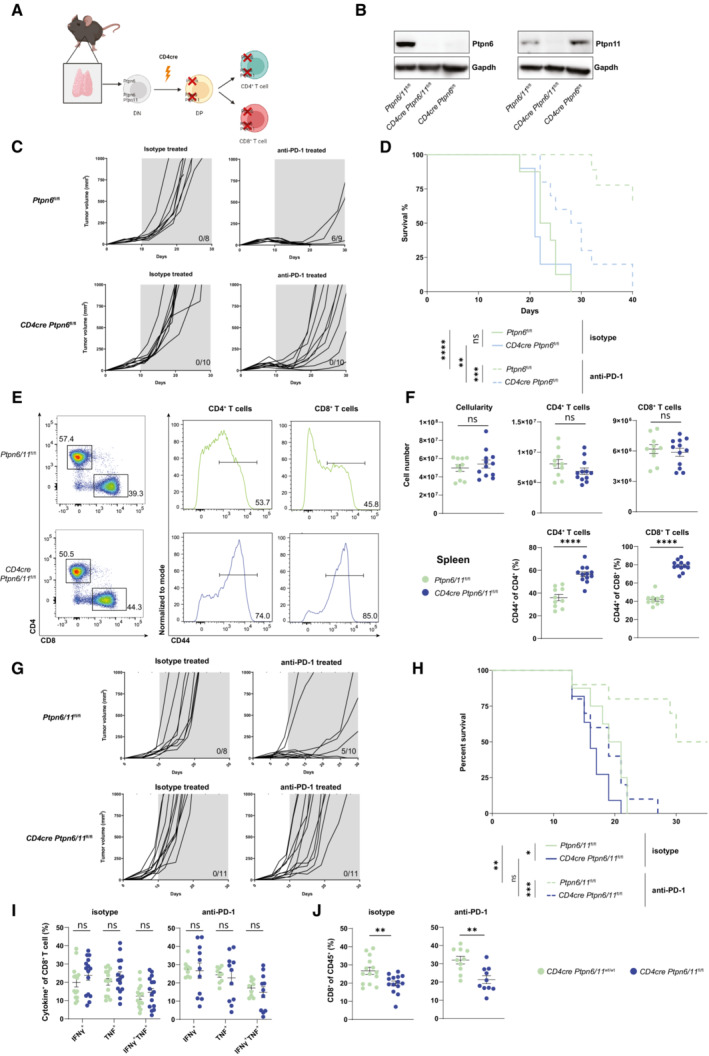
- A
The schematic illustrates CD4cre‐mediated deletion of Ptpn6 or Ptpn6/11 during thymic T cell development; double‐negative thymocytes (DN) and double‐positive thymocytes (DP) are depicted. Created with Biorender (
Biorender.com ). - B
Total T cells were enriched from spleens of Ptpn6 fl/fl /Ptpn11 fl/flWbm, CD4cre Ptpn6 fl/fl /Ptpn11 fl/flWbm, CD4cre Ptpn6 fl/fl mice. Expression of Ptpn6 and Ptpn11 was tested by immunoblot in cell lysates, Gapdh was used as loading control.
- C, D
CD4cre Ptpn6 fl/fl and control mice were subcutaneously injected with MC38 cells. Tumor growth in individual mice is shown for the indicated genotypes and treatments; number of mice eradicating the tumor is shown within the graphs (C). Survival curves are shown (D).
- E, F
A representative flow cytometry plot (E), spleen cellularity, CD4+ T cell (gated as TCRβ+ CD4+) numbers, CD8+ T cell (gated as TCRβ+ CD8+) numbers, and percentages of CD44+ T cells (F) from the spleens of CD4cre Ptpn6 fl/fl /Ptpn11 fl/flWbm and control mice are shown.
- G, H
Tumor growth in individual mice challenged with MC38 and subsequently treated with anti‐PD‐1 antibody or isotype control is shown for each indicated genotype; number of mice eradicating the tumor is shown within the graphs (G). Survival curves of CD4cre Ptpn6 fl/fl /Ptpn11 fl/flWbm and control mice is shown (H).
- I, J
Ten to twelve days following MC38 tumor inoculation and treatment with anti‐PD‐1 antibody or isotype control, CD4cre Ptpn6/11 wt/wt and CD4cre Ptpn6 fl/fl /Ptpn11 fl/flWbm mice were sacrificed, and TILs analyzed. Graphs depict frequencies of CD8+ T cells (gated as CD45+ TCRβ+ CD8+) expressing IFN‐γ and TNFα upon re‐stimulation (I) and percentages of CD8+ T cells (J).
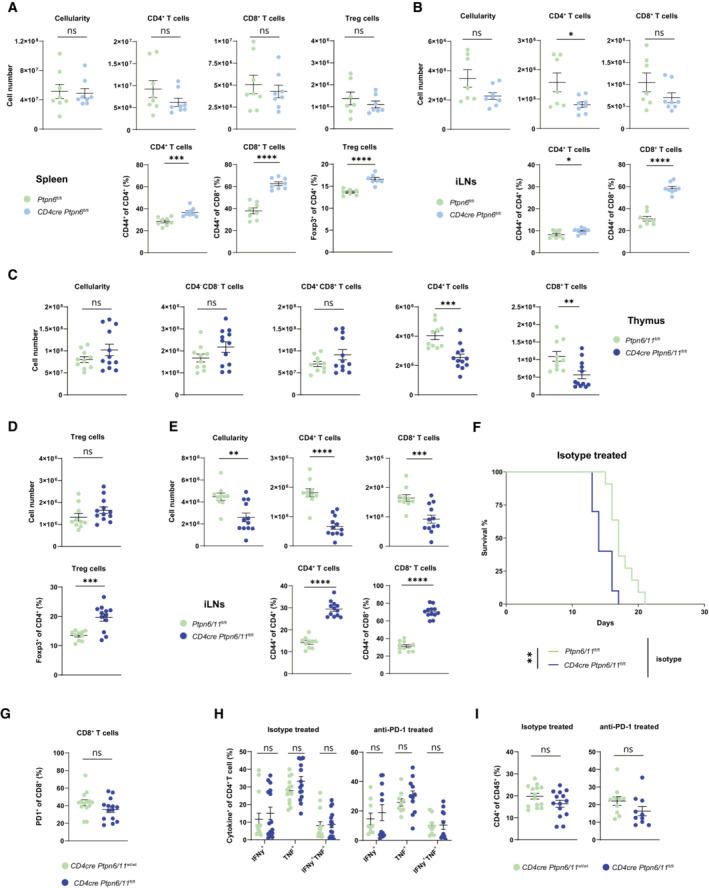
- A, B
T cells from spleen (A) and inguinal lymph nodes (iLN) (B) of CD4cre Ptpn6 fl/fl and control mice were analyzed. Cellularity, CD4+ and CD8+ T cell numbers (gated as TCRβ+ CD4+ or CD8+, respectively), percentages of CD44 high T cells are shown; regulatory T cell (Treg) numbers and frequency (gated as TCRβ+ CD4+ Foxp3+) are illustrated for the spleen.
- C
Cellularity from thymus and number of CD4 and CD8 double‐negative, double‐positive, CD4 or CD8 single‐positive thymocytes (gated on lineage−; single‐positives, an additional gate on TCRβ+ was performed) of CD4cre Ptpn6 fl/fl /Ptpn11 fl/flWbm and control mice are depicted.
- D
Treg number and frequency (gated as TCRβ+ CD4+ Foxp3+) are illustrated for the spleen of CD4cre Ptpn6 fl/fl /Ptpn11 fl/flWbm and control mice.
- E
Cellularity, CD4+ and CD8+ T cell numbers, as well as percentages of CD44 high T cells from the iLN of CD4cre Ptpn6 fl/fl /Ptpn11 fl/flWbm and control mice are shown.
- F
Survival curves of CD4cre Ptpn6 fl/fl /Ptpn11 fl/flBgn and control mice challenged with MC38.
- G–I
Ten to twelve days following MC38 tumor inoculation, isotype‐treated CD4cre Ptpn6/11 wt/wt and CD4cre Ptpn6 fl/fl /Ptpn11 fl/flWbm mice were sacrificed. Graph depicts the frequencies of PD‐1+ CD8+ T cells (gated as CD45+ TCRβ+ CD8+) in the tumor (G). Frequencies of CD4+ T cells (gated as CD45+ TCRβ+ CD4+) expressing IFN‐γ and TNFα upon re‐stimulation (H) and percentages of CD4+ T cells in the tumor are shown (I).
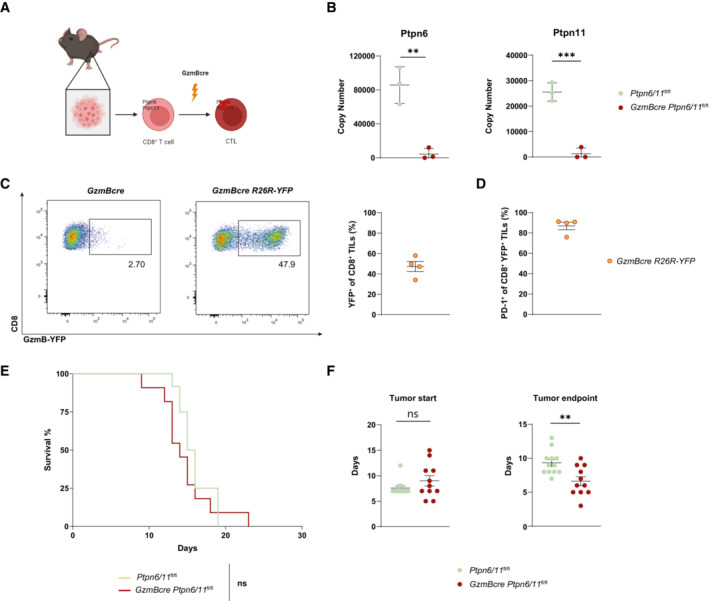
- A
The schematic illustrates GzmBcre‐mediated deletion of Ptpn6/11 following cancer challenge; CD8+ T cells and cytotoxic T lymphocytes (CTLs) are depicted. Created with Biorender (
Biorender.com ). - B
Ptpn6 and Ptpn11 copy number, as estimated through high resolution mass spectrometry in GzmBcre Ptpn6/11 fl/fl and control CTLs.
- C, D
GzmBcre R26R‐YFP reporter mice were injected subcutaneously with MC38 cells and analyzed after 11 days. Graphs show the percentage of YFP+ cells among CD45+ CD8+ TILs (C) and the percentage of PD‐1+ cells among CD45+ CD8+ YFP+ TILs (D). Results depict n = 4 mice (C, D).
- E, F
GzmBcre Ptpn6/11 fl/fl and control Ptpn6/11 fl/fl mice were subcutaneously injected with MC38 cells. Survival curves and statistical comparisons between different groups are shown (E). The tumor start depicts the time (days) following tumor engraftment after which the tumor is palpable, while tumor endpoint depicts the time (days) from tumor start until the reaching the maximal allowed tumor size (F).
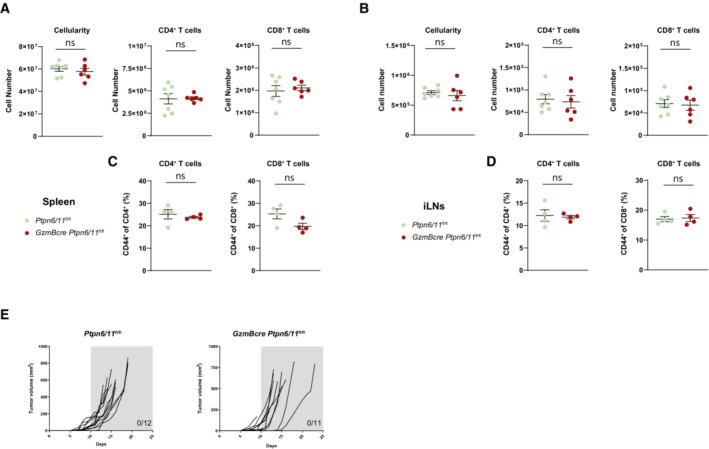
- A–D
Spleen and iLN of GzmBcre Ptpn6/11 fl/fl mice and control mice were analyzed. Cellularity, CD4+ and CD8+ T cell numbers are depicted for spleen (A) and iLN (B). Percentages of CD44 high of CD4+ and CD8+ T cells are shown for spleen (C) and iLN (D). Results depict n = 6–7 mice/group (A, B) and n = 4 mice/group for percentages of CD44 high cells (C, D). Student's t‐test (unpaired, two‐tailed) was used to compare differences between experimental groups.
- E
Tumor growth in individual mice challenged with MC38 is shown for the indicated genotypes; number of mice eradicating the tumor is shown within the graphs.
- A, B
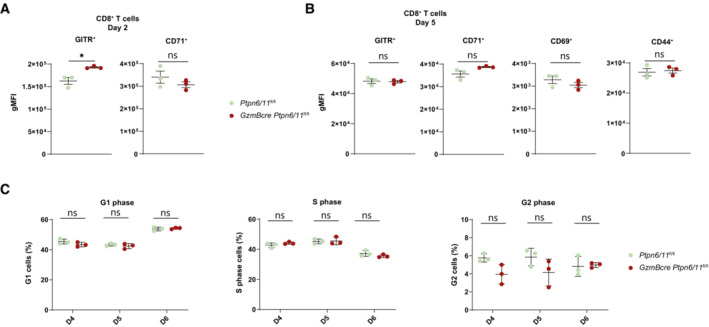
CD8+ T cells were analyzed by flow cytometry for surface expression of GITR and CD71 after 2 days (A) and for surface expression of GITR, CD71, CD69, and CD44 after 5 days (B); a quantification of these parameters is shown in the graphs (A and B).
- C
Graphs depict the percentages of cells in G1, S, and G2 phase as measured by flow cytometry‐based cell cycle analysis of Ptpn6/11 fl/fl and GzmBcre Ptpn6/11 fl/fl CTLs (gated on CD8+ T cells) at the indicated days.
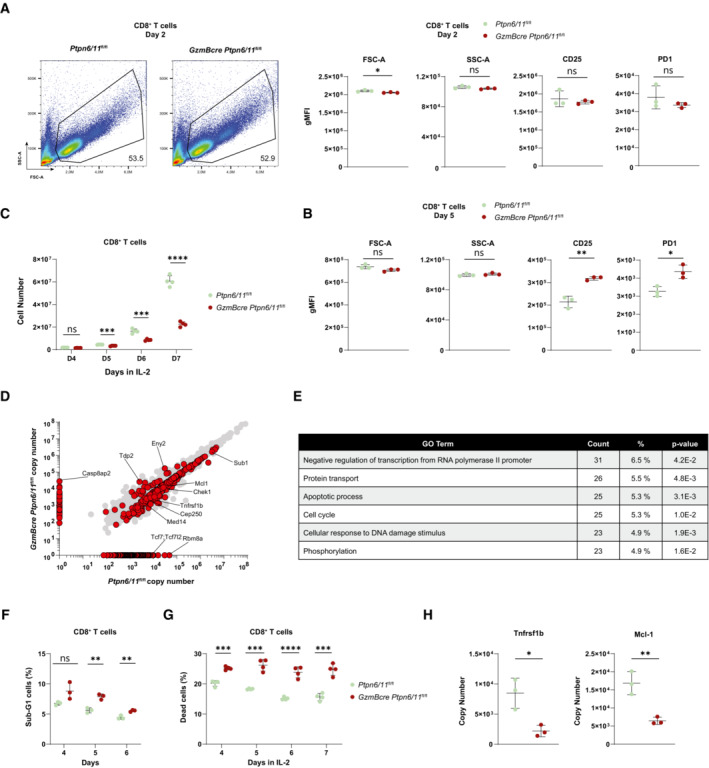
- A, B
CD8+ T cells (gated DAPI− cells) were analyzed by flow cytometry for size, granularity, and surface expression of CD25 and PD‐1 after 2 days (A) and after 5 days (B); a quantification of these parameters is shown in the graphs (A, B) and a representative flow cytometry plot is shown for FSC and SSC (A).
- C
Numbers of CTLs (gated on CD8+ T cells) from Ptpn6/11 fl/fl or GzmBcre Ptpn6/11 fl/fl mice were counted daily by flow cytometry with the addition of DAPI to monitor dead cells.
- D
Quantitative high‐resolution mass spectrometry was used to resolve the proteome of Ptpn6/11 fl/fl and GzmBcre Ptpn6/11 fl/fl CTLs (day 7). The plot depicts protein copy number in control and GzmBcre Ptpn6/11 fl/fl cells. Significantly altered proteins are indicated in red; selected examples are annotated. Results are based on n = 3 biological replicates and two‐tailed, unequal‐variance t‐test on log10 transformed copy number per cell values was used to compare differences between experimental groups.
- E
GO Term analysis shows the enriched pathways with at least 23 proteins and a P‐value < 0.05, % indicate the % altered genes on the total genes in a given pathway.
- F
Graph shows the percentage of sub‐G1 cells as measured by flow cytometry‐based cell cycle analysis of Ptpn6/11 fl/fl and GzmBcre Ptpn6/11 fl/fl CTLs (gated on CD8+ T cells) at the indicated days.
- G
Graph illustrates the percentage of DAPI+ dead cells of Ptpn6/11 fl/fl and GzmBcre Ptpn6/11 fl/fl CTLs (gated on CD8+ T cells) at the indicated days as measured by flow cytometry.
- H
Protein copy number of Tnfrsf1b and Mcl‐1 in GzmBcre Ptpn6/11 fl/fl and control CTLs, as estimated through high resolution mass spectrometry.
Similar articles
-
SHP-1 phosphatase activity counteracts increased T cell receptor affinity.J Clin Invest. 2013 Mar;123(3):1044-56. doi: 10.1172/JCI65325. Epub 2013 Feb 8. J Clin Invest. 2013. PMID: 23391724 Free PMC article.
-
Shp-2 Is Dispensable for Establishing T Cell Exhaustion and for PD-1 Signaling In Vivo.Cell Rep. 2018 Apr 3;23(1):39-49. doi: 10.1016/j.celrep.2018.03.026. Cell Rep. 2018. PMID: 29617671
-
The Analysis of PTPN6 for Bladder Cancer: An Exploratory Study Based on TCGA.Dis Markers. 2020 May 13;2020:4312629. doi: 10.1155/2020/4312629. eCollection 2020. Dis Markers. 2020. PMID: 32454905 Free PMC article.
-
The regulatory effects of PTPN6 on inflammatory process: Reports from mice to men.Arch Biochem Biophys. 2022 May 30;721:109189. doi: 10.1016/j.abb.2022.109189. Epub 2022 Mar 17. Arch Biochem Biophys. 2022. PMID: 35307366 Review.
-
Inhibitory leukocyte immunoglobulin-like receptors: Immune checkpoint proteins and tumor sustaining factors.Cell Cycle. 2016;15(1):25-40. doi: 10.1080/15384101.2015.1121324. Cell Cycle. 2016. PMID: 26636629 Free PMC article. Review.
Cited by
-
CRISPR/Cas9-mediated SHP-1-knockout T cells combined with simvastatin enhances anti-tumor activity in humanized-PDX HCC model.iScience. 2025 Mar 22;28(4):112266. doi: 10.1016/j.isci.2025.112266. eCollection 2025 Apr 18. iScience. 2025. PMID: 40241752 Free PMC article.
-
Consideration of SHP-1 as a Molecular Target for Tumor Therapy.Int J Mol Sci. 2023 Dec 26;25(1):331. doi: 10.3390/ijms25010331. Int J Mol Sci. 2023. PMID: 38203502 Free PMC article. Review.
-
T lymphocyte-specific deletion of SHP1 and SHP2 promotes activation-induced cell death of CD4+ T cells and impairs antitumor response.Proc Natl Acad Sci U S A. 2025 Jul 22;122(29):e2427254122. doi: 10.1073/pnas.2427254122. Epub 2025 Jul 14. Proc Natl Acad Sci U S A. 2025. PMID: 40658856
-
PD1 inhibits PKCθ-dependent phosphorylation of cytoskeleton-related proteins and immune synapse formation.Blood Adv. 2024 Jun 11;8(11):2908-2923. doi: 10.1182/bloodadvances.2023011901. Blood Adv. 2024. PMID: 38513140 Free PMC article.
-
Conserved developmental rewiring of the TCR signalosome drives tolerance in innate-like lymphocytes.bioRxiv [Preprint]. 2025 May 13:2023.09.01.555859. doi: 10.1101/2023.09.01.555859. bioRxiv. 2025. PMID: 40463269 Free PMC article. Preprint.
References
-
- Carrington EM, Zhan Y, Brady JL, Zhang JG, Sutherland RM, Anstee NS, Schenk RL, Vikstrom IB, Delconte RB, Segal D et al (2017) Anti‐apoptotic proteins BCL‐2, MCL‐1 and A1 summate collectively to maintain survival of immune cell populations both in vitro and in vivo . Cell Death Differ 24: 878–888 - PMC - PubMed
-
- Celis‐Gutierrez J, Blattmann P, Zhai Y, Jarmuzynski N, Ruminski K, Gregoire C, Ounoughene Y, Fiore F, Aebersold R, Roncagalli R et al (2019) Quantitative interactomics in primary T cells provides a rationale for concomitant PD‐1 and BTLA coinhibitor blockade in cancer immunotherapy. Cell Rep 27: 3315–3330 - PMC - PubMed
-
- Chemnitz JM, Parry RV, Nichols KE, June CH, Riley JL (2004) SHP‐1 and SHP‐2 associate with immunoreceptor tyrosine‐based switch motif of programmed death 1 upon primary human T cell stimulation, but only receptor ligation prevents T cell activation. J Immunol 173: 945–954 - PubMed
-
- Dance M, Montagner A, Salles JP, Yart A, Raynal P (2008) The molecular functions of Shp2 in the Ras/Mitogen‐activated protein kinase (ERK1/2) pathway. Cell Signal 20: 453–459 - PubMed
Publication types
MeSH terms
Substances
Grants and funding
LinkOut - more resources
Full Text Sources
Molecular Biology Databases
Research Materials
Miscellaneous
