Case Reports
. 2022 Nov 11;3(11):774-791.e7.
doi: 10.1016/j.medj.2022.09.002. Epub 2022 Oct 3.

Validation of a non-oncogene encoded vulnerability to exportin 1 inhibition in pediatric renal tumors

Affiliations
Case Reports

Validation of a non-oncogene encoded vulnerability to exportin 1 inhibition in pediatric renal tumors

Diego F Coutinho et al. Med. .

Abstract

Background: Malignant rhabdoid tumors (MRTs) and Wilms' tumors (WTs) are rare and aggressive renal tumors of infants and young children comprising ∼5% of all pediatric cancers. MRTs are among the most genomically stable cancers, and although WTs are genomically heterogeneous, both generally lack therapeutically targetable genetic mutations.

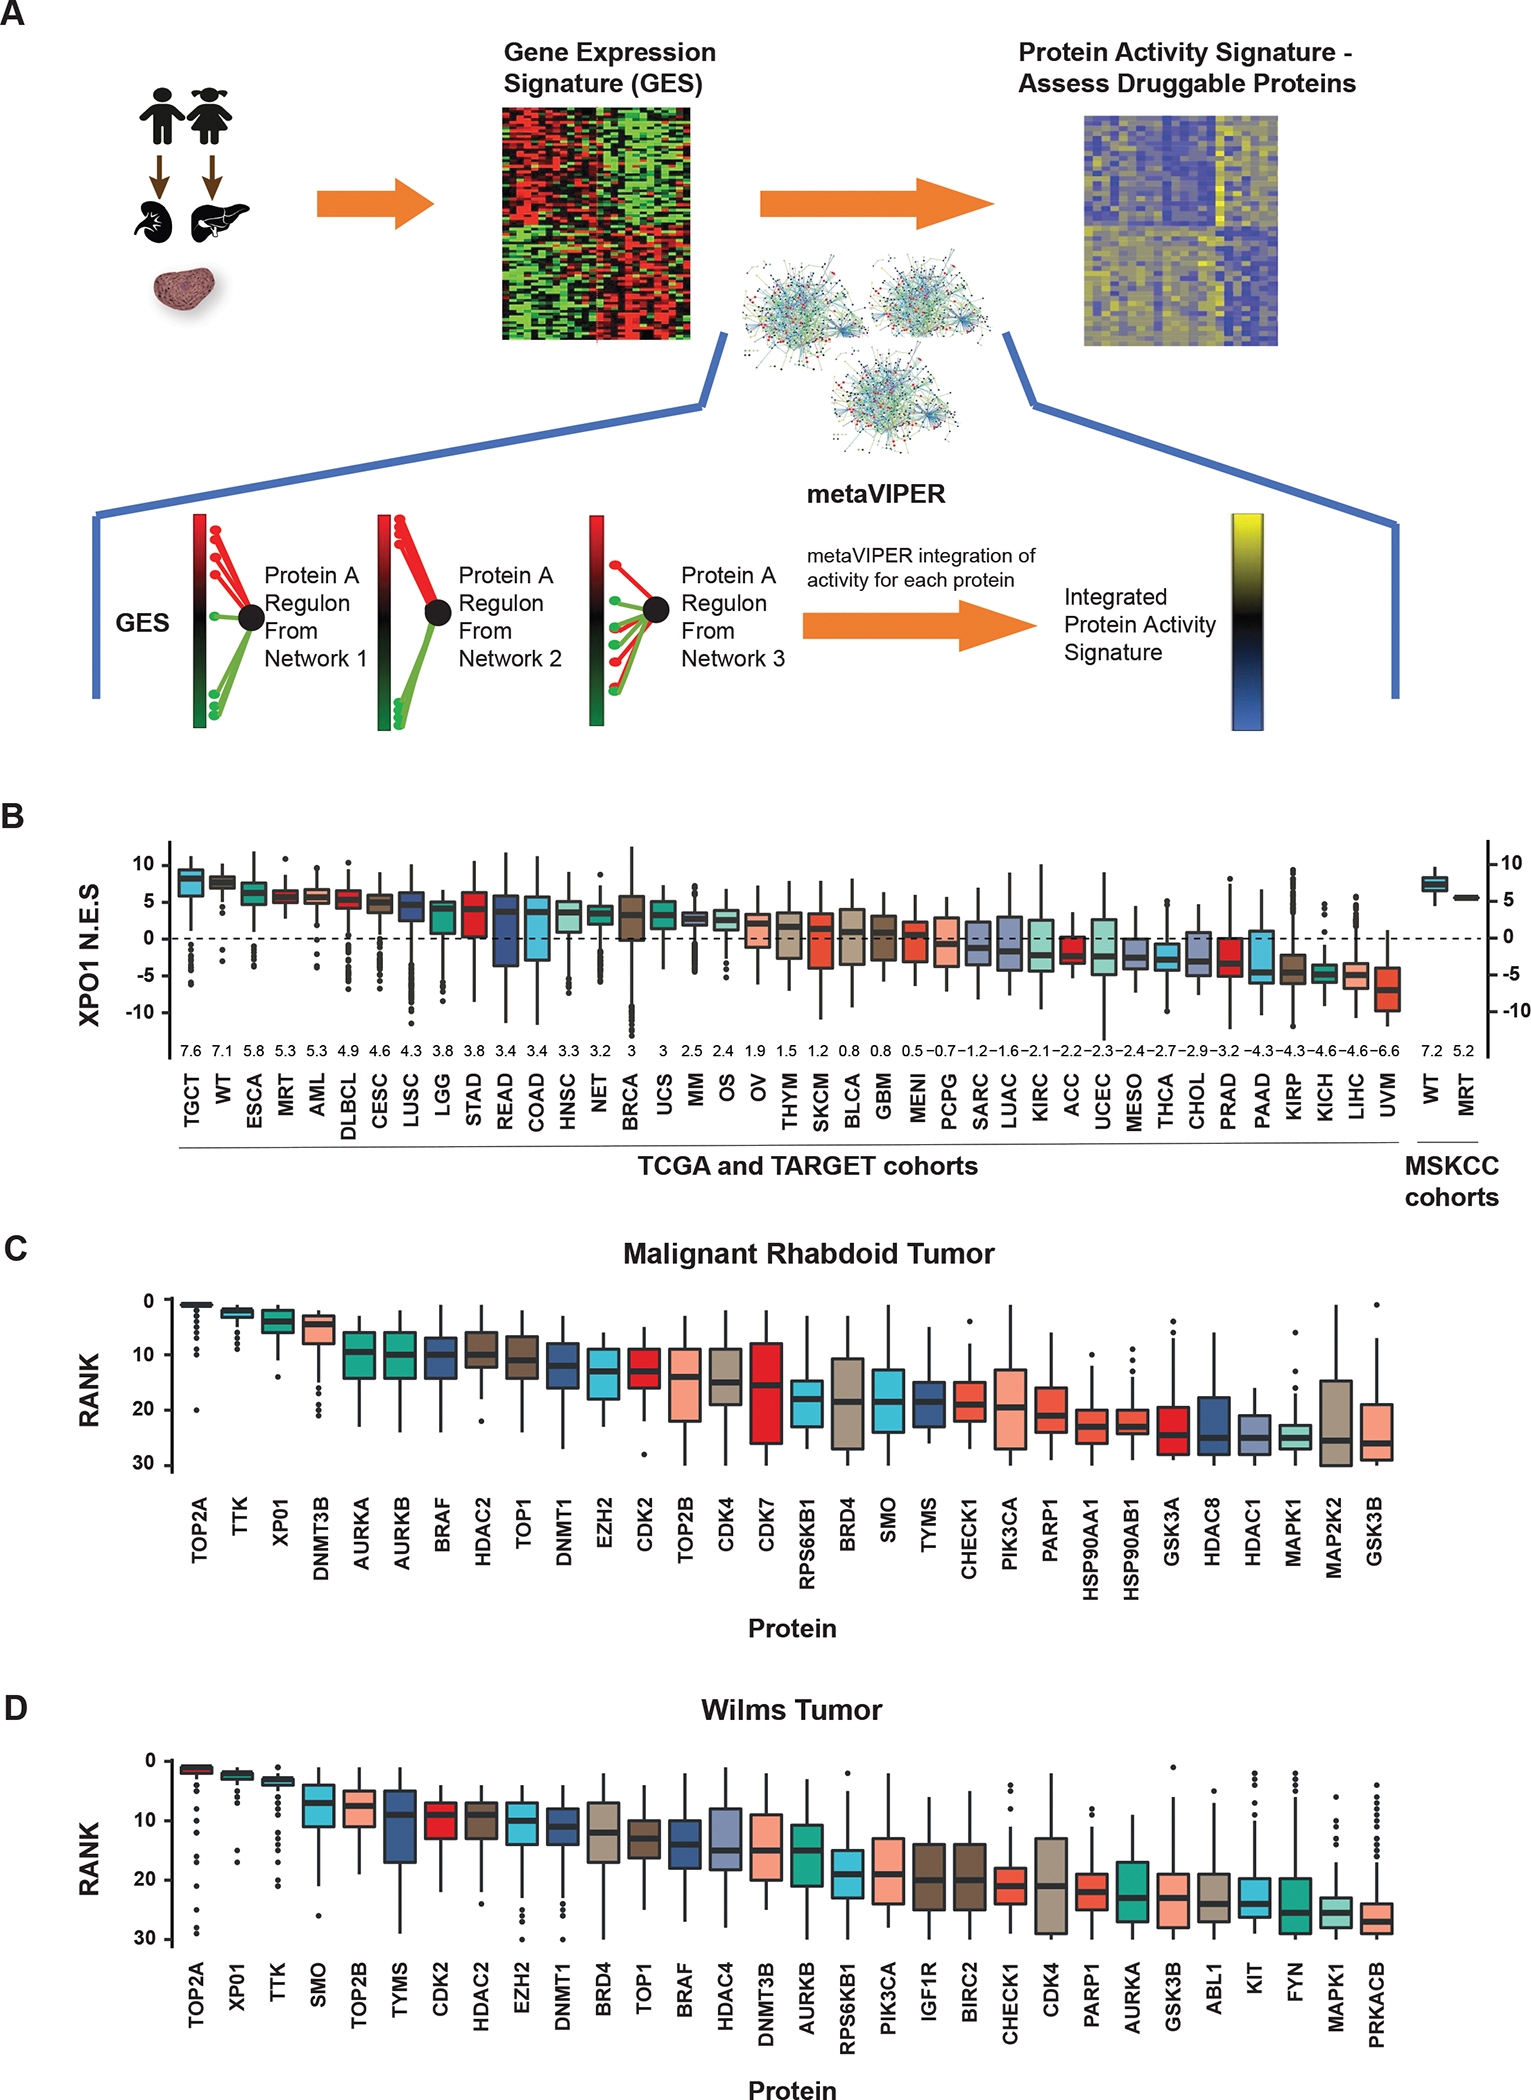
Methods: Comparative protein activity analysis of MRTs (n = 68) and WTs (n = 132) across TCGA and TARGET cohorts, using metaVIPER, revealed elevated exportin 1 (XPO1) inferred activity. In vitro studies were performed on a panel of MRT and WT cell lines to evaluate effects on proliferation and cell-cycle progression following treatment with the selective XPO1 inhibitor selinexor. In vivo anti-tumor activity was assessed in patient-derived xenograft (PDX) models of MRTs and WTs.

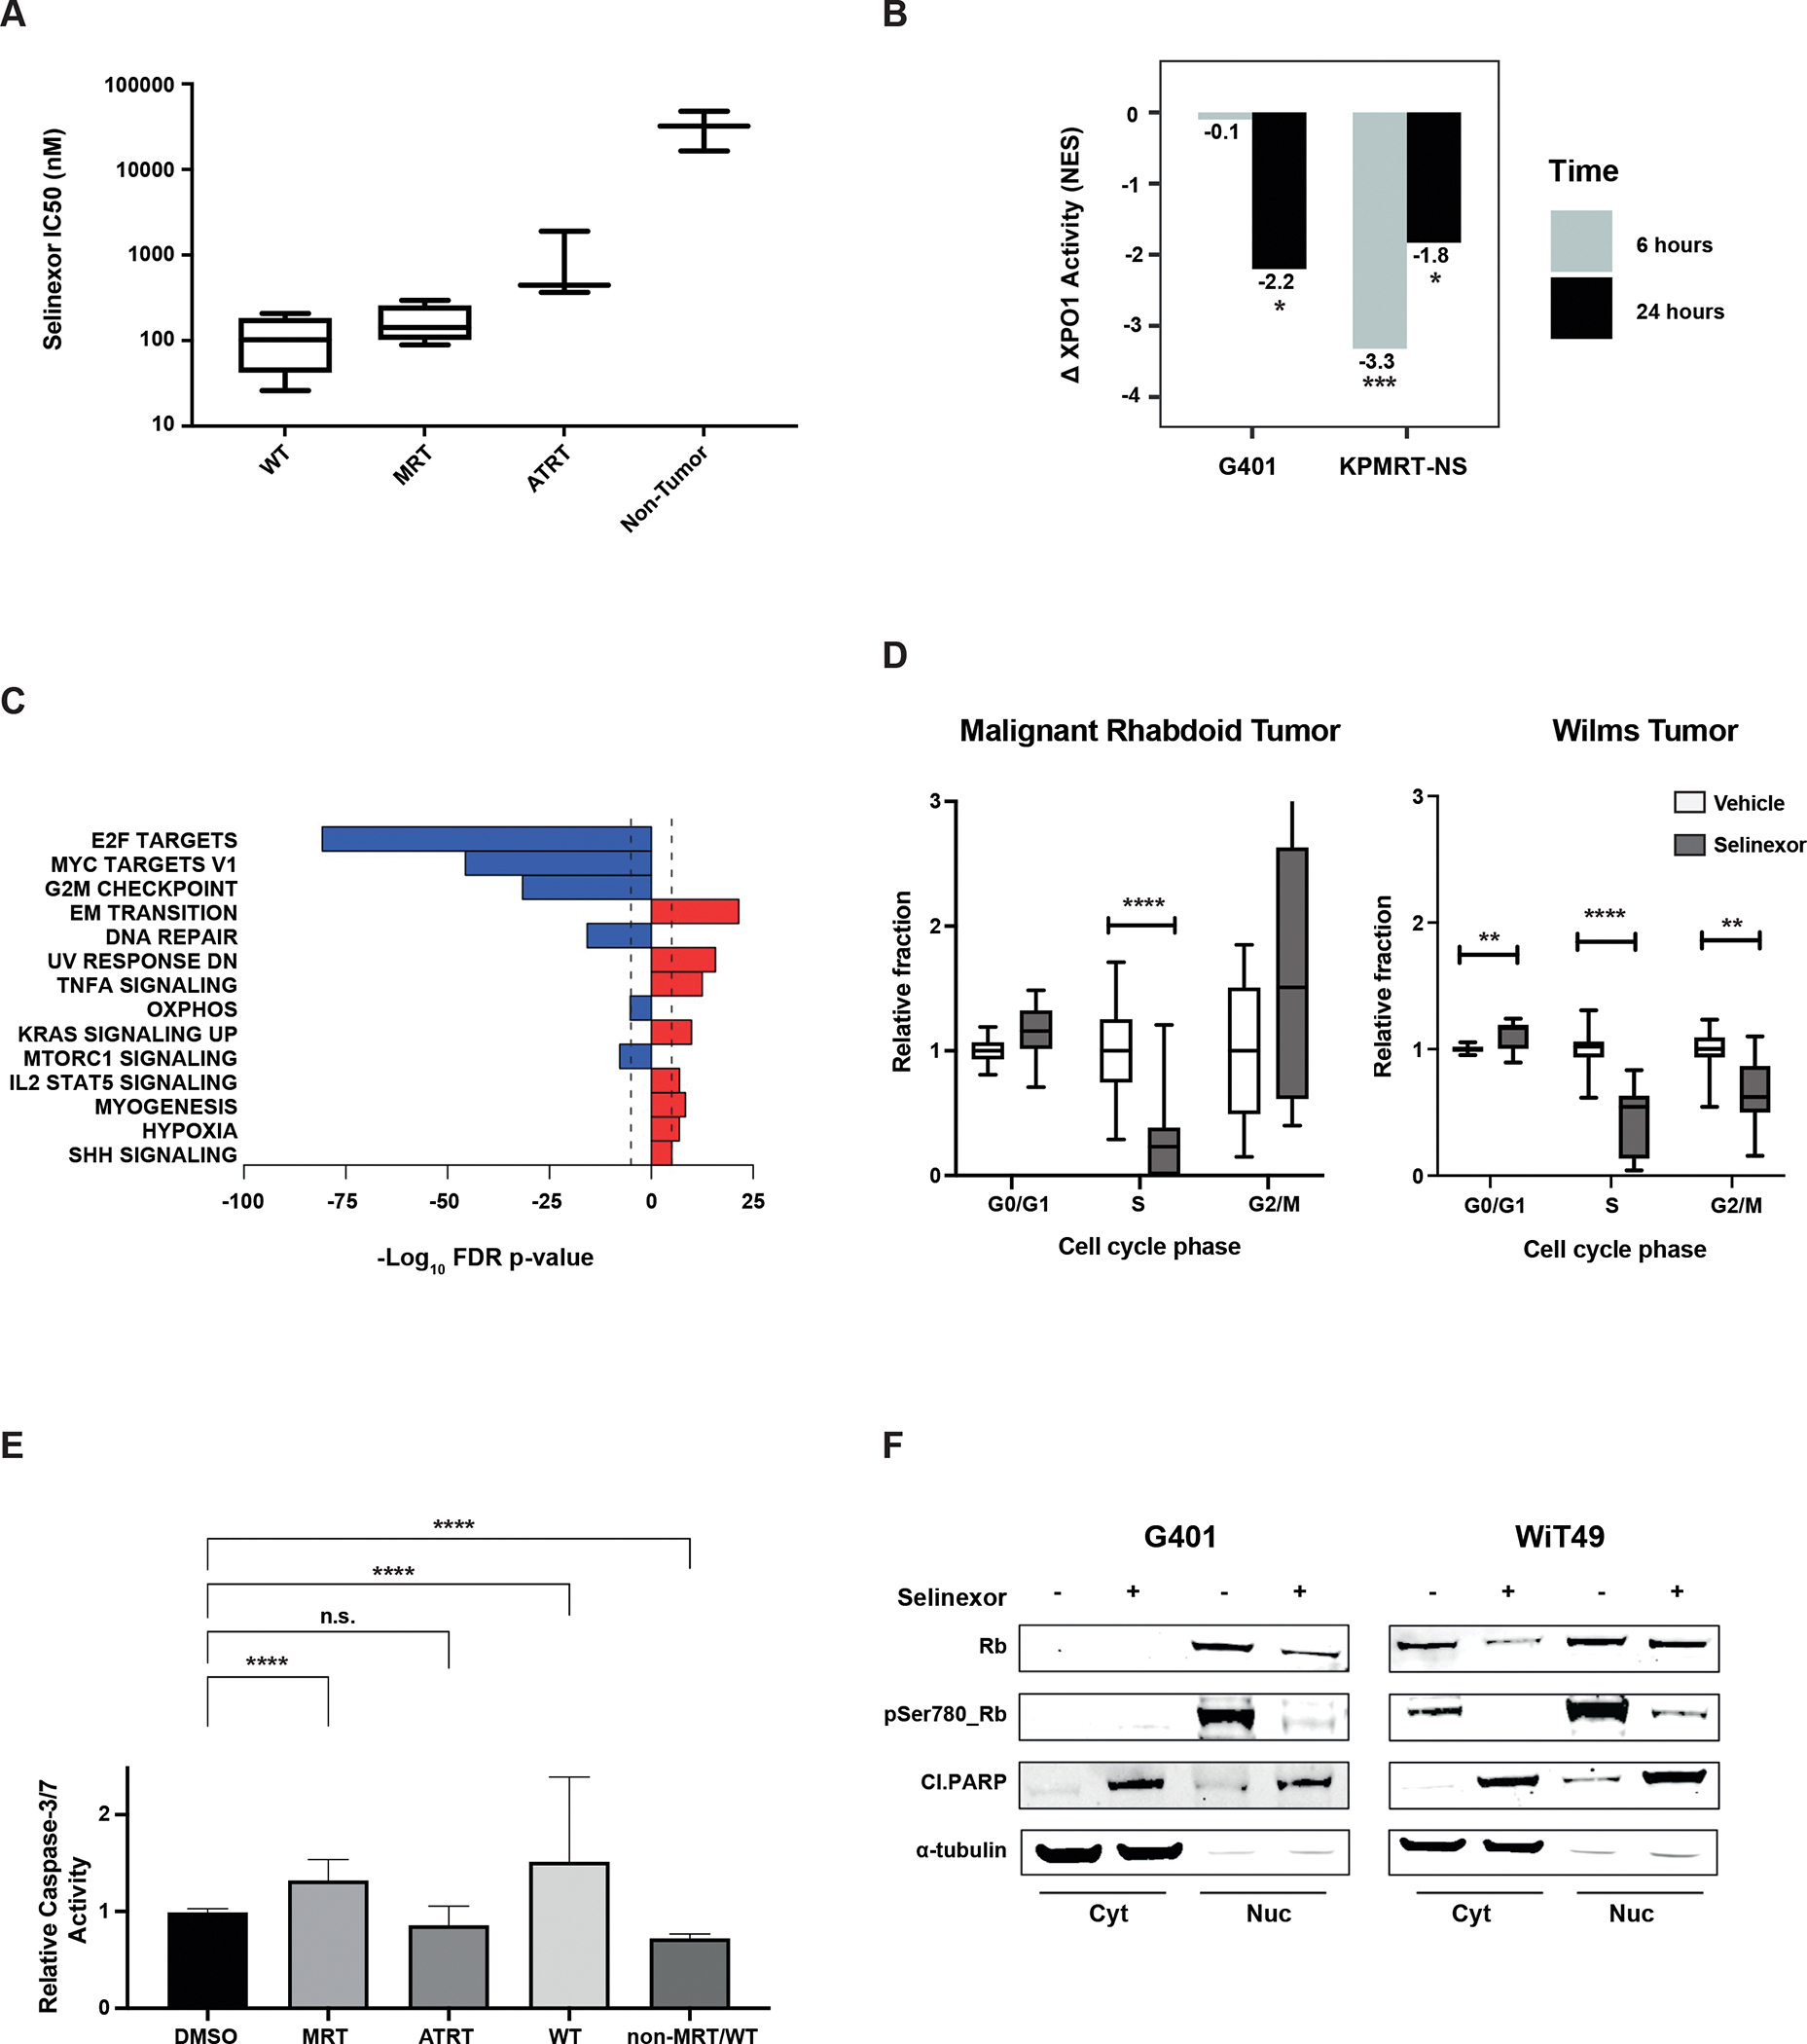
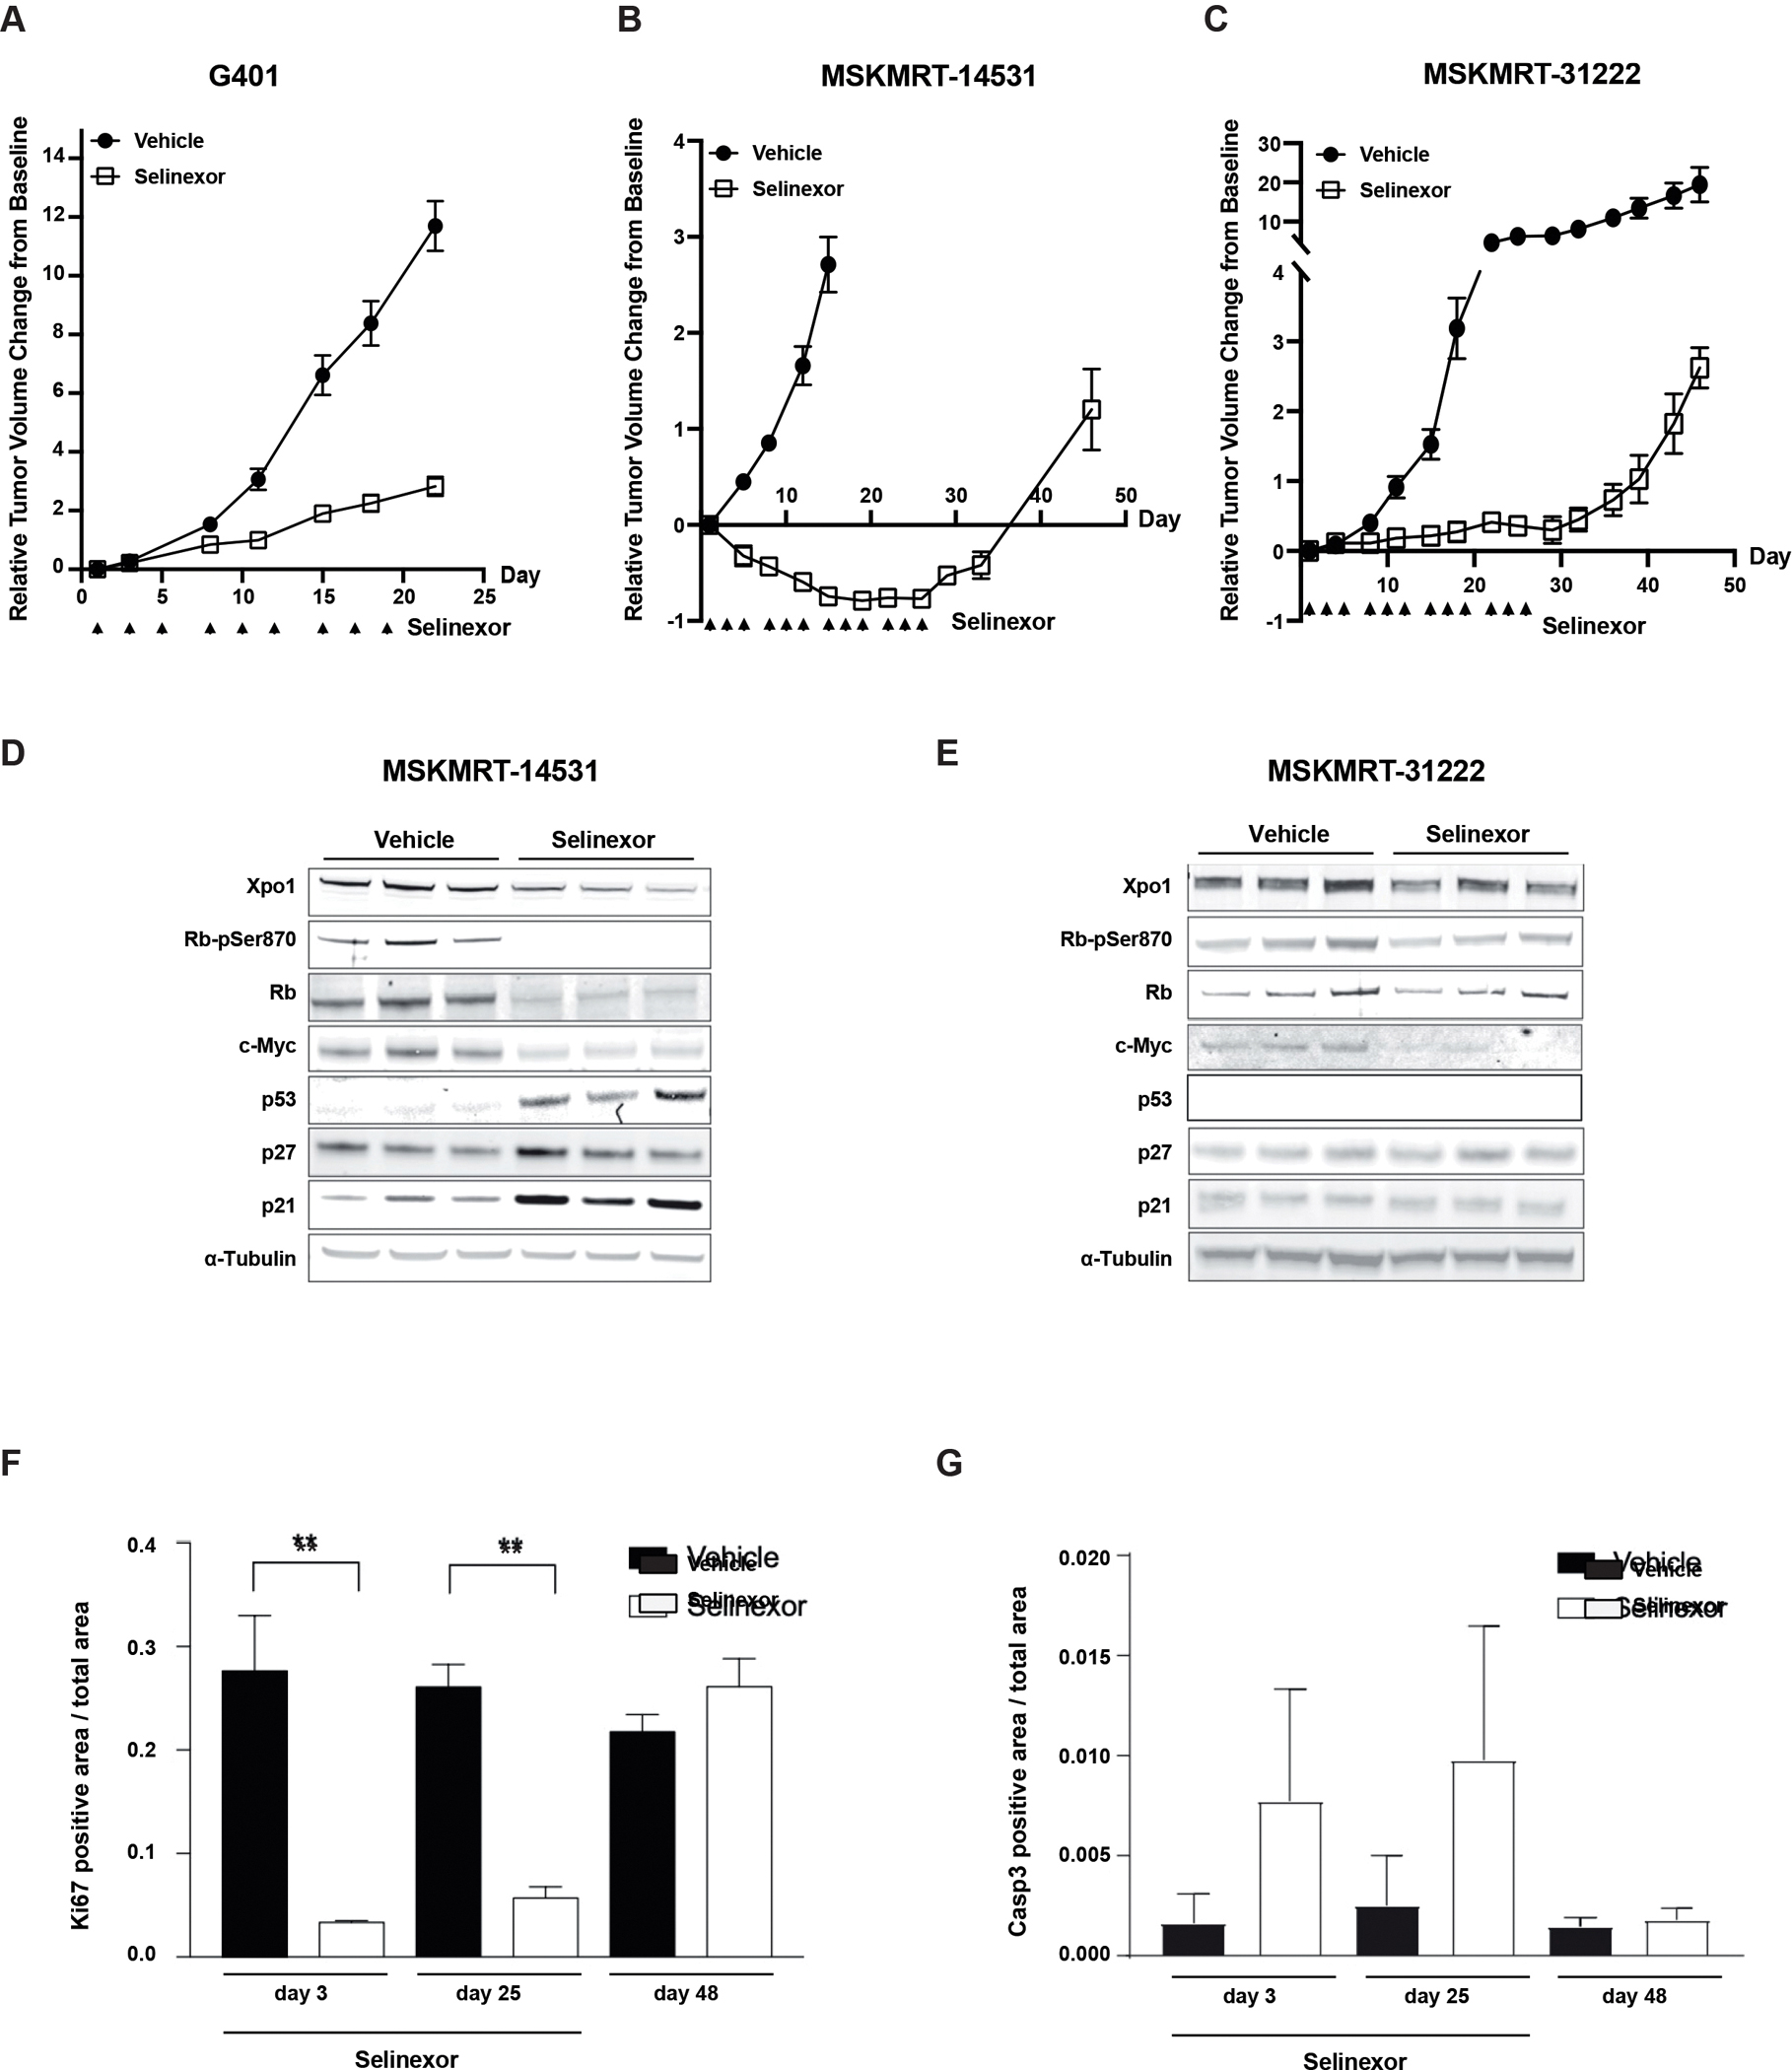
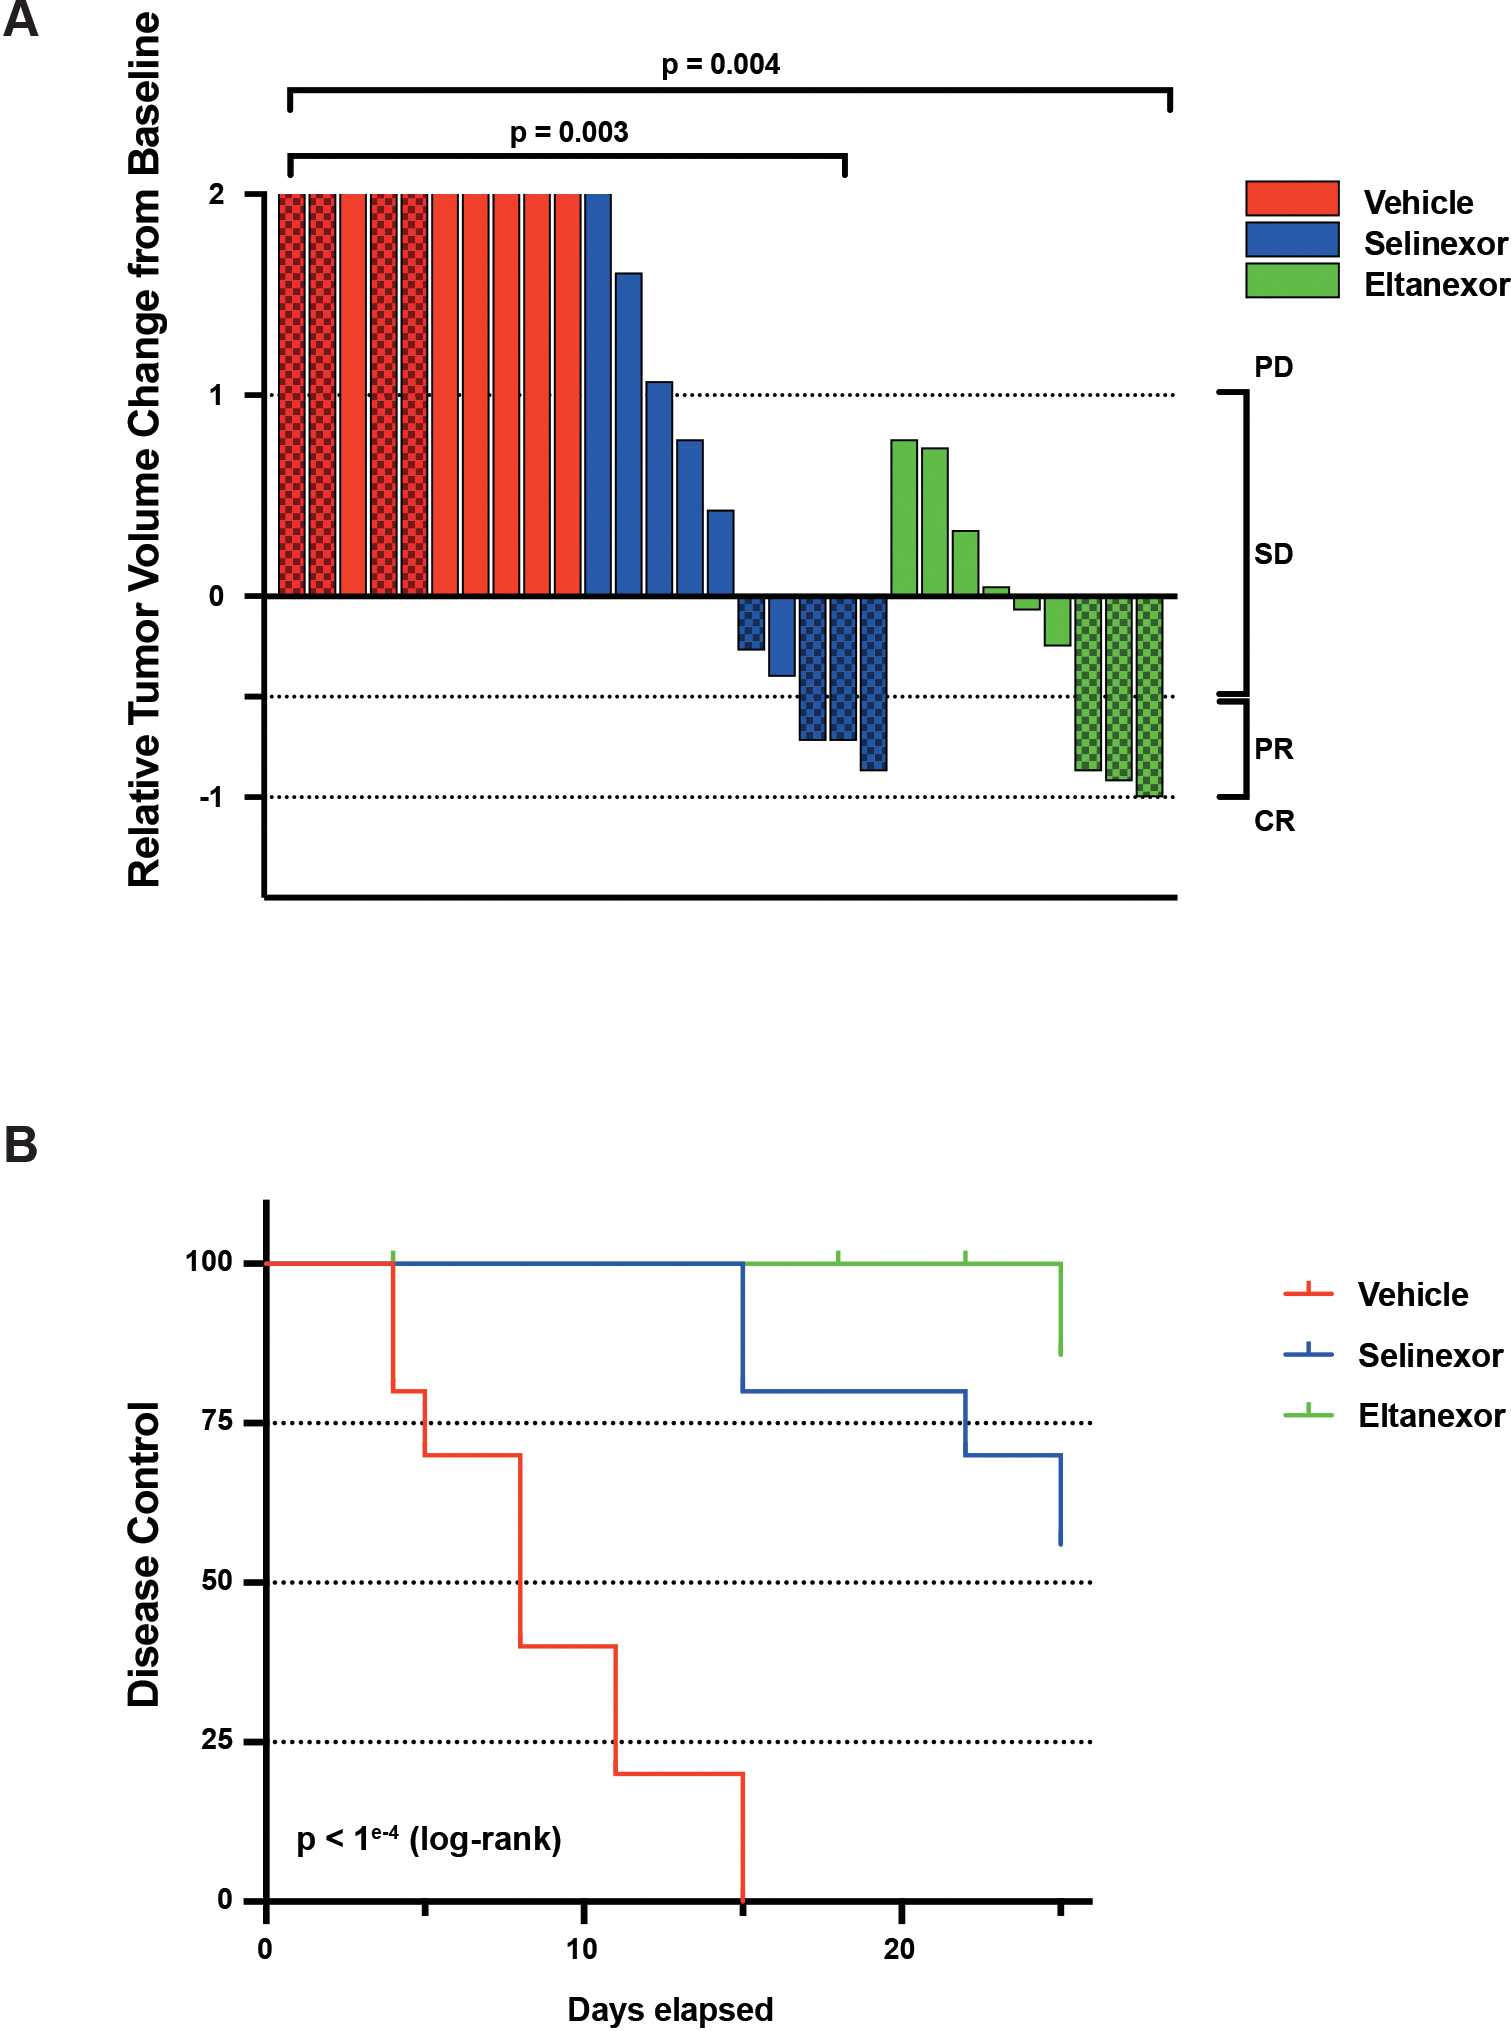
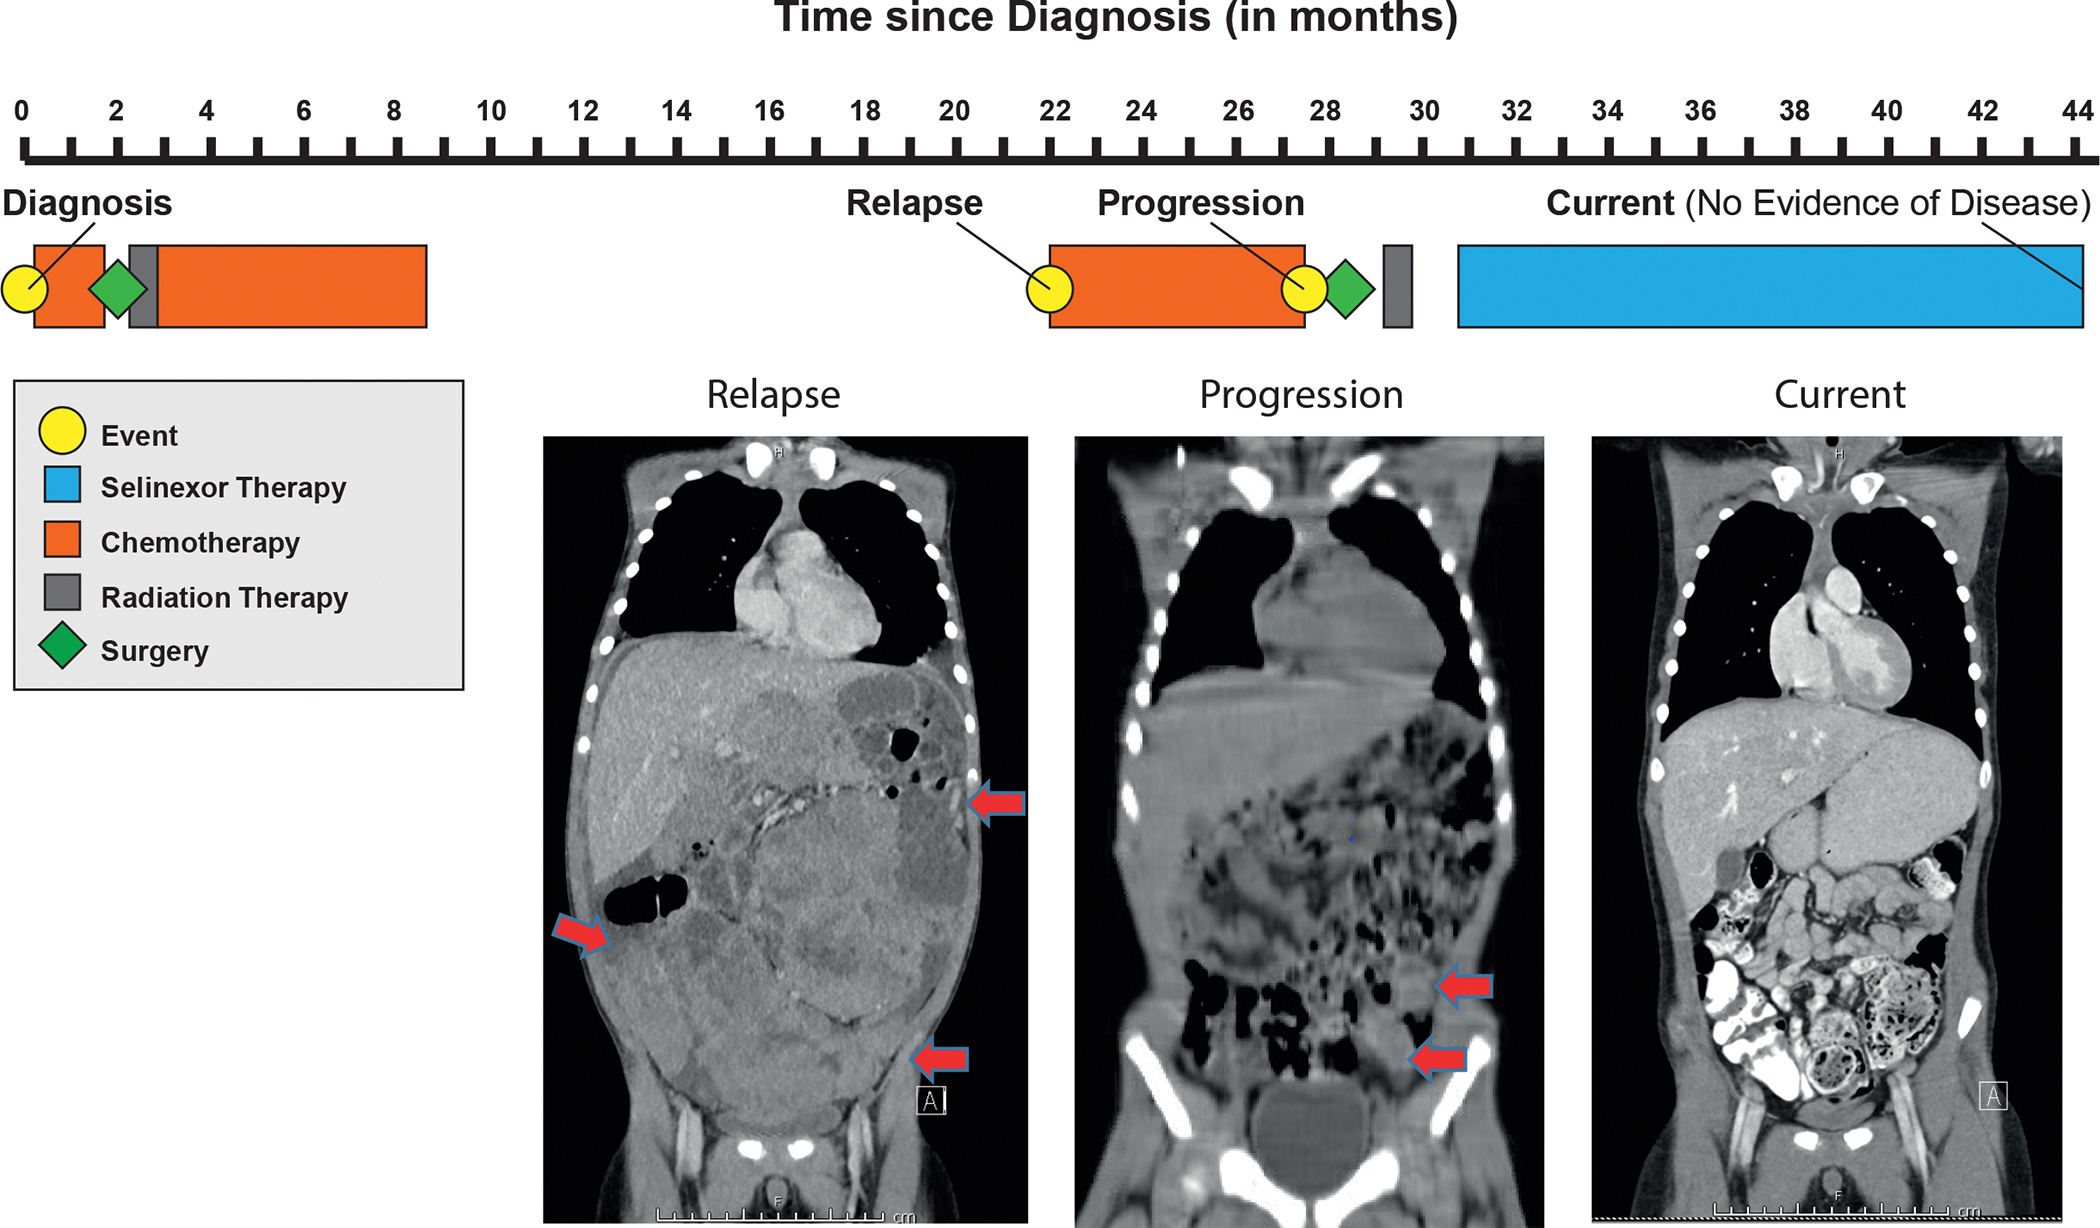
Findings: metaVIPER analysis identified markedly aberrant activation of XPO1 in MRTs and WTs compared with other tumor types. All MRT and most WT cell lines demonstrated baseline, aberrant XPO1 activity with in vitro sensitivity to selinexor via cell-cycle arrest and induction of apoptosis. In vivo, XPO1 inhibitors significantly abrogated tumor growth in PDX models, inducing effective disease control with sustained treatment. Corroborating human relevance, we present a case report of a child with multiply relapsed WTs with prolonged disease control on selinexor.

Conclusions: We report on a novel systems-biology-based comparative framework to identify non-genetically encoded vulnerabilities in genomically quiescent pediatric cancers. These results have provided preclinical rationale for investigation of XPO1 inhibitors in an upcoming investigator-initiated clinical trial of selinexor in children with MRTs and WTs and offer opportunities for exploration of inferred XPO1 activity as a potential predictive biomarker for response.

Funding: This work was funded by CureSearch for Children's Cancer, Alan B. Slifka Foundation, NIH (U01 CA217858, S10 OD012351, and S10 OD021764), Michael's Miracle Cure, Hyundai Hope on Wheels, Cannonball Kids Cancer, Conquer Cancer the ASCO Foundation, Cycle for Survival, Paulie Strong Foundation, and the Grayson Fund.

Keywords: PDX; Preclinical research; Wilms tumors; eltanexor; exportin 1; malignant rhabdoid tumors; patient-derived xenograft model; precision medicine; selinexor.


Conflict of interest statement

Declaration of interests A.C. is co-founder, equity holder, and consultant of DarwinHealth, Inc., which has licensed intellectual property (IP) related to the VIPER algorithms from Columbia University. Columbia University is an equity holder in DarwinHealth, Inc. A.L.K. is on the Scientific Advisory Board of Emendo Biotherapeutics, Karyopharm Therapeutics, Imago BioSciences, and DarwinHealth, is co-founder and on the board of directors of Isabl Technologies, and has equity interest in Imago BioSciences, Emendo Biotherapeutics, and Isabl Technologies.

Figures

Figure 1:
Figure 1:
MetaVIPER inference of XPO1 activity in rhabdoid tumors and Wilms tumor cell lines. A) MetaVIPER analysis schema. Biopsy specimens undergo histopathologic review and cores with ≥ 70% tumor cellularity are reserved for RNAseq. A differential gene expression signature (GES) is computed by comparing the relative expression of each gene with a pan-cancer reference. Gene regulatory networks, e.g. interactomes generated by ARACNe from TCGA cancer cohorts, independently interrogate the GES by enrichment analysis, generating an NES score for each protein representing its transcriptional regulatory activity. The final activity score for each protein is computed by Fisher’s integration of the NES values derived using each network independently. B) Boxplots representing the distribution of metaVIPER inferred XPO1 activity for 33 TCGA tumor cohorts, 3 TARGET pediatric tumor cohorts (MRT, WT, and osteosarcoma), one neuroendocrine tumor cohort, and two MSK cohorts (WT and MRT). The median and interquartile range for NES values is represented by each box for the respective tumor cohort. NES values from enrichment analysis are comparable to Z-scores, with higher scores representing increased activity. C) Boxplots representing metaVIPER prediction rank for each of the top 30 ‘druggable’ proteins for MRT in TARGET (n=68). D) Boxplot of inferred activity for each of the top 30 proteins predicted for Wilms tumor in TARGET (n=132). XPO1 is a significantly activated protein in both MRT and WT. Boxplots representing the top 30 ‘druggable’ proteins in WT demonstrate the distribution of the rank of the protein in the 132 samples. XPO1 ranks as the third most frequently activated druggable protein in MRT and the second most frequently activated druggable protein in WT. Abbreviations: TCGA, The Cancer Genome Atlas; TARGET, Therapeutically Applicable Research to Generate Effective Treatments; NES, normalized enrichment score; MRT, malignant rhabdoid tumors; WT, Wilms tumors.
Figure 2:
Figure 2:
Pharmacodynamic analysis of selinexor treatment in WT and MRT cell lines A) Comparison of sensitivity to selinexor in Wilms, MRT, ATRT, and non-tumor cell lines (BJ and RPE) following 72 hours of treatment. B) Change in XPO1 activity (NES), as computed by metaVIPER, in two rhabdoid cell lines at baseline and after treatment with selinexor (30 nM) for 6 and 24 hours versus baseline. Significant decreases are observed in G401 at 24 hours (p=0.013, estimated from enrichment analysis) and in KPMRT-NS at 6 hours (p=0.0004) and 24 hours (p=0.033). C) “Cancer hallmark” pathway enrichment analysis on the differential protein activity signature following treatment of MRT cell lines. D) Cell cycle analysis across MRT and WT cell lines treated with 100 nM (WT) or 400 nM (MRT) selinexor for 48 hours demonstrates G1/S phase arrest. E) Relative caspase activity induction following treatment of MRT, WT and non-MRT/WT cell lines following 48 hours of treatment with selinexor. (F) Decrease in phosphorylated Rb and induction of cleaved PARP following selinexor treatment coincide with cell cycle arrest and apoptosis in MRT and WT cell lines. *=p<0.05, **=p<0.01, ***=p<0.001, ****=p<0.0001.
Figure 3:
Figure 3:
In vivo activity of selinexor in MRT xenografts. A) Tumor response in G401 xenograft (n= 8 per arm) treated with vehicle or selinexor for 21 days. Error bars: standard error of mean (SEM). B) and C) Tumor responses in MRT patient-derived xenograft (PDX) models (n=8/arm) treated with selinexor for 28 days. Error bars: SEM. D-E) Pharmacodynamic assessment of XPO1 and proliferative markers in MRT PDX models treated with selinexor. F) Immunohistochemical analysis of proliferation (Ki67) and G) apoptosis induction (caspase 3) in an MRT PDX model treated with selinexor (through Day 25) and following withdrawal of treatment.
Figure 4:
Figure 4:
Wilms tumor PDX models show in vivo sensitivity to selinexor and eltanexor. A) Waterfall plot summarizing anti-tumor activity across a panel of Wilms tumor PDX models. Solid color bars denote models with favorable histology and textured bars denote anaplastic histology. Significant differences observed in either selinexor (p=0.003, Mann-Whitney) or eltanexor treated animals (p=0.004) compared to vehicle treatment, but no difference between selinexor or eltanexor treatment (p=0.31). B) Treatment with either selinexor or eltanexor results in significant disease control across a panel of WT PDX models (p<1e−4, log-rank). No significant differences were observed between selinexor- or eltanexor-treated cohorts (p=0.13). PD – progressive disease; SD – stable disease; PR – partial response; CR – complete response.
Figure 5:
Figure 5:
Treatment timeline of a pediatric patient with relapsed Wilms tumor treated with selinexor. Red arrows indicate peritoneal implants on MRI performed at relapse and CT performed at time of disease progression. At present, patient has no evidence of disease on selinexor monotherapy.

Comment in

References

    1. Lawrence MS, Stojanov P, Polak P, et al.: Mutational heterogeneity in cancer and the search for new cancer-associated genes. Nature 499:214–218, 2013 - PMC - PubMed
    1. Grobner SN, Worst BC, Weischenfeldt J, et al.: The landscape of genomic alterations across childhood cancers. Nature 555:321–327, 2018 - PubMed
    1. Vogelstein B, Papadopoulos N, Velculescu VE, et al.: Cancer genome landscapes. Science 339:1546–58, 2013 - PMC - PubMed
    1. Shern JF, Chen L, Chmielecki J, et al.: Comprehensive genomic analysis of rhabdomyosarcoma reveals a landscape of alterations affecting a common genetic axis in fusion-positive and fusion-negative tumors. Cancer Discov 4:216–31, 2014 - PMC - PubMed
    1. Gadd S, Huff V, Walz AL, et al.: A Children’s Oncology Group and TARGET initiative exploring the genetic landscape of Wilms tumor. Nat Genet 49:1487–1494, 2017 - PMC - PubMed

Publication types