. 2022 Oct 18;3(10):100762.
doi: 10.1016/j.xcrm.2022.100762. Epub 2022 Oct 3.

Dysregulation of secondary bile acid metabolism precedes islet autoimmunity and type 1 diabetes

Affiliations

Dysregulation of secondary bile acid metabolism precedes islet autoimmunity and type 1 diabetes

Santosh Lamichhane et al. Cell Rep Med. .

Abstract

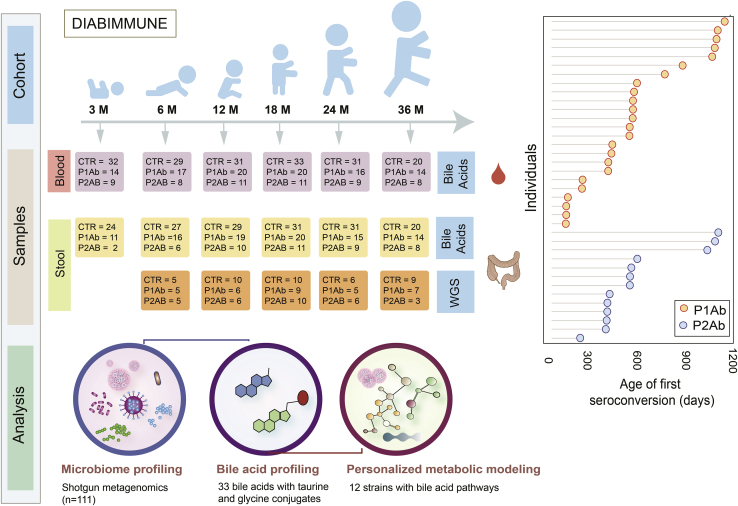
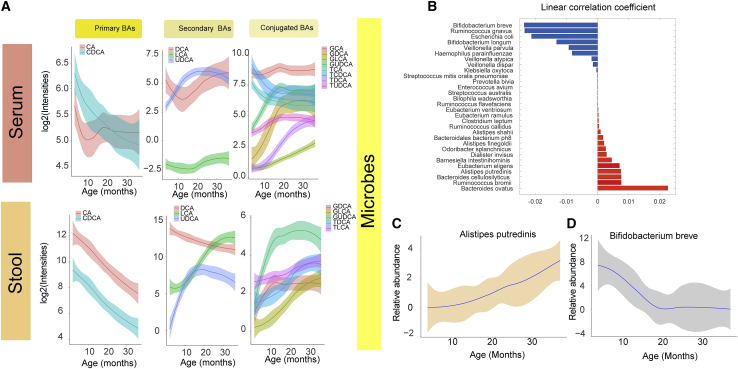
The gut microbiota is crucial in the regulation of bile acid (BA) metabolism. However, not much is known about the regulation of BAs during progression to type 1 diabetes (T1D). Here, we analyzed serum and stool BAs in longitudinal samples collected at 3, 6, 12, 18, 24, and 36 months of age from children who developed a single islet autoantibody (AAb) (P1Ab; n = 23) or multiple islet AAbs (P2Ab; n = 13) and controls (CTRs; n = 38) who remained AAb negative. We also analyzed the stool microbiome in a subgroup of these children. Factor analysis showed that age had the strongest impact on both BA and microbiome profiles. We found that at an early age, systemic BAs and microbial secondary BA pathways were altered in the P2Ab group compared with the P1Ab and CTR groups. Our findings thus suggest that dysregulated BA metabolism in early life may contribute to the risk and pathogenesis of T1D.

Keywords: bile acid; genome-scale metabolic modeling; gut microbiome; islet autoimmunity; lipid metabolism; lipidomics; metabolomics; microbial metabolism; type 1 diabetes.


Conflict of interest statement

Declaration of interests The authors declare no competing interests.

Figures

None
Graphical abstract
Figure 1
Figure 1
Outlines of analytical study flow This illustrates the number of serum and stool samples collected for targeted BA measurement and matched stool samples for metagenomics analysis (whole-genome sequencing [WGS]) at each time point. Here, we analyzed BAs in a longitudinal series of serum and stool samples collected at 3, 6, 12, 18, 24, and 36 months of age from children who developed a single islet autoantibody (P1Ab; n = 23) or multiple islet autoantibodies (P2Ab; n = 13) and controls (CTRs; n = 38) who remained autoantibody (AAb) negative during follow-up. The samples were stratified into P1Ab, P2Ab, and CTR groups. Moreover, the figure shows the age of seroconversion among the children taking part in this study.
Figure 2
Figure 2
Age-related changes in bile acids and microbiome (A) The loess curve plot of BAs over time (3, 6, 12, 18, and 24) between stool and serum samples. This panel plots, separately, representative primary, secondary, and conjugated BAs that changed significantly over time (p < 0.05). (B) Bar plots showing correlation coefficients for the association between age and different microbes. Red represents inverse correlations, while blue represents positive correlations as obtained by multivariate linear regression using the R package MaAsLin2. (C and D) The loess curve plot of selected microbes over time. Here, in a longitudinal study setting, we analyzed BAs in subject-matched stool (n = 304) and serum (n = 333) samples from three study groups: P1Ab (n = 23), P2Ab (n = 13), and CTR (n = 38). Whole-genome shotgun sequencing was available from a subset of children (n = 111 stool samples in total).
Figure 3
Figure 3
Microbial strains in progression to islet autoimmunity (A) A heatmap showing the log2 fold changes (FCs) in the strain-level abundances of the gut microbes in P1Ab versus CTR, P2Ab versus CTR, and P2Ab versus P1Ab groups at 6, 12, 18, 24, and 36 months of the follow-up (n = 111). Red, blue, and yellow denote increase, decrease, and no change in the abundances between the differential conditions, respectively. Statistical significance was assessed using ANCOVA adjusted for “diet variables” as covariates and p value adjusted for FDR < 0.05. Microbes with BA pathways (annotated by the AGORA compendium) are marked with light blue color. (B) An illustration of BA metabolism and related pathways in humans. Whole-genome shotgun sequencing was available from a subset of children (n = 111 stool samples in total). Question marks indicate “unknown enzymes.” Single- and double-headed arrows represent irreversible and reversible reactions, respectively.
Figure 4
Figure 4
Regulation of bile acid reactions in progression to islet autoimmunity (A–C) Bean plots showing the levels of total BA reaction abundances and the total fecal secretion potentials (FSPs) predicted by the community microbiota models in the CTR, P1Ab, and P2Ab groups at 6, 12, 18, 24, and 36 months of follow-up. The black dotted line denotes the mean of the population. The black dashes in the bean plots represent the group mean. Asterisk denotes significant differences (ANOVA with Tukey’s HSD, adjusted p < 0.05). (B) Locally weighted scatterplot smoothing (LOWESS) plot showing the longitudinal trend of an individual BA reaction abundance in the CTR (light blue), P1Ab (yellow), and P2Ab (orange) groups during follow-up. The shaded area around the curves depicts the 95% confidence interval. Whole-genome shotgun sequencing was available from a subset of children (n = 111 stool samples in total).
Figure 5
Figure 5
Systemic alterations in bile acid profiles in progression to islet autoimmunity Heatmap showing the log2 fold changes (FCs) in BA profiles in P1Ab versus CTR, P2Ab versus CTR, and P2Ab versus P1Ab groups at 6, 12, 18, 24, and 36 months of follow-up. Red, blue, and yellow denote increase, decrease, and no change in the intensities of BAs between the differential conditions, respectively. Statistical significance was estimated using ANCOVA adjusted for “diet variables” as covariates, p adjusted for FDR < 0.05.
Figure 6
Figure 6
Cross-correlation between the gut microbiome and systemic (stool) levels of BA in progression to islet autoimmunity Correlation plots showing bivariate Spearman’s correlations between the gut microbiome (metagenomics) and level of BAs (lipidomics) in the stool samples of the P2Ab (n = 111) group at (A) 12 and (B) 18 months. Red, blue, and white/yellow represent positive, negative, and no correlation, respectively. The white “dot” indicates that the correlation is statistically significant (p adjusted for FDR < 0.05). Here, in a longitudinal study setting, we analyzed BAs in subject-matched stool (n = 304) and serum (n = 333) samples from three study groups: P1Ab (n = 23), P2Ab (n = 13), and CTR (n = 38). Whole-genome shotgun sequencing was available from a subset of children (n = 111 stool samples in total).

References

    1. de Aguiar Vallim T.Q., Tarling E.J., Edwards P.A. Pleiotropic roles of bile acids in metabolism. Cell Metab. 2013;17:657–669. doi: 10.1016/j.cmet.2013.03.013. - DOI - PMC - PubMed
    1. Alberto González-Regueiro J., Moreno-Castañeda L., Uribe M., Carlos Chávez-Tapia N. The role of the gut microbiota in bile acid metabolism. Ann. Hepatol. 2017;16:s15–s20. doi: 10.5604/01.3001.0010.5494. - DOI - PubMed
    1. Makishima M., Okamoto A.Y., Repa J.J., Tu H., Learned R.M., Luk A., Hull M.V., Lustig K.D., Mangelsdorf D.J., Shan B. Identification of a nuclear receptor for bile acids. Science. 1999;284:1362–1365. doi: 10.1126/science.284.5418.1362. - DOI - PubMed
    1. Wang H., Chen J., Hollister K., Sowers L.C., Forman B.M. Endogenous bile acids are ligands for the nuclear receptor FXR/BAR. Mol. Cell. 1999;3:543–553. doi: 10.1016/s1097-2765(00)80348-2. - DOI - PubMed
    1. Chiang J.Y.L. Bile acid metabolism and signaling. Compr. Physiol. 2013;3:1191–1212. doi: 10.1002/cphy.c120023. - DOI - PMC - PubMed

Publication types