Comparative Study
. 2022 Oct:118:102291.
doi: 10.1016/j.hal.2022.102291. Epub 2022 Jul 21.

A suggested climate service for cyanobacteria blooms in the Baltic Sea - Comparing three monitoring methods

Affiliations
Comparative Study

A suggested climate service for cyanobacteria blooms in the Baltic Sea - Comparing three monitoring methods

Bengt Karlson et al. Harmful Algae. 2022 Oct.

Abstract

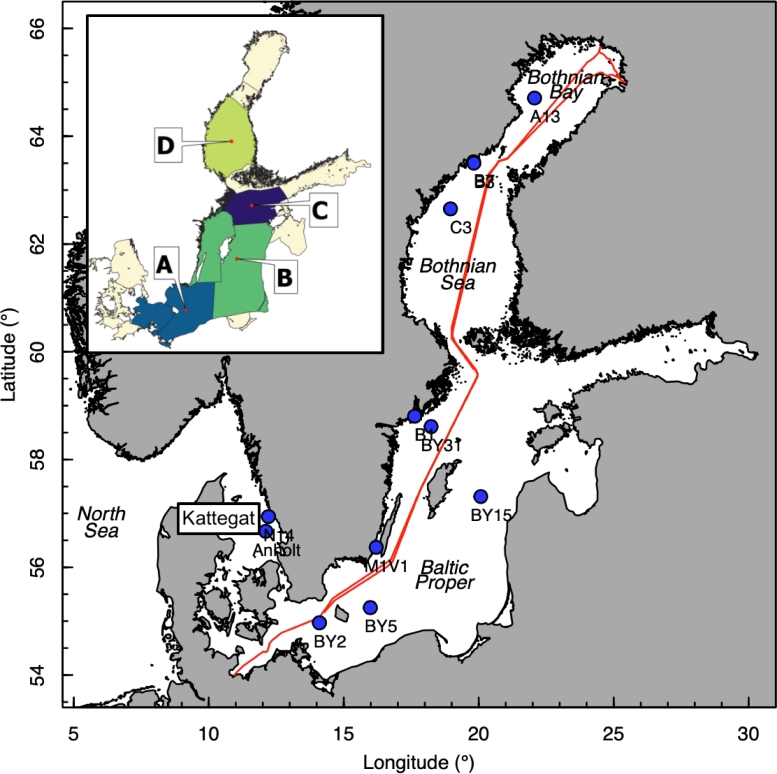
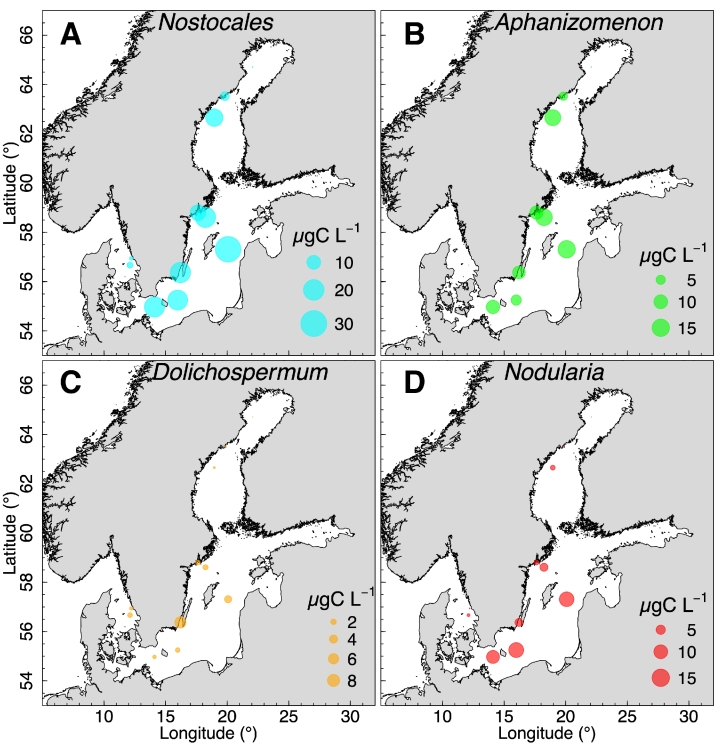
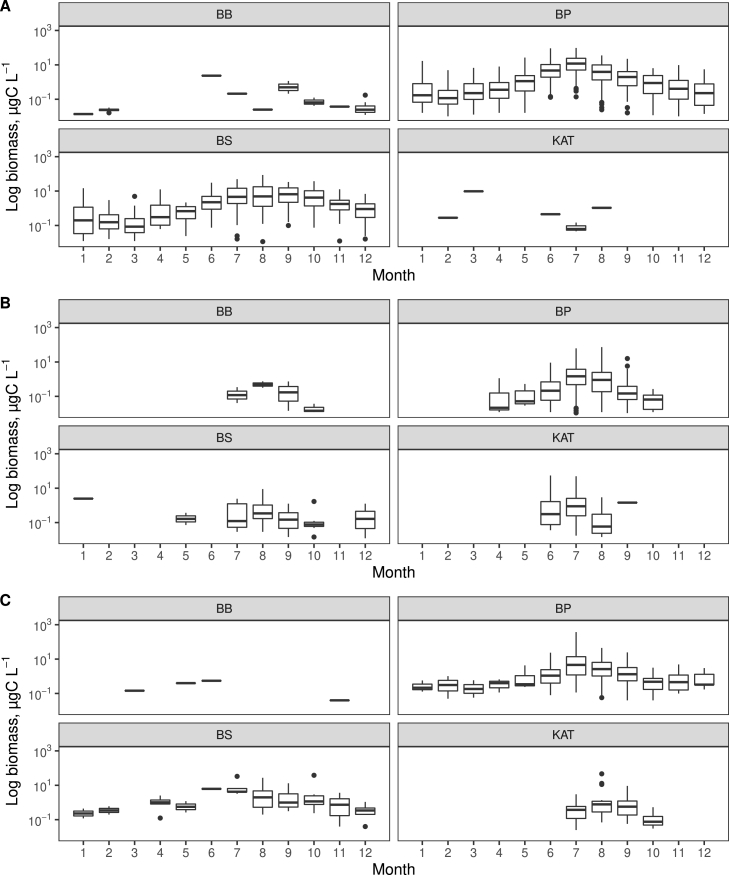
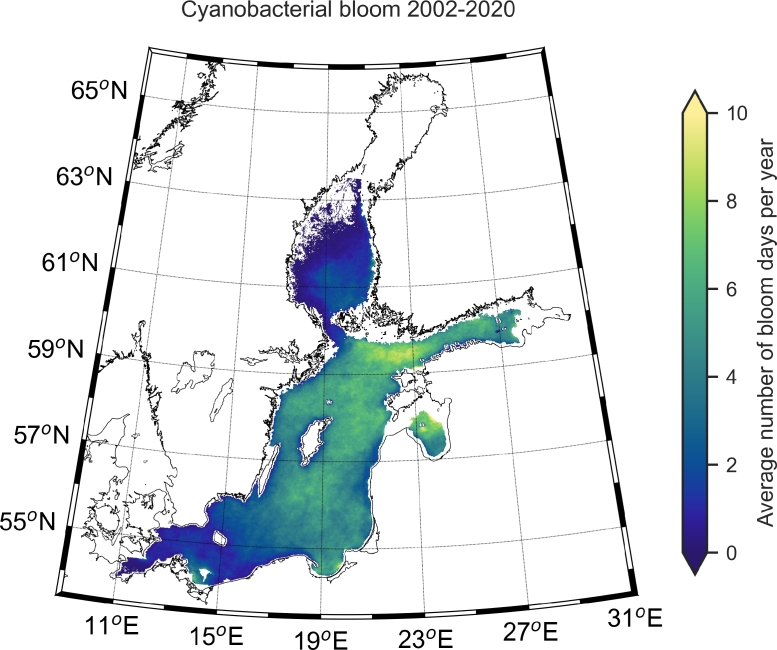
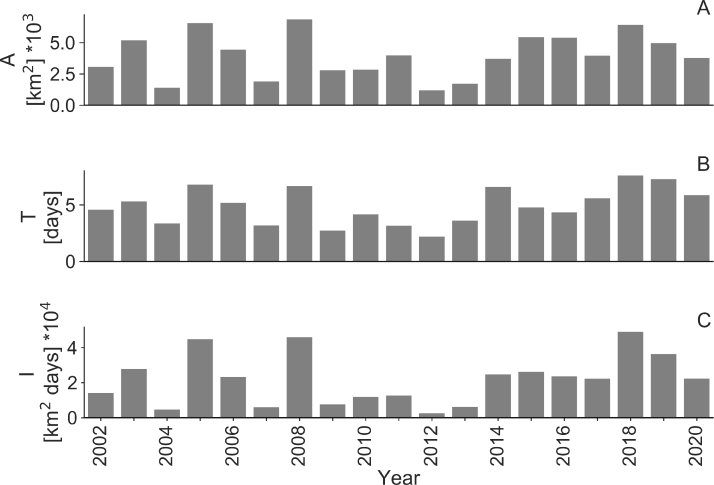
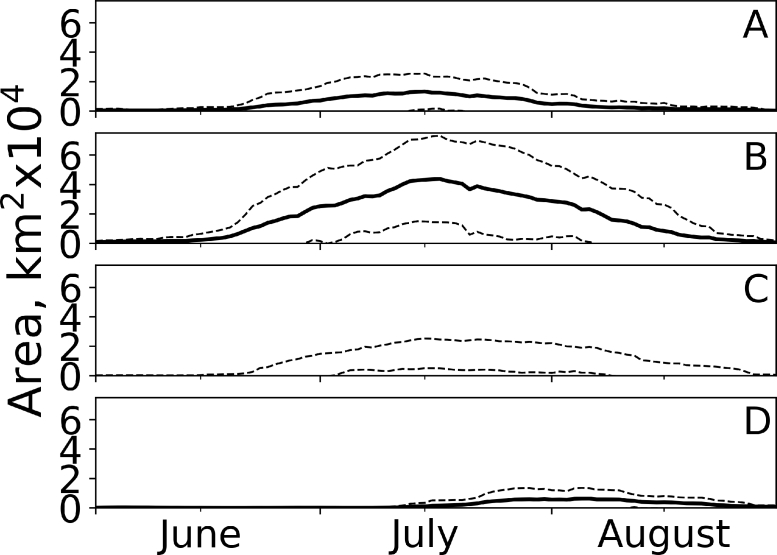
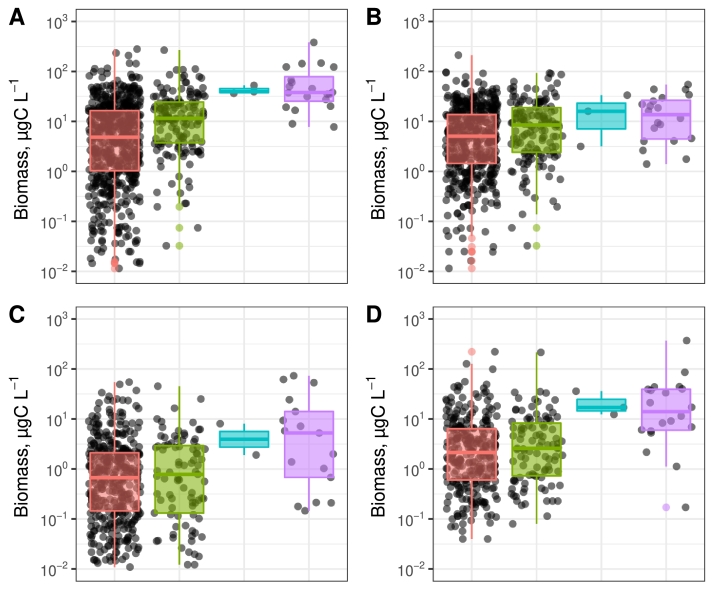
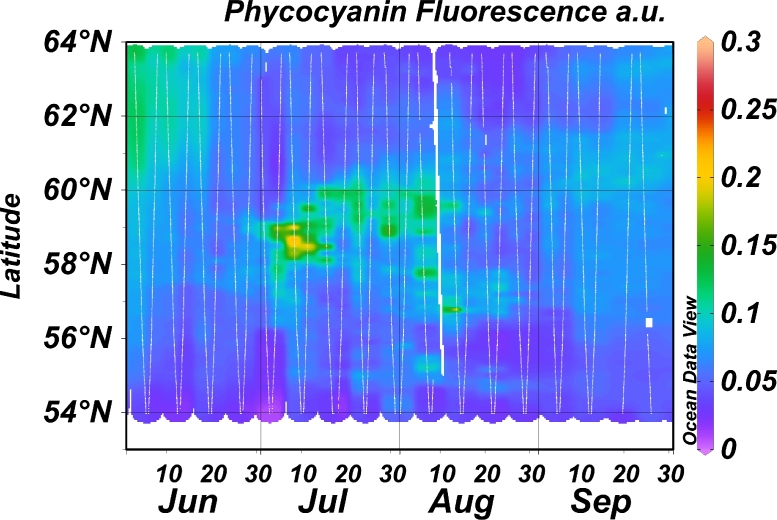
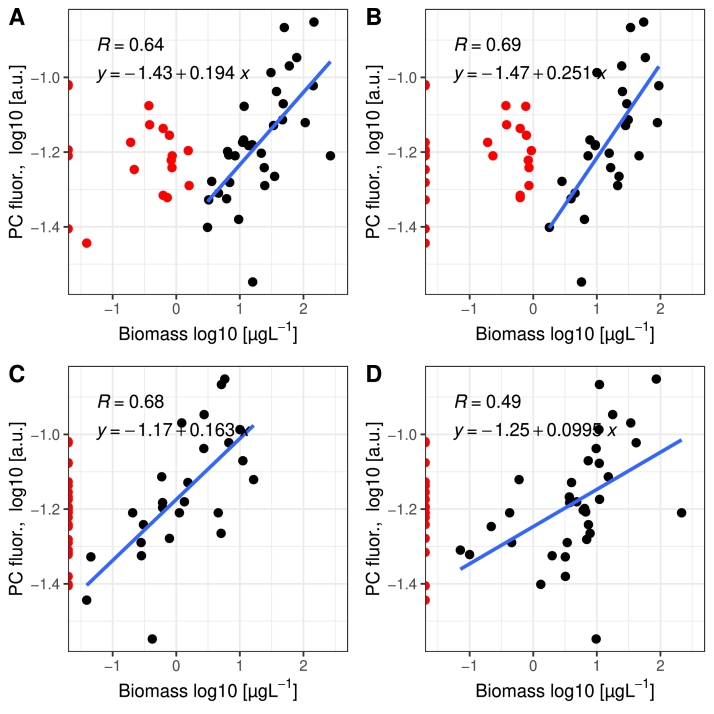
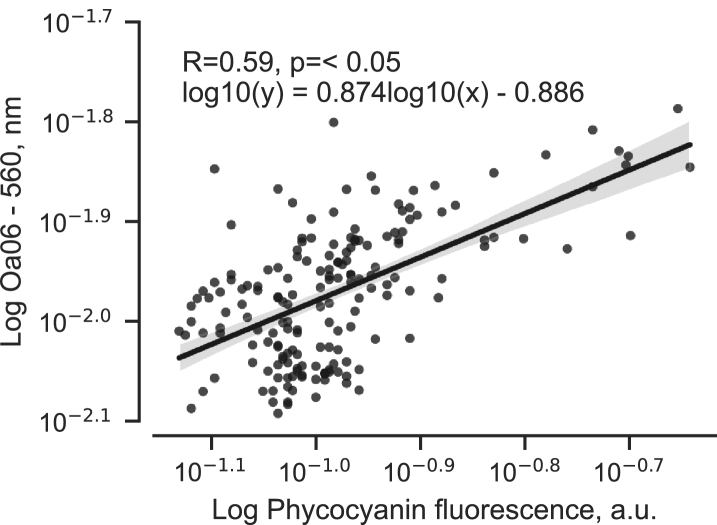
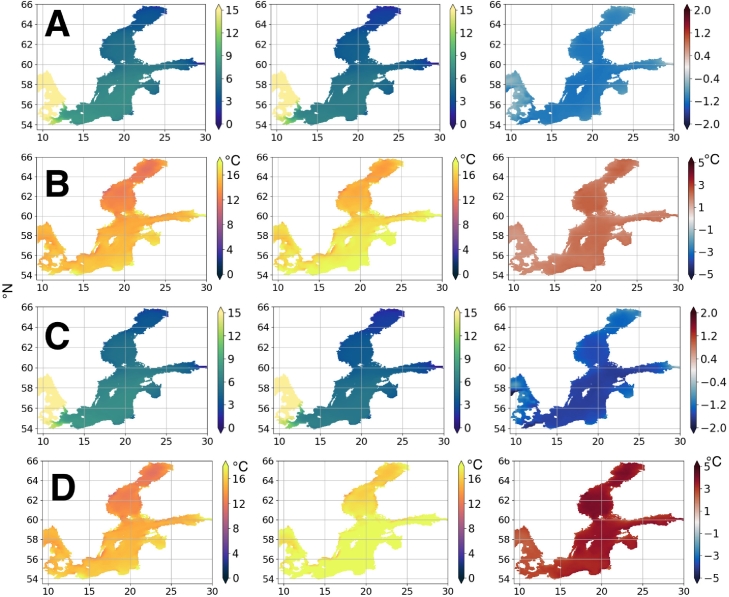
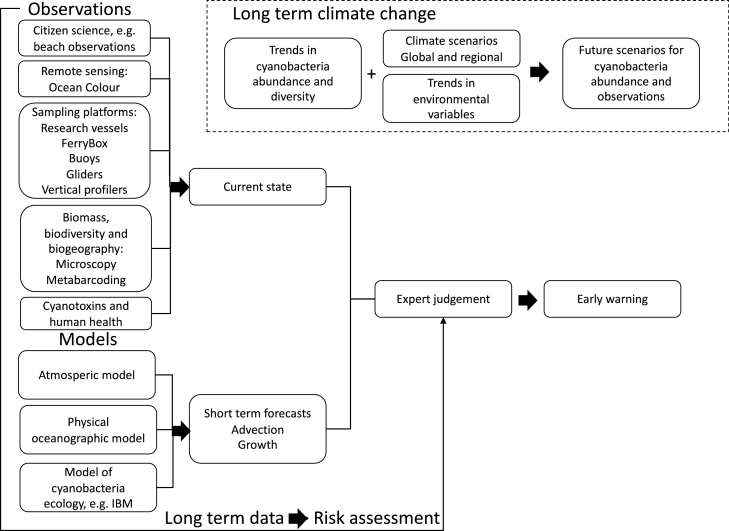
Dense blooms of filamentous cyanobacteria are recurrent phenomena in the Baltic Sea, with occasional negative effects on the surrounding ecosystem, as well as on tourism, human health, aquaculture, and fisheries. Establishing a climate service is therefore suggested; including multi-method observations of cyanobacteria biomass, biodiversity, and biogeography, in correspondence to biotic and abiotic factors. Three different approaches were compared for determination of spatial and temporal variability and trends of the blooms; 1) microscopy-based long-term data, 2) satellite remote sensing, and 3) phycocyanin fluorescence mounted on a merchant vessel. Firstly, microscopy-based data on cyanobacteria biomass from the period 2000-2020 showed that the toxin producing genus Nodularia and non-toxic Aphanizomenon both had summer means of 15 µg C L-1, while Dolichospermum was less dominant with a mean of 8 µg C L-1. Some years also the Kattegat was affected by cyanobacteria blooms, likely transported here by ocean currents. Secondly, the satellite remote sensing time series for the period 2002-2020 indicated that near surface blooms were most frequent in the Northern Baltic Proper and that near surface blooms have increased in the Bothnian Sea, starting later in the season than in the Baltic Proper. The largest extents (i.e., total area covered) were observed in 2005, 2008, and 2018. Thirdly, phycocyanin fluorescence from a flow through sensor mounted on a merchant vessel was used as a proxy for cyanobacteria biomass and correlated to cyanobacteria biomass estimated by microscopy. However, the satellite remote sensing data on surface accumulations showed little resemblance to the data on cyanobacteria biomass based on water sampling and microscopy, interpreted as an effect of methods. Sensors on satellites mainly detect surface accumulations of cyanobacteria while the microscopy data was based on samples 0-10 m, thereby comprising a larger community. Data from satellite remote sensing of cyanobacteria was correlated to the phycocyanin fluorescence indicating that similar bio-optical properties are observed. Finally, results from a downscaled ocean climate model (NEMONordic) were used to produce future scenarios for temperature and salinity, which directly affects cyanobacteria blooms in the Baltic Sea, supposedly by increasing in abundance and change in species composition. Short-term forecasts can be used together with observations for early warning of cyanobacteria blooms, and we suggest an internationally coordinated cyanobacteria observation and warning system for the Baltic Sea area.

Keywords: Climate change; Ferrybox; Filamentous cyanobacteria; Harmful blooms; Remote sensing.


Conflict of interest statement

Declaration of Competing Interest The authors declare that they have no known competing financial interests or personal relationships that could have appeared to influence the work reported in this paper.

Figures

Fig 1
Fig. 1
Map of the Baltic Sea area with blue dots representing sampling locations for long-term Swedish national phytoplankton monitoring. Station labelled B3 represents two stations (B3 and B7) located close to each other. The red line represents the route of the merchant vessel TransPaper (renamed Tavastland in 2017) where underway measurements of phycocyanin fluorescence were performed and additional phytoplankton samples were collected. Inset map indicates sea areas for which satellite data were averaged: A = Southern Baltic Proper, B = Central Baltic Proper, C = Northern Baltic Proper, and D = Bothnian Sea.
Fig 2
Fig. 2
The spatial distribution of biomass of three cyanobacteria genera (B-D) and the sum of these (A). The size of the circles represents mean biomass in carbon for June–August for the period 2000–2020.
Fig 3
Fig. 3
The seasonal distribution of biomass of three cyanobacteria genera. A Aphanizomenon, B. Dolichospermum and C. Nodularia. Acronyms for sea basins: BB = Bothnian Bay, BS = Bothnian Sea (including the sea basin Northern Quark), BP = Baltic Proper and KAT = Kattegat. The details about box and whisker plots are described in Material and methods.
Fig 4
Fig. 4
The map illustrates the mean number of days per year with observations of near surface accumulations of filamentous cyanobacteria in summer (June–August) from satellite during the period 2002–2020. Sea areas in white were excluded from the analysis, see Material and methods for details. Maps of each year within the period are presented in Supplementary material, Fig. S2.
Fig 5
Fig. 5
Summary of satellite observations of near surface cyanobacteria accumulations. The area analysed is the same as for Fig. 4. Subpanels: a) the extent of surface accumulations of cyanobacteria (km2, normalised) b) indicates the duration of the blooms (days, normalised), and c) the intensity of the blooms (km2 days) during summer (June-August) for the period 2002–2020. Results from sub-basin shown in inset map in Fig. 1 are presented in Supplementary material Fig. S3.
Fig 6
Fig. 6
Seasonal variation in area of surface accumulation of cyanobacteria based on satellite observations. Solid lines represent mean extent 2002–2020 and the dashed lines represent standard deviations. A = Southern Baltic Proper, B = Central Baltic Proper, C = Northern Baltic Proper and D = Bothnian Sea. Basins is in Fig. 1.
Fig 7
Fig. 7
A comparison of satellite observations of near surface blooms and biomass of cyanobacteria as observed by microscopy (2002–2020, June-August). A. Nostocales, B. Aphanizomenon, C. Dolichospermum and D. Nodularia. Red: cloud free, no bloom detected using satellite, green: cloud cover, blue: subsurface bloom detected and violet: surface accumulation detected. Number of samples = 917.
Fig 8
Fig. 8
Phycocyanin fluorescence June-September 2015 along route of ship TransPaper with phycocyanin fluorescence sensor in underway Ferrybox system.
Fig 9
Fig. 9
Phycocyanin fluorescence (PC) vs biomass of three genera of cyanobacteria and Nostocales defined here as the sum of the three genera. A. Nostocales, B. Aphanizomenon, C. Dolichospermum and E. Nodularia. The phytoplankton samples analysed by microscopy were collected using an automated sampling device on ship TransPaper in June-September 2013 and 2015 along the route of ship in the Baltic Proper and the Bothnian Sea. n = 51. All data were log10 transformed. Blue lines indicate linear model fitted to the black data points assumed to represent a linear part of the relationship. Pearson R values and linear equations are shown.
Fig 10
Fig. 10
Phycocyanin fluorescence vs observations using the OLCI sensor on satellites Sentinel 3A and 3B Data were collected during cyanobacteria bloom for July 11–28, 2019. Phycocyanin fluorescence was observed using Ferrybox system on merchant vessel TransPaper. Reflectance values < 0 were excluded and data north of 60°N.
Fig 11
Fig. 11
Climate scenarios for the Baltic Sea area based on (Gröger et al., 2019). A. Salinity RCP4.5, B. Temperature RCP4.5, C. Salinity RCP8.5 and D. Temperature RCP8.5. Left 1970–1999, Middle 2070–2099 and right difference between the two periods.
Fig 12
Fig. 12
A concept for a climate service for harmful cyanobacteria. IBM = Individual Based Model.

References

    1. Adam B., Klawonn I., Sveden J.B., Bergkvist J., Nahar N., Walve J., Littmann S., Whitehouse M.J., Lavik G., Kuypers M.M.M., Ploug H. N2-fixation, ammonium release and N-transfer to the microbial and classical food web within a plankton community. ISME J. 2016;10(2):450–459. - PMC - PubMed
    1. Algermissen D., Mischke R., Seehusen F., Göbel J., Beineke A. Lymphoid depletion in two dogs with nodularin intoxication. Vet. Rec.-English Edition. 2011;169(1):15. - PubMed
    1. Andersson A., Höglander H., Karlsson C., Huseby S. Key role of phosphorus and nitrogen in regulating cyanobacterial community composition in the northern Baltic Sea. Estuar. Coast Shelf Sci. 2015;164:161–171.
    1. . HELCOM; Helsinki: 2017. Manual For Marine Monitoring in the COMBINE Programme of HELCOM.http://www.helcom.fi/Documents/Action%20areas/Monitoring%20and%20assessm...
    1. Arneborg L., Höglund A., Axell L., Lensu M., Liungman O., Mattsson J. Oil drift modeling in pack ice–sensitivity to oil-in-ice parameters. Ocean Eng. 2017;144:340–350.

Publication types

LinkOut - more resources