

Reduced representation sequencing accurately quantifies relative abundance and reveals population-level variation in Pseudo-nitzschia spp
- PMID: 36195429
- PMCID: PMC9869635
- DOI: 10.1016/j.hal.2022.102314
Reduced representation sequencing accurately quantifies relative abundance and reveals population-level variation in Pseudo-nitzschia spp
Abstract
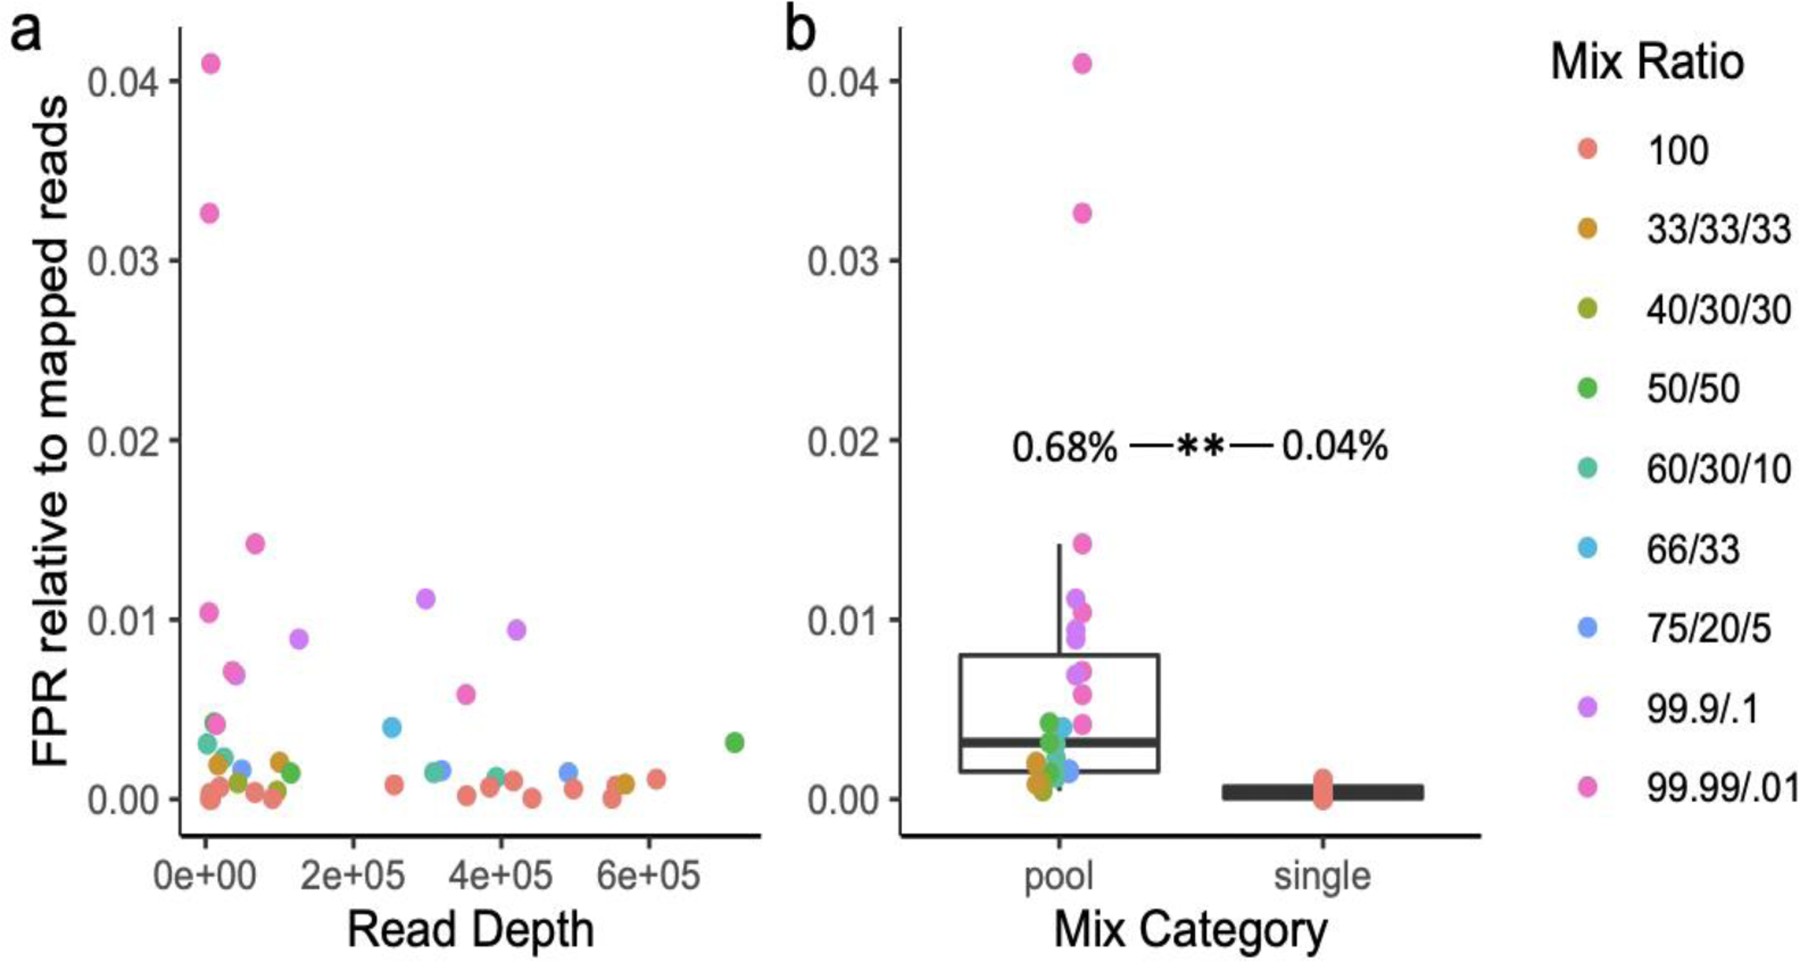
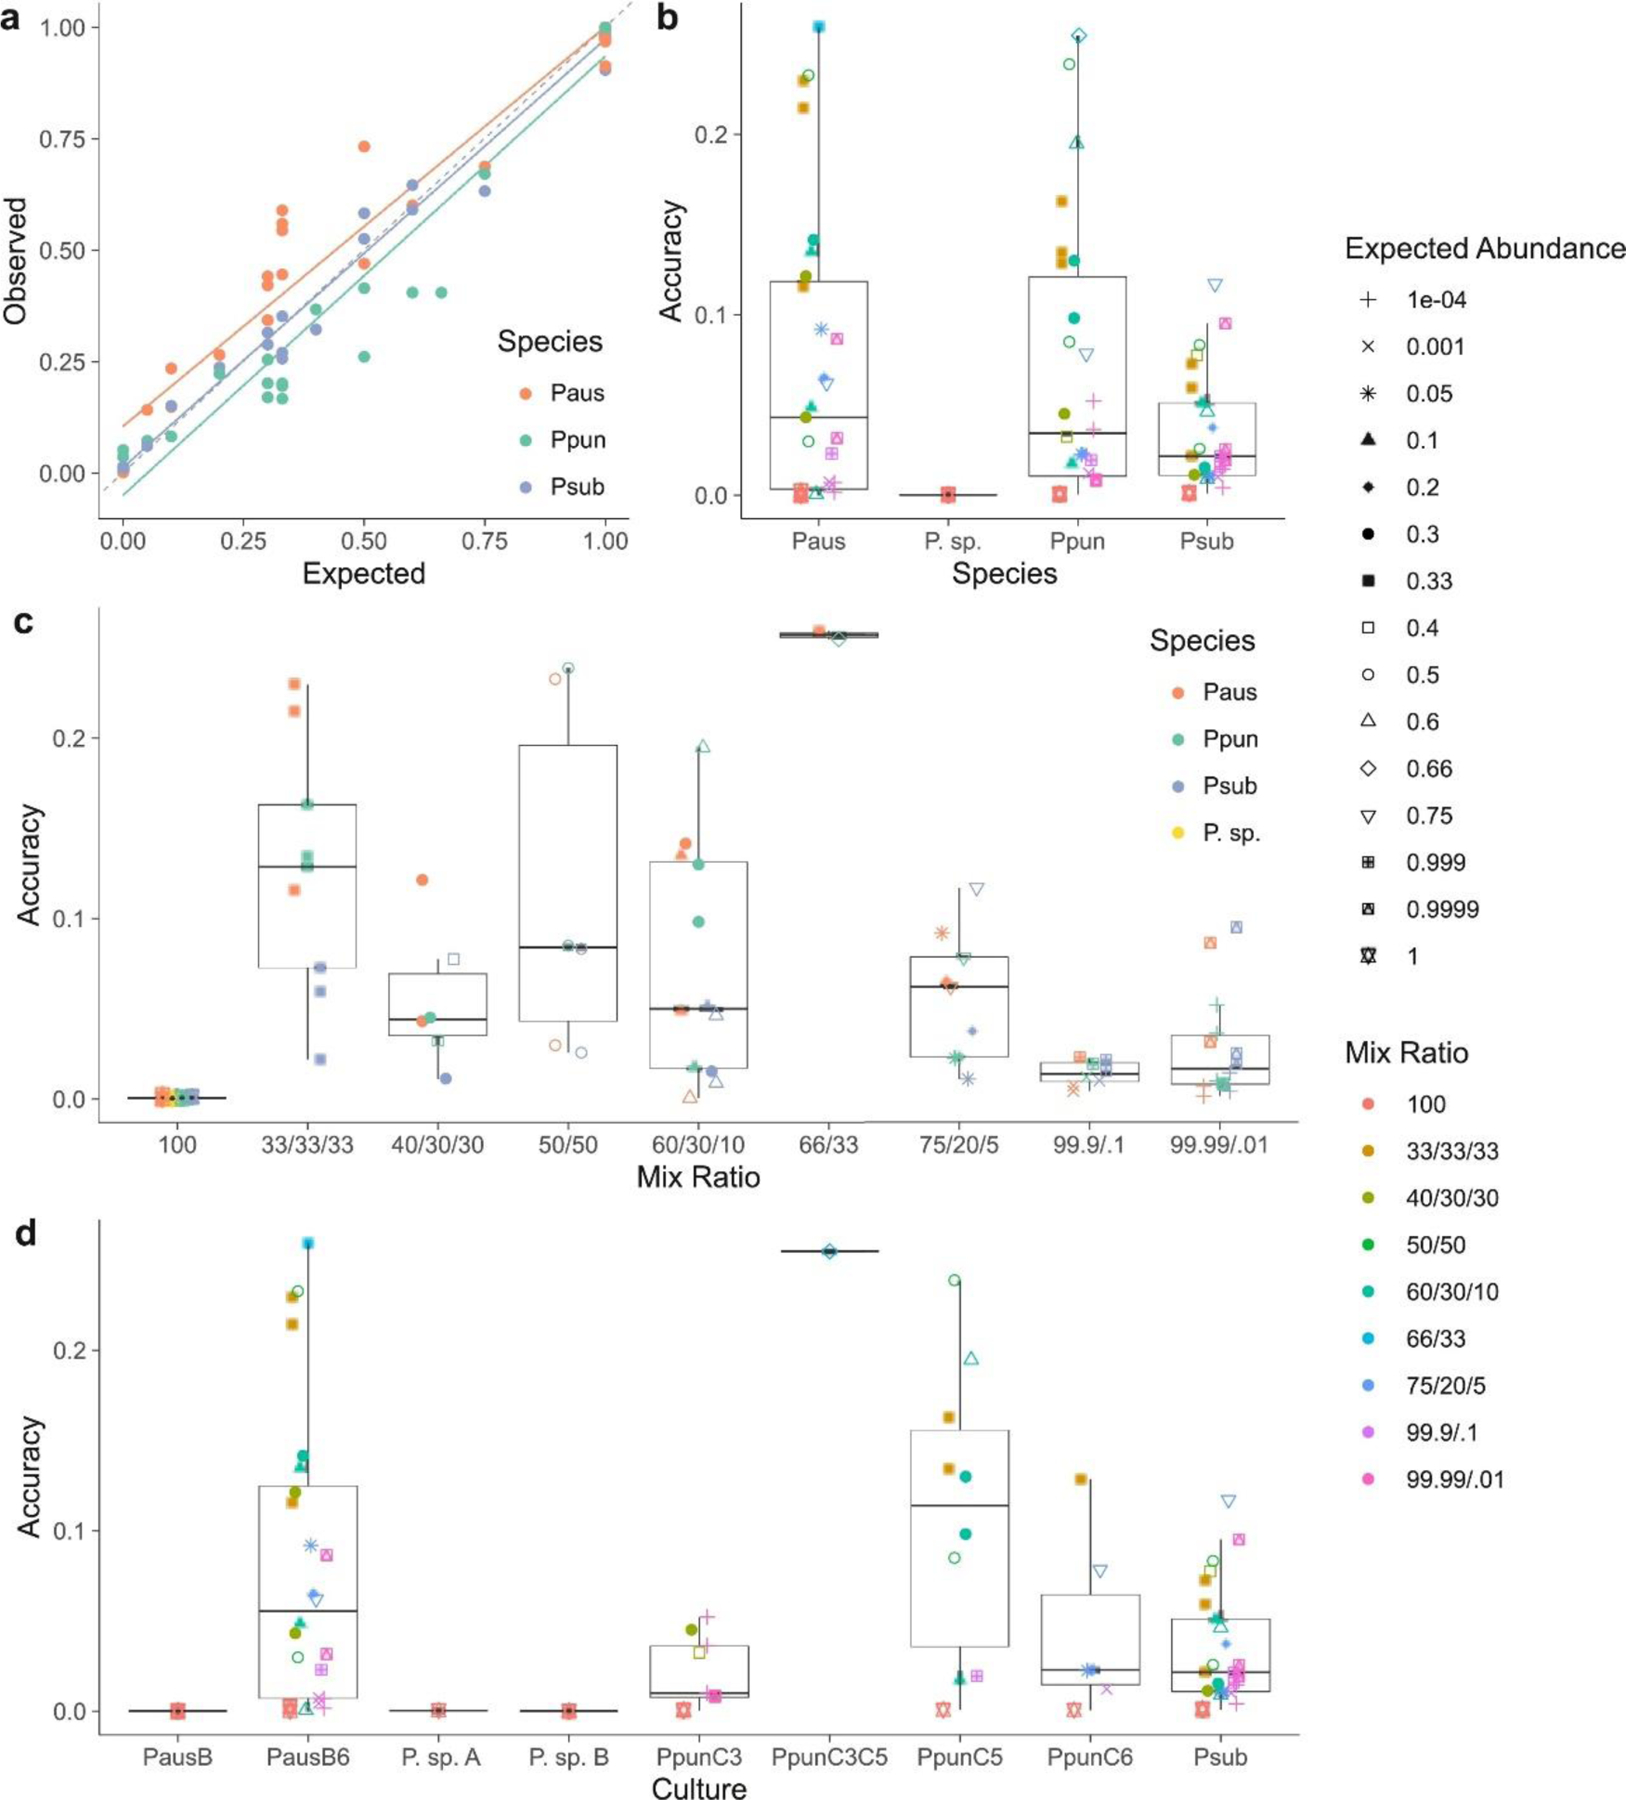
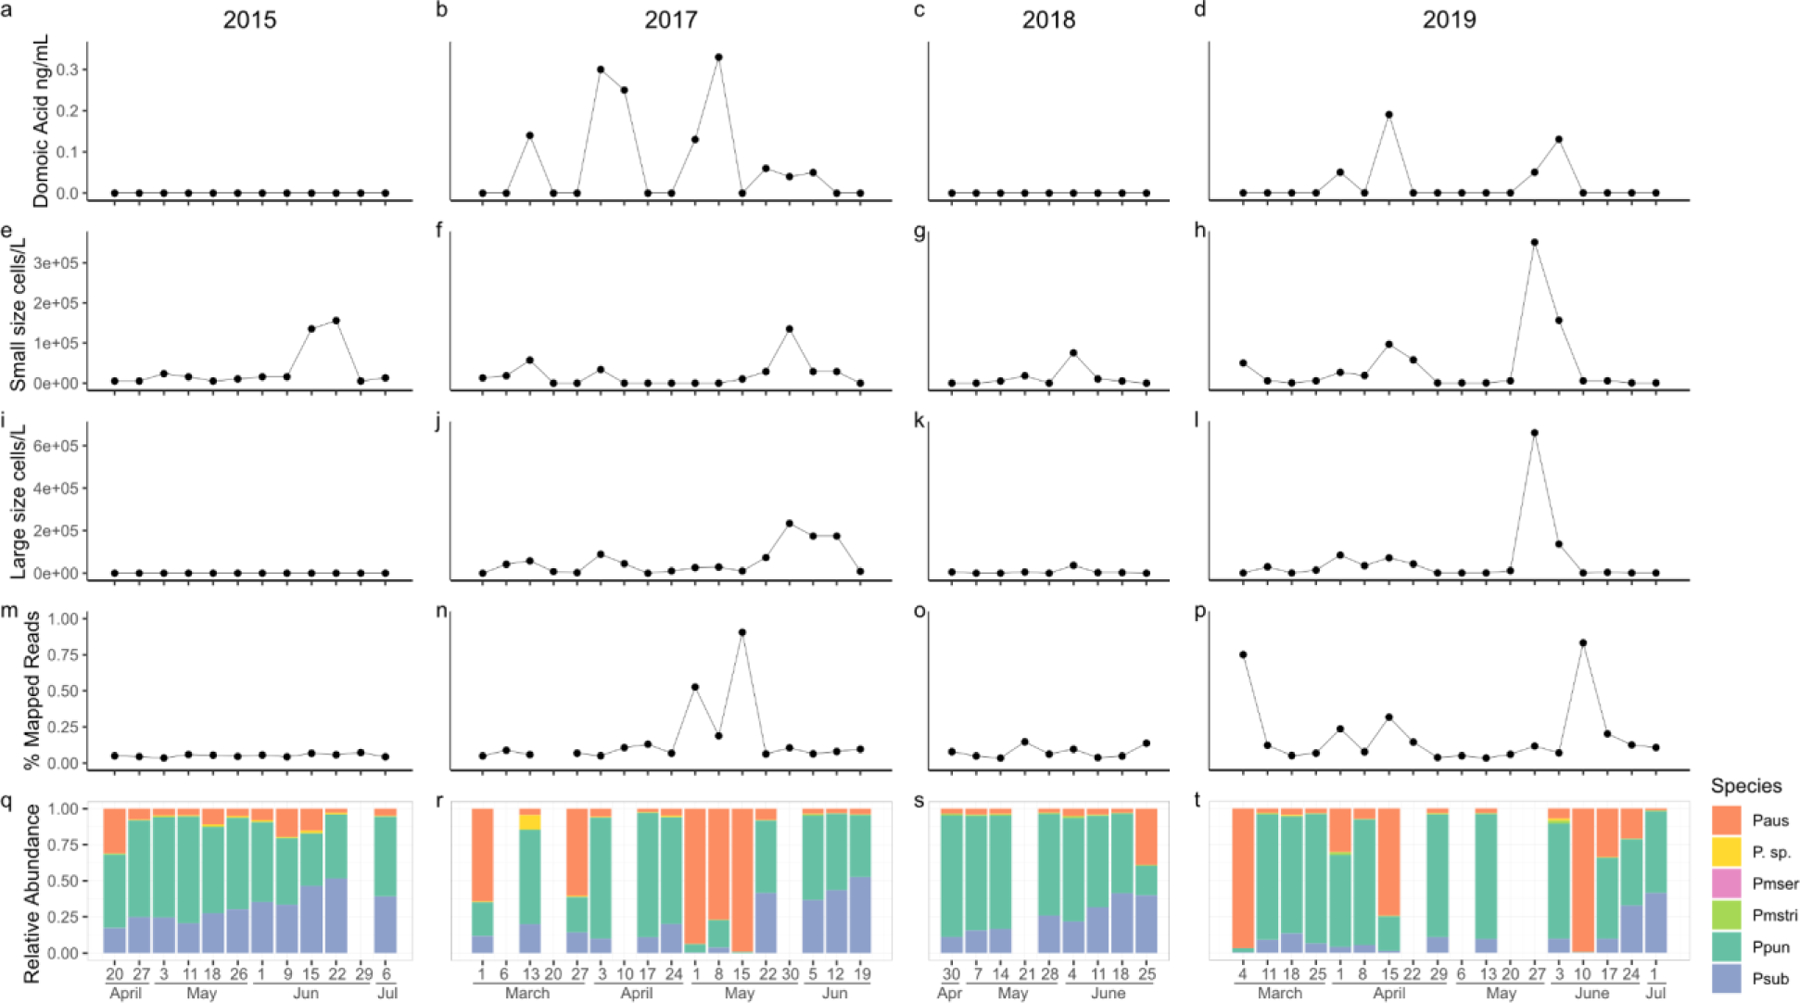
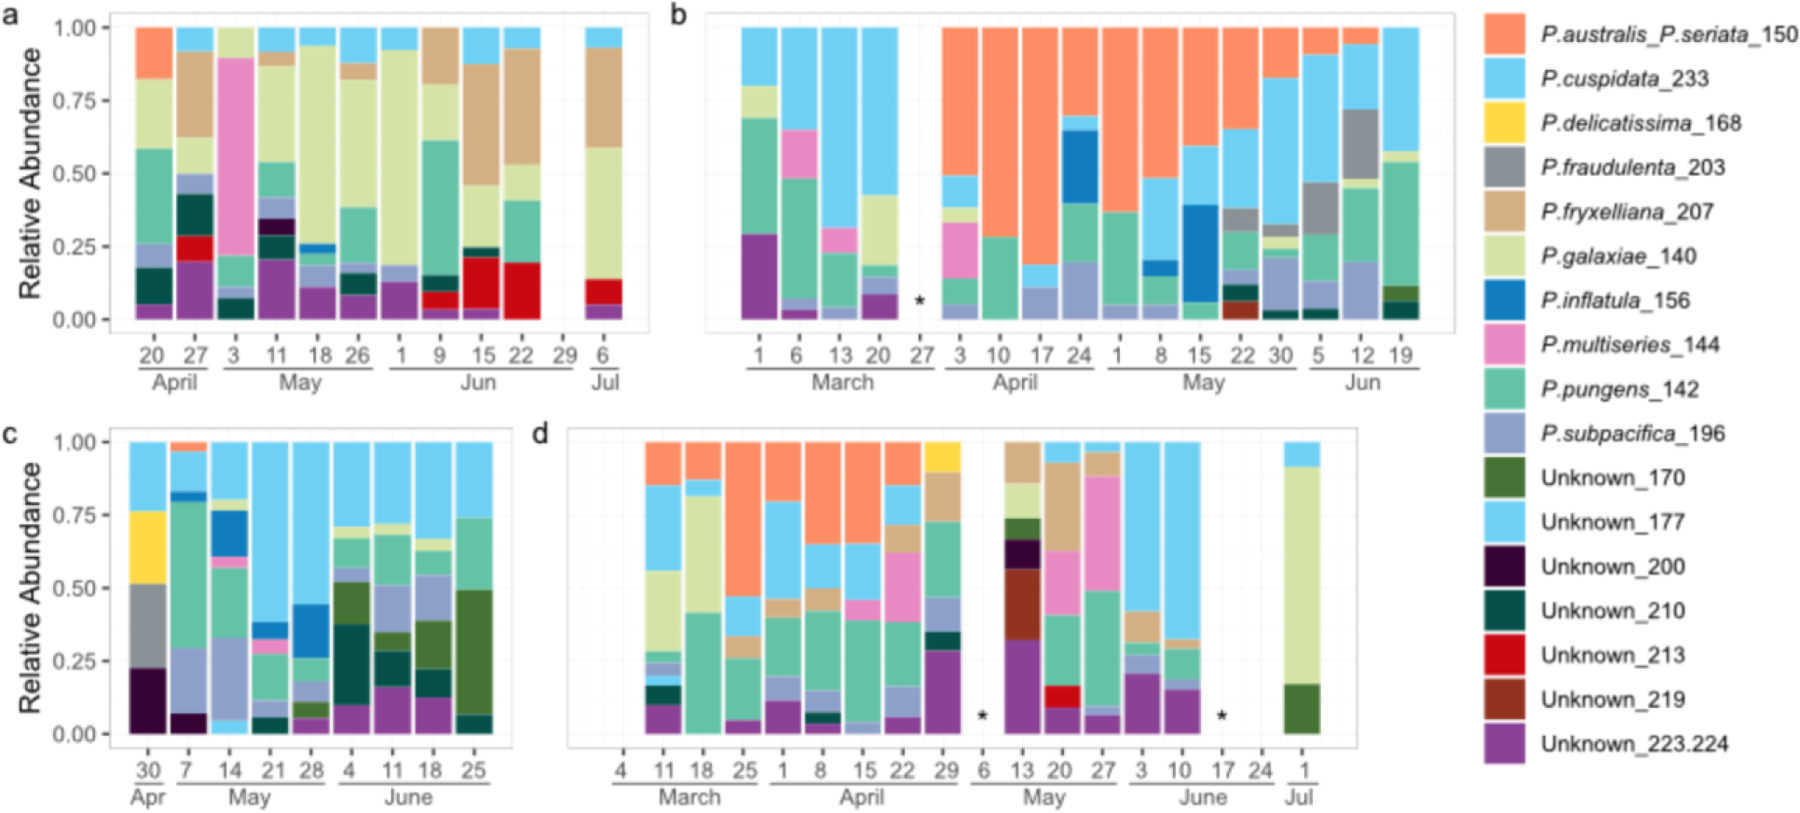
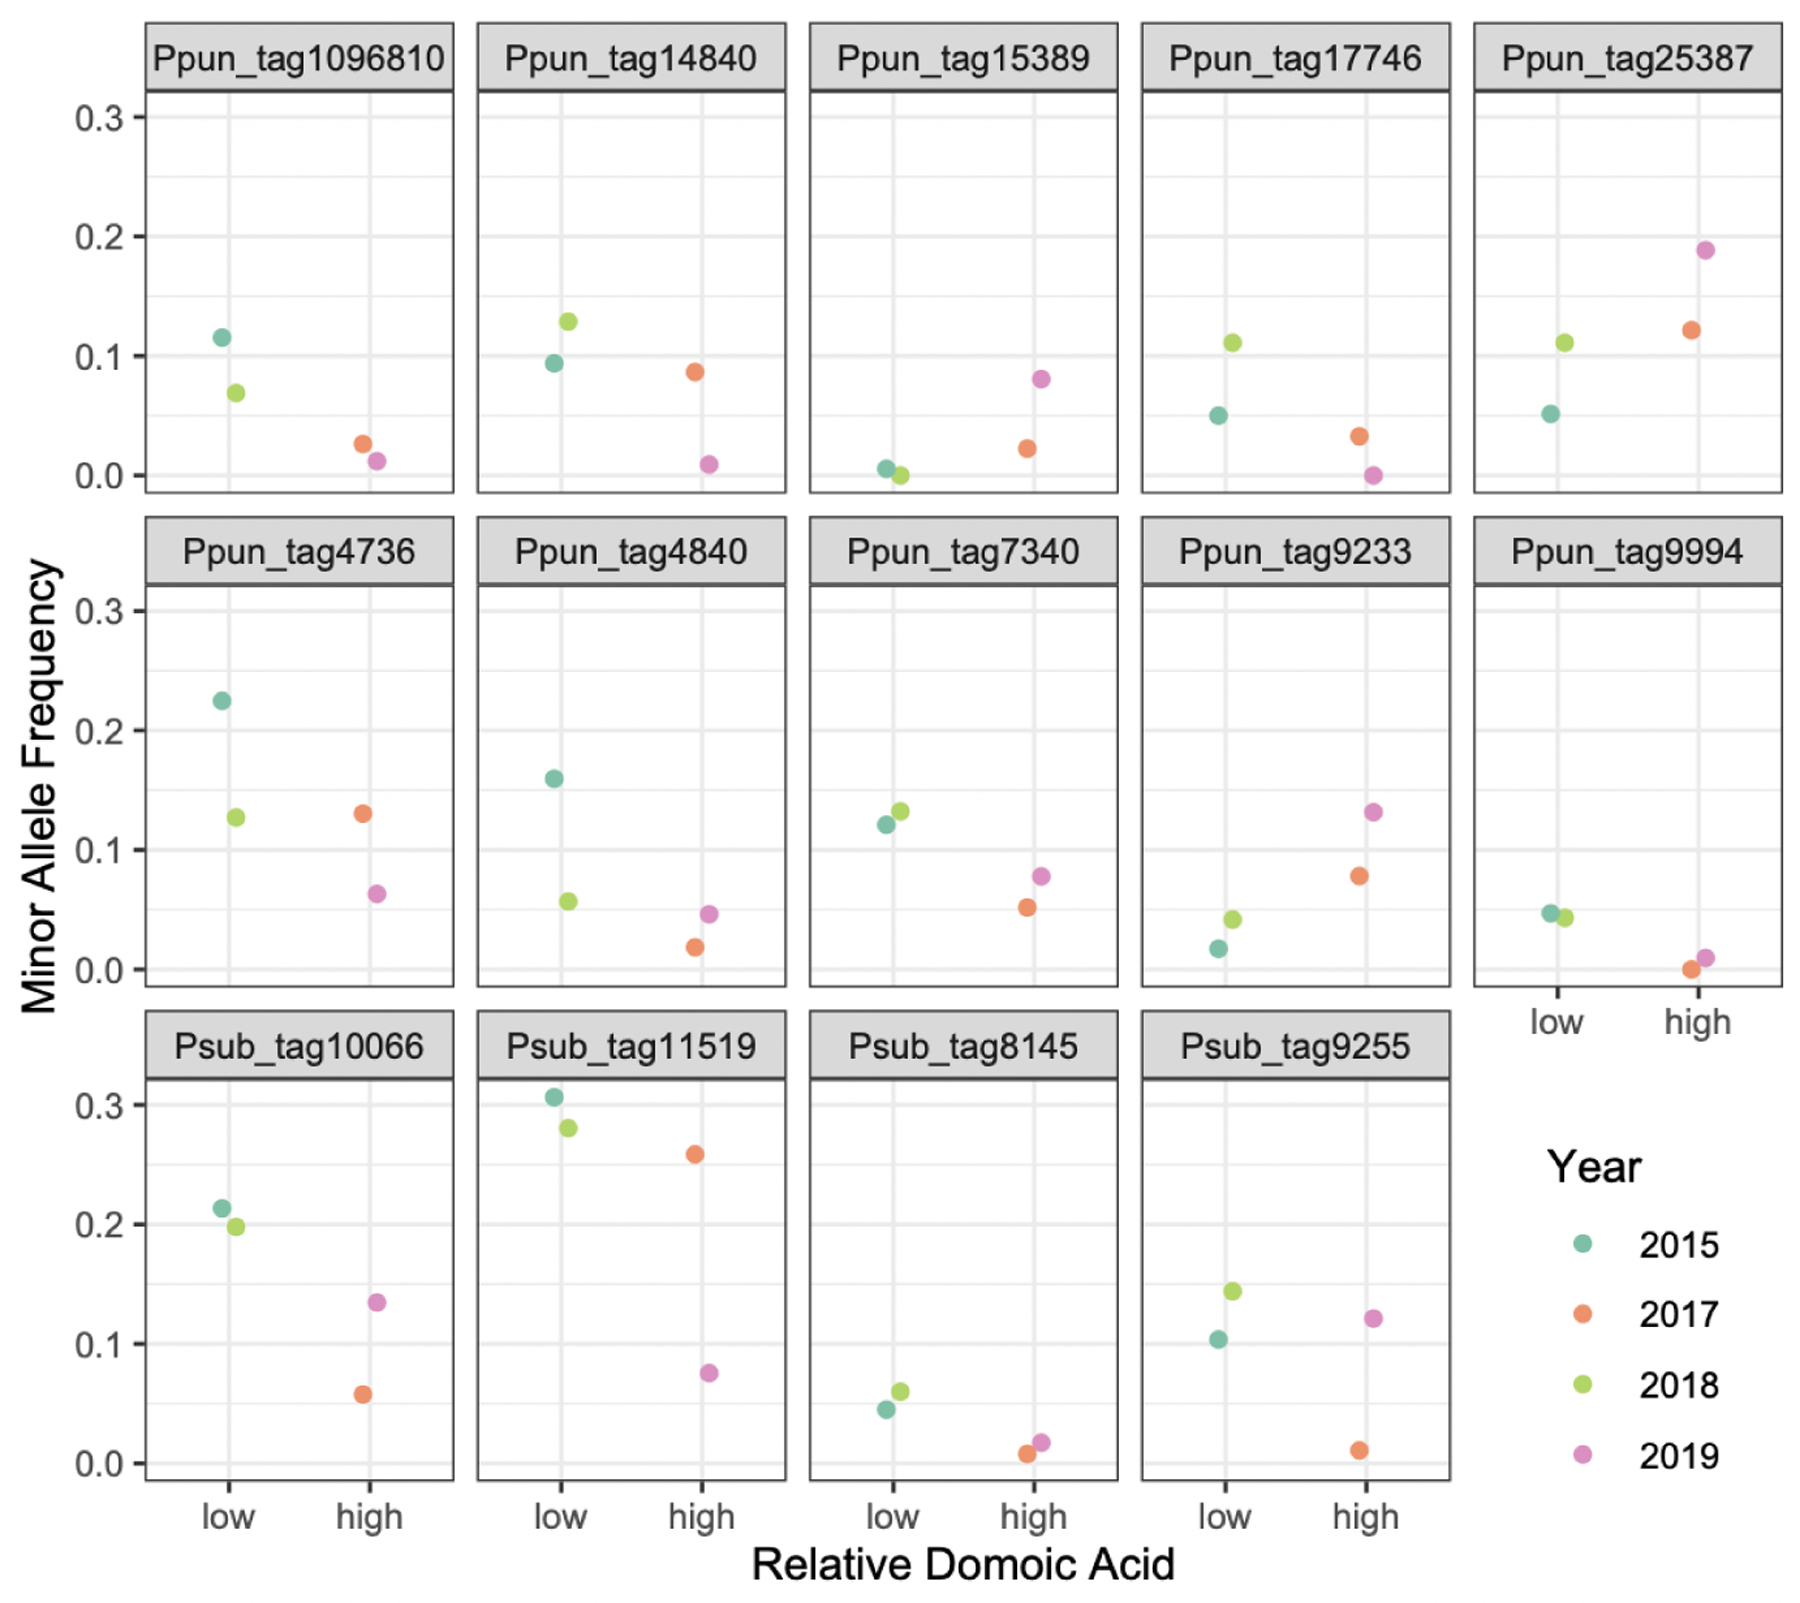
Certain species within the genus Pseudo-nitzschia are able to produce the neurotoxin domoic acid (DA), which can cause illness in humans, mass-mortality of marine animals, and closure of commercial and recreational shellfisheries during toxic events. Understanding and forecasting blooms of these harmful species is a primary management goal. However, accurately predicting the onset and severity of bloom events remains difficult, in part because the underlying drivers of bloom formation have not been fully resolved. Furthermore, Pseudo-nitzschia species often co-occur, and recent work suggests that the genetic composition of a Pseudo-nitzschia bloom may be a better predictor of toxicity than prevailing environmental conditions. We developed a novel next-generation sequencing assay using restriction site-associated DNA (2b-RAD) genotyping and applied it to mock Pseudo-nitzschia communities generated by mixing cultures of different species in known abundances. On average, 94% of the variance in observed species abundance was explained by the expected abundance. In addition, the false positive rate was low (0.45% on average) and unrelated to read depth, and false negatives were never observed. Application of this method to environmental DNA samples collected during natural Pseudo-nitzschia spp. bloom events in Southern California revealed that increases in DA were associated with increases in the relative abundance of P. australis. Although the absolute correlation across time-points was weak, an independent species fingerprinting assay (Automated Ribosomal Intergenic Spacer Analysis) supported this and identified other potentially toxic species. Finally, we assessed population-level genomic variation by mining SNPs from the environmental 2bRAD dataset. Consistent shifts in allele frequencies in P. pungens and P. subpacifica were detected between high and low DA years, suggesting that different intraspecific variants may be associated with prevailing environmental conditions or the presence of DA. Taken together, this method presents a potentially cost-effective and high-throughput approach for studies aiming to evaluate both population and species dynamics in mixed samples.
Keywords: 2b-RAD; Community composition; Harmful algal bloom; Next-generation sequencing; Population genomics.
Copyright © 2022 Elsevier B.V. All rights reserved.
Conflict of interest statement
Declaration of Competing Interest The authors declare that they have no known competing financial interests or personal relationships that could have appeared to influence the work reported in this paper.
Figures
References
-
- Adl SM, Leander BS, Simpson AGB, Archibald JM, Anderson OR, Bass D, Bowser SS, Brugerolle G, Farmer MA, Karpov S, Kolisko M, Lane CE, Lodge DJ, Mann DG, Meisterfeld R, Mendoza L, Moestrup Ø, Mozley-Standridge SE, Smirnov AV, Spiegel F, Collins T, Sullivan J, 2007. Diversity, nomenclature, and taxonomy of protists. Syst. Biol 56, 684–689. - PubMed
-
- Agrawal AA, Hastings AP, Johnson MTJ, Maron JL, Salminen J−P, 2012. Insect herbivores drive real-time ecological and evolutionary change in plant populations. Science 338, 113–116. - PubMed
-
- Anderson CR, Kudela RM, Kahru M, Chao Y, Rosenfeld LK, Bahr FL, Anderson DM, Norris TA, 2016. Initial skill assessment of the California harmful algae risk mapping (C-HARM) system. Harmful Algae 59, 1–18. - PubMed
Publication types
MeSH terms
Substances
Grants and funding
LinkOut - more resources
Full Text Sources
Miscellaneous
