. 2022 Oct;14(10):695-710.
doi: 10.1111/1753-0407.13323. Epub 2022 Oct 4.

Electroacupuncture reduces blood glucose by regulating intestinal flora in type 2 diabetic mice

Affiliations

Electroacupuncture reduces blood glucose by regulating intestinal flora in type 2 diabetic mice

Jing An et al. J Diabetes. 2022 Oct.

Abstract

Background: The development of diabetes is closely related to the gut microbiota in recent studies, which can be influenced by intestinal motility. A few studies report that electroacupuncture (EA) can lower blood glucose. EA can promote colonic motility and influence gut microbes. In this study, we explored the effect of the EA on blood glucose level in mice with type 2 diabetes (T2D) and its mechanism.

Methods: The T2D mice model, fecal microbiota transplantation mice model, and KitW/Wv mice model (Point mutation of mouse W locus encoding kit gene)were used to investigate the effect of EA on blood glucose as well as the mechanism; The blood glucose and insulin resistance level and the intestinal flora were evaluated. The level of intestinal junction protein, inflammatory cytokines in the serum, interstitial cells of Cajal content, and colonic motility were detected. Lastly, the IKKβ/NF-κB-JNK-IRS-1-AKT pathway was explored.

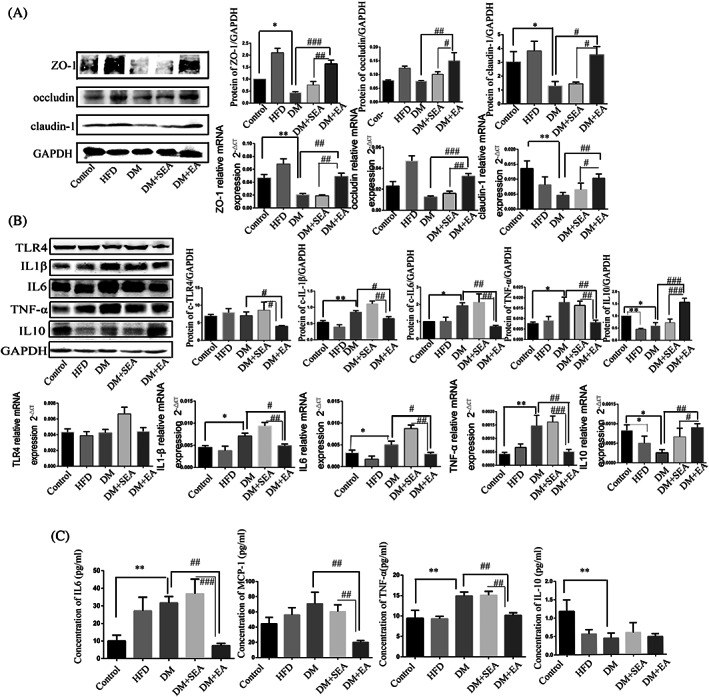
Results: EA lowered the blood glucose level, altered the gut microbiota, and promoted colonic motility in T2D mice. EA-altered microbiota decreased the blood glucose level and insulin resistance in the antibiotics-treated diabetic mice. EA increased tight junction protein, lowered inflammatory factors, and regulated the IKKβ/NF-κB-JNK-IRS-1-AKT pathway in the liver and muscles. EA could not reduce the blood glucose and regulated gut microbiota in the KitW/Wv mice model.

Conclusions: EA promoted intestinal motility to regulate the intestinal flora, thereby reducing the level of systemic inflammation, and ultimately lowering the blood glucose by the IKKβ/NF-κB-JNK-IRS-1-AKT signal pathway.

背景: 最近的研究表明, 糖尿病的发展与肠道菌群密切相关, 肠道菌群可能会受到肠道运动的影响。一些文献报道电针(EA)可以降低血糖。 EA可以促进结肠运动并影响肠道微生物。在这项研究中, 我们探讨了 EA 对 2 型糖尿病 (T2D) 小鼠血糖水平的影响及其机制。 方法: 采用T2D小鼠模型、FMT(粪菌移植)小鼠模型和KitW/Wv 小鼠模型, 研究电针对血糖的影响及其作用机制, 评估血糖和胰岛素抵抗水平以及肠道菌群。检测肠连接蛋白水平、血清和结肠炎性细胞因子水平、ICC(Cajal间质细胞)含量及结肠运动性。最后, 探索了 IKKβ/NF-κB-JNK-IRS-1-AKT 通路。 结果: 1. EA降低了T2D小鼠的血糖水平, 改变了肠道菌群, 促进了结肠运动。 2. EA 改变的微生物群降低了 ABX(抗生素)治疗的糖尿病小鼠的血糖水平和胰岛素抵抗。 3. EA增加紧密连接蛋白, 降低炎症因子, 并调节肝脏和肌肉中的IKKβ/NF-κB-JNK-IRS-1-AKT通路。 4. EA不能降低KitW/Wv 小鼠模型中的血糖和调节肠道菌群。 结论: 电针通过IKKβ/NF-κBJNK-IRS-1-AKT信号通路促进肠道运动, 调节肠道菌群, 从而降低全身炎症水平, 最终降低血糖。.

Keywords: 2型糖尿病; ICC; electroacupuncture; gut microbiota; inflammation; type 2 diabetes; 炎症; 电针; 肠道菌群.


Figures

FIGURE 1
FIGURE 1
Groups and experimental procedure. Program 1. Diabetic mice and EA treatment process. Program 2. ABX‐treated diabetic mice and FMT process. ABX, antibiotics; EA, electroacupuncture; FMT, fecal microbiota transplantation; HFD, high‐fat diet; ITT, insulin tolerance test; OGTT, oral glucose tolerance test; SEA, sham electroacupuncture; STZ, streptozotocin
FIGURE 2
FIGURE 2
The effects of EA and FMT on glycemic profile. (A). Body weight, food intake (a, b), and food efficiency (c) with EA treatment and FMT. B, C. The effects of EA on glycemic profile: (B). Assessment of the blood glucose among groups once every 2 weeks; the total reduction of blood glucose level (RBG and FBG) after the EA intervention; and the levels of serum HbA1c and fasting insulin. (C). OGTT, ITT, and calculation of the AUC. N = 6 in each group. D, E. The effects of the FMT on glycemic profile: (D). Assessment of the blood glucose status weekly, the total reduction of blood glucose level, and the level of serum fasting insulin. (E). OGTT, ITT, and calculation of the AUC. N = 6 in each group. *p < .05, **p < .01, ***p < .001, compared with control group. #p < .05, ##p < .01, ###p < .001 compared with the DM group and the DM + SEA group. ABX, antibiotics; AUC, area under the curve; DM, diabetic mice; EA, electroacupuncture; FBG, fasting blood glucose; FMT, fecal microbiota transplantation; HbA1c, glycosylated hemoglobin; HFD, high‐fat diet; IAUC, incremental area under the curve; ITT, insulin tolerance test; OGTT, oral glucose tolerance test; RBG, random blood glucose; SEA, sham electroacupuncture
FIGURE 3
FIGURE 3
The changes of gut microbiota. (A). Alpha diversity: Shannon‐Wiener diversity index. (B). PCoA analysis (PC3/PC1). (C). Phylum abundance, heatmap, and major bacterial phyla Firmicutes proportion. (D). Species abundance and species heatmap at the genus level. (E). The change of some gut microflora at the genus level. N = 6 in each group. *p < .05, **p < .01, ***p < .001, compared with control group. #p < 0.05, ##p < 0.01, ###p < 0.001 compared with the DM group and the DM + SEA group. DM, diabetic mice; EA, electroacupuncture; HFD, high‐fat diet; PCoA, principal coordinate analysis; SEA, sham electroacupuncture
FIGURE 4
FIGURE 4
The effects of EA on the intestinal epithelial barrier and the inflammatory cytokines. (A). The tight junction protein expression level and the mRNA level of such as ZO‐1, occludin, and claudin‐1 in the colon. (B). The protein and mRNA level of TLR4, IL‐1β, IL‐6, IL‐10, and TNF‐α in the colon. (C). Inflammatory cytokines level in serum such as IL‐6, MCP‐1, TNFα, and IL‐10. N = 6 in each group. *p < .05, **p < .01, ***p < .001, compared with control group. #p < .05, ##p < .01, ###p < .001 compared with the DM group and the DM + SEA group DM, diabetic mice; EA, electroacupuncture; HFD, high‐fat diet; IL, interleukin; MCP‐1, monocyte chemoattractant protein‐1; SEA, sham electroacupuncture; TLR4, toll‐like receptor 4; TNF, tumor necrosis factor; ZO‐1, zonula occludens‐1
FIGURE 5
FIGURE 5
The effects of EA on the IKKβ/NF‐κB‐JNK‐IRS‐1‐AKT signaling. (A). The protein levels of total p‐NF‐κB, Nuclear‐P‐NF‐κB,p‐IKKβ, p‐JNK, p‐IRS‐1, total IRS‐1, p‐AKT, and total AKT. N = 6 in each group. (B). The effects of EA on the IKKβ/NF‐κB‐JNK‐IRS‐1‐AKT signaling in the skeletal muscle. The EA inhibited the phosphorylation of IKKβ, total NF‐κB, Nuclear NF‐κB, JNK, and IRS‐1. The EA increased the phosphorylation of AKT protein. N = 6 in each group. *p < .05, **p < .01, ***p < .001, compared with the control group. #p < .05, ##p < .01, ###p < .001 compared with the DM group and the DM + SEA group. DM, diabetic mice; EA, electroacupuncture; HFD, high‐fat diet; SEA, sham electroacupuncture
FIGURE 6
FIGURE 6
The effects of EA on the GI motility and mSCF/c‐Kit expression. A‐C. In the diabetic mice model: (A). Evaluation of the GI motility: the whole gut transit time, defecation frequencies pellets for 24 h, and fecal water content. (B). The protein and mRNA levels of mSCF and c‐Kit in the colon. N = 6 in each group. *p < .05, **p < .01, ***p < .001, compared with the control group. #p < .05, ##p < .01, ###p < .001 compared with the DM group and the DM + SEA group. (C). The immunofluorescence intensity of Ano1 and c‐Kit in the colon with the EA treatment. N = 6 in each group. D‐F. In the kitW/Wv DM mice: (D). The effects of EA on the blood glucose level and insulin. (E). The effects of EA on the gut transit, defecation frequency and fecal water content. (F). The effect of EA on ICC expression. N = 4 in each group. Ano1, anoctamin 1; DM, diabetic mice; EA, electroacupuncture; GI, gastrointestinal; HFD, high‐fat diet; ICC, interstitial cells of Cajal; mSCF, membrane‐bound stem cell factor; SEA, sham electroacupuncture
FIGURE 7
FIGURE 7
The changes of gut microbiota in the kit‐deficient mice. (A). Shannon‐Wiener diversity index and PCoA (PC3/PC1). (B). Phylum abundance, heatmap and major bacterial phyla Firmicutes proportion. N = 4 in each group. ***p < .001, compared with the control group. (C). Species abundance, Species heatmap and some gut microflora at the genus level in the kit‐deficient mice. N = 4 in each group. ***p < .001, compared with the control group. DM, diabetic mice; EA, electroacupuncture; PCoA, principal coordinate analysis; SEA, sham electroacupuncture

Similar articles

Cited by

References

    1. Ishizaki N, Okushi N, Yano T, Yamamura Y. Improvement in glucose tolerance as a result of enhanced insulin sensitivity during electroacupuncture in spontaneously diabetic Goto‐Kakizaki rats. Metabolism. 2009;58(10):1372‐1378. - PubMed
    1. Liang F, Chen R, Nakagawa A, et al. Low‐frequency Electroacupuncture improves insulin sensitivity in obese diabetic mice through activation of SIRT1/PGC‐1alpha in skeletal muscle. Evid Based Complement Alternat Med. 2011;2011:735297. - PMC - PubMed
    1. Qin J, Li Y, Cai Z, et al. A metagenome‐wide association study of gut microbiota in type 2 diabetes. Nature. 2012;490(7418):55‐60. - PubMed
    1. Cotillard A, Kennedy SP, Kong LC, et al. Dietary intervention impact on gut microbial gene richness. Nature. 2013;500(7464):585‐588. - PubMed
    1. Wang H, Wang Q, Liang C, et al. Acupuncture regulating gut microbiota in abdominal obese rats induced by high‐fat diet. Evid Based Complement Alternat Med. 2019;2019:4958294. - PMC - PubMed