. 2022 Oct 4;13(1):5805.
doi: 10.1038/s41467-022-33110-5.

Tubular cell polyploidy protects from lethal acute kidney injury but promotes consequent chronic kidney disease

Affiliations

Tubular cell polyploidy protects from lethal acute kidney injury but promotes consequent chronic kidney disease

Letizia De Chiara et al. Nat Commun. .

Abstract

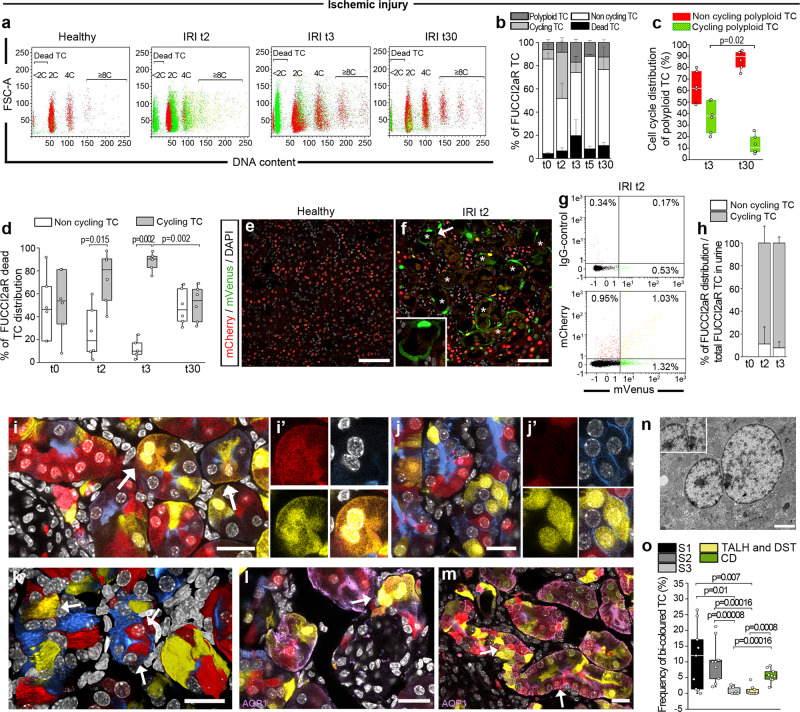
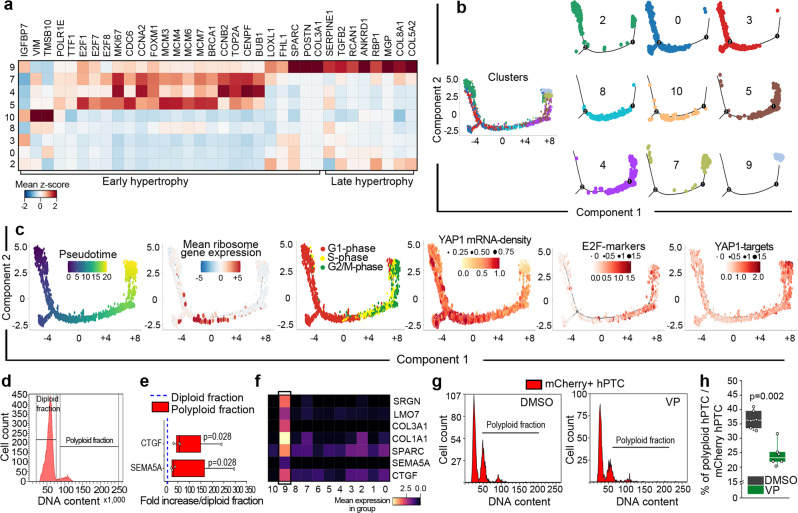
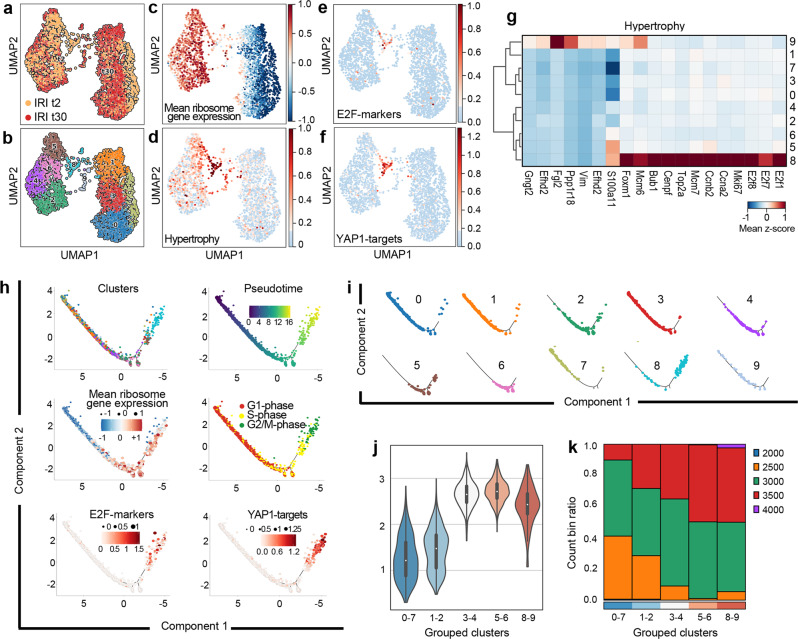
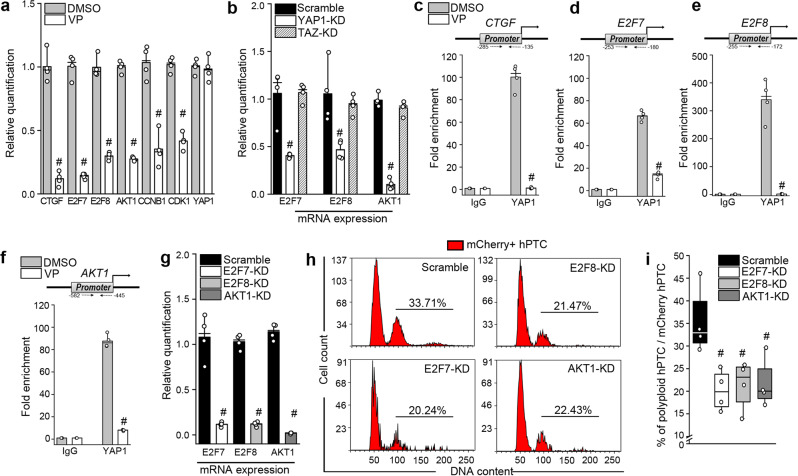
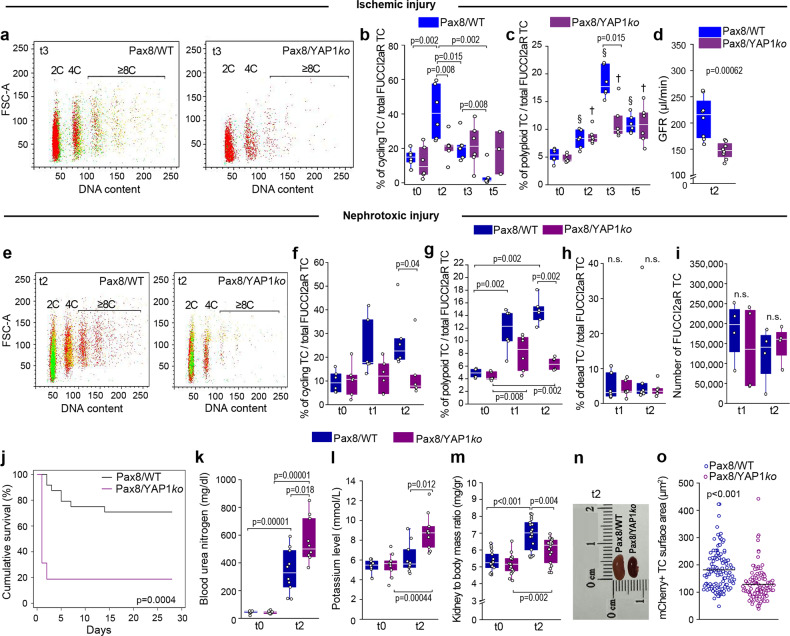
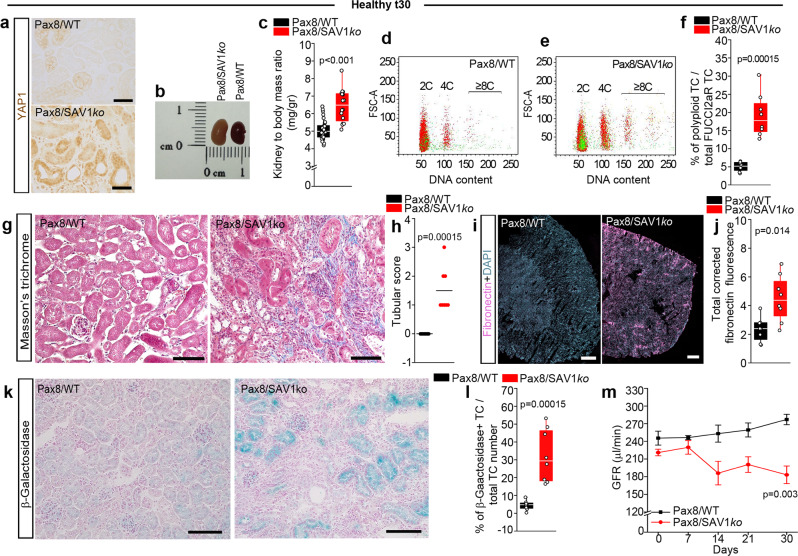
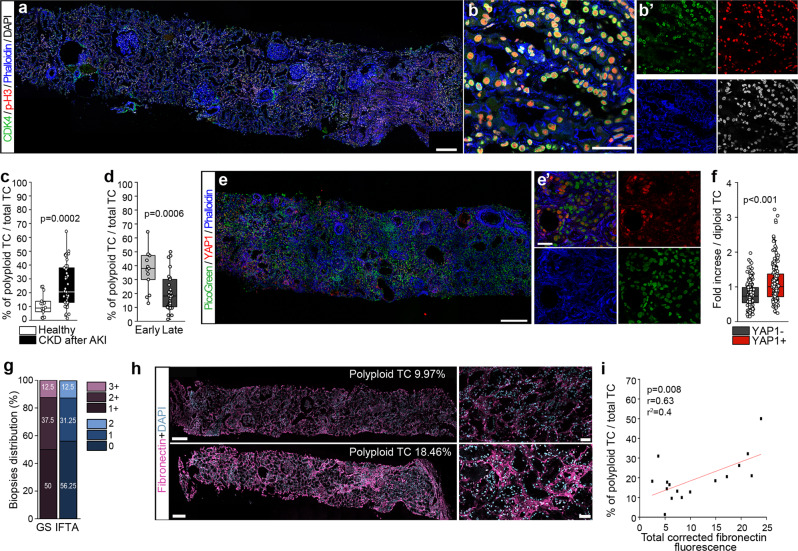
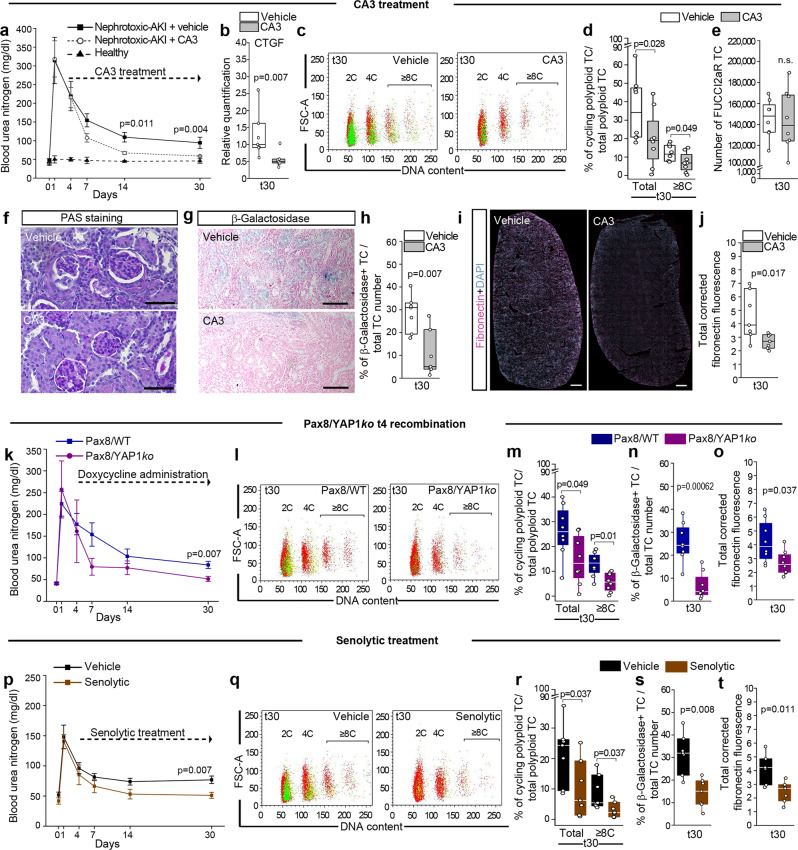
Acute kidney injury (AKI) is frequent, often fatal and, for lack of specific therapies, can leave survivors with chronic kidney disease (CKD). We characterize the distribution of tubular cells (TC) undergoing polyploidy along AKI by DNA content analysis and single cell RNA-sequencing. Furthermore, we study the functional roles of polyploidization using transgenic models and drug interventions. We identify YAP1-driven TC polyploidization outside the site of injury as a rapid way to sustain residual kidney function early during AKI. This survival mechanism comes at the cost of senescence of polyploid TC promoting interstitial fibrosis and CKD in AKI survivors. However, targeting TC polyploidization after the early AKI phase can prevent AKI-CKD transition without influencing AKI lethality. Senolytic treatment prevents CKD by blocking repeated TC polyploidization cycles. These results revise the current pathophysiological concept of how the kidney responds to acute injury and identify a novel druggable target to improve prognosis in AKI survivors.


Conflict of interest statement

The authors declare no competing interests.

Figures

Fig. 1
Fig. 1. The majority of tubular cells (TC) entering cell cycle becomes polyploid or dies following AKI.
a FACS plots of TC in Pax8/FUCCI2aR mice (n = 6) after IRI, showing dead (<2C), diploid (2C), tetraploid (4C) and octaploid or greater (≥8C) TC. Colours match those of the FUCCI2aR reporter. b FUCCI2aR TC distribution after IRI. Dead TC: t0vst3 p = 0.015, t0vst30 p = 0.008; t0vst5 p = 0.015, cycling TC: t0vst2 p = 0.002, t2vst3 p = 0.002, t2vst5 p = 0.002, t2vst30 p = 0.015; Polyploid TC: t0vst3 p = 0.002, t0vst5 p = 0.026, t0vst30 p = 0.008, t2vst3 p = 0.002, t3vst5 p = 0.004, t3vst30 p = 0.026 (n = 6 each time point). c Distribution of polyploid TC across cell cycle after IRI (n = 6). d Distribution of FUCCI2aR dead TC analysed by FACS after IRI (n = 6). Representative pictures of e healthy and f two days after IRI Pax8/FUCCI2aR mice showing necrotic tubu les (*) with mVenus+ TC. DAPI counterstains nuclei. Bars 75 µm. The inlet is a higher magnification of the tubule indicated by the arrow. g FACS analysis of cells from the urine of Pax8/FUCCI2aR mice after IRI. h Distribution across cell cycle of FUCCI2aR TC from the urine of healthy and after IRI mice (multiple urine samples pulled together, n = 6 mice for each time point). i, j Heterozygous Pax8/Confetti mice 30 days after IRI. Bars 20 µm. k 3D reconstruction of cortical tubules. Bar 20 µm. Arrows indicate bi-coloured TC. AQP1 staining in heterozygous Pax8/Confetti mice 30 days after IRI, arrows show bi-coloured TC in a representative l S1 segment and m S2 segment. Bars 20 µm. n Transmission electron microscopy of a binucleated polyploid TC 30 days after IRI. Bar 2 µm. o Bi-coloured TC distribution in tubular segments of heterozygous Pax8/Confetti mice after IRI (n = 9). t0: healthy, t2: day 2 after IRI, t3: day 3 after IRI, t5: day 5 after IRI, t30: day 30 after IRI. IRI ischemia reperfusion injury. S1: S1 segment of proximal tubule, S2: S2 segment of proximal tubule, S3: S3 segment of proximal tubule, DST distal straight tubule, TALH thick ascending limb of loop of Henle, CD collecting duct. AQP1 Aquaporin-1. Statistical significance was calculated by two-sided Mann-Whitney test; numbers on graphs represent exact p values. Data are expressed as mean ± SEM in graph 1b and 1h. Box-and-whisker plots: line = median, box = 25–75%, whiskers = outlier (coef. 1.5).
Fig. 2
Fig. 2. Polyploidization of human proximal tubular cells (hPTC) is controlled by YAP1.
a Matrix plot of hPTC clusters showing hypertrophy genes. b Monocle2 pseudotime trajectory of hPTC clusters and “facet” trajectory (right) showing cluster distribution in order of appearance. c Monocle2 trajectory of hPTC coloured by pseudotime, mean ribosome gene expression difference, cell cycle phases, YAP1 mRNA accumulation, E2F-markers (E2F1, E2F7, E2F8) and YAP1-targets (ANKDR1, BIRC5, CTGF, CDK1, CCNB1, AKT1). d Cell cycle distribution of mCherry-hPTC. e Gene expression of sorted polyploid mCherry-hPTC over diploid mCherry-hPTC (n = 4). f Matrix plot of cluster 9 characteristic genes. g Cell cycle distribution of mCherry-hPTC treated with DMSO or with verteporfin (VP). A representative experiment out of 6 is shown. h Percentage of polyploid mCherry-hPTC in DMSO-treated or VP-treated culture (n = 6). Statistical significance was calculated by two-sided Mann-Whitney test; numbers on graphs represent exact p values. Box-and-whisker plots: line = median, box  = 25–75%, whiskers = outlier (coef. 1.5).
Fig. 3
Fig. 3. Polyploidization of proximal tubular cells (PTC) after AKI in mice is controlled by YAP1.
a UMAP of experimental time distribution and b cluster distribution of mouse PTC at day 2 (t2) and 30 (t30) after IRI. c UMAP showing ribosome gene expression difference and d hypertrophy genes (Top2a, Mcm7, Ccna2, Ccnb2, Tmsb10, S100a11). e UMAP showing E2F-markers (E2f1, E2f7, E2f8) and f YAP1-targets (Ankdr1, Birc5, Ctgf, Cdk1, Ccnb1, Akt1) in PTC. g Matrix plot of PTC at 2 and 30 days after IRI, showing hypertrophy genes. h Monocle2 trajectory of PTC clusters and trajectory of PTC coloured by pseudotime, mean ribosome gene expression difference, cell cycle phases, E2F-markers (E2f1, E2f7, E2f8) and YAP1-targets (Ankdr1, Birc5, Ctgf, Cdk1, Ccnb1, Akt1). i Monocle2 “facet” trajectory showing cluster distribution in order of appearance. j Violin plots showing ribosome distribution in clusters grouped by ribosome gene expression. Median distribution is represented by the white dot; the black bar in the centre of the violin represents the interquartile range between the first and third quartile; the black lines stretched from the bar represent the lower/upper adjacent values defined as first interquartile −1.5 and third interquartile +1.5, respectively. k Bar plot showing the binned normalized counts distribution in each cluster group. IRI ischemia reperfusion injury.
Fig. 4
Fig. 4. YAP1 controls polyploidization via AKT1, E2F7 and E2F8 activation.
a qRT-PCR analysis of YAP1 targets in DMSO and verteporfin (VP) treated mCherry-hPTC (n = 4). CTGF was used as a positive control. YAP1 was used as a negative control. # Significance between DMSO and VP treated mCherry-hPTC for each gene analysed, p = 0.028. b qRT-PCR quantification of E2F7, E2F8 and AKT1 in scramble, YAP1, and TAZ knock-down (KD) mCherry-hPTC (n = 4). # Significance between scramble and YAP1-KD mCherry-hPTC for each gene analysed, p = 0.028. Scramble and TAZ-KD conditions are not significantly different. Chromatin immunoprecipitation assay showing YAP1 binding on c CTGF, d E2F7, e E2F8 and f AKT1 promoters in DMSO and VP treated mCherry-hPTC (n = 4). #Significance between DMSO and VP treated mCherry-hPTC, p = 0.028. g KD efficiency of E2F7, E2F8 and AKT1 GapmeRs (n = 4). #Significance between scramble and KD mCherry-hPTC, p = 0.028. h Cell cycle distribution of mCherry-hPTC transfected with scramble, E2F7, E2F8 and AKT1 GapmeRs. A representative experiment out of 4 is shown. i Percentage of polyploid mCherry-hPTC in scramble-treated, E2F7-KD, E2F8-KD and AKT1-KD cultures (n = 4). # Significance between scramble and KD mCherry-hPTC, p = 0.028. hPTC: human proximal tubular cells. Statistical significance was calculated by two-sided Mann-Whitney test. Box-and-whisker plots: line = median, box = 25–75%, whiskers = outlier (coef. 1.5). Bar plots: line = mean, whisker =  outlier (coef. 1.5).
Fig. 5
Fig. 5. Early tubular cell (TC) polyploidization preserves residual kidney function and assures survival during AKI.
a FACS plots of Pax8/FUCCI2aR (Pax8/WT) (n = 6) and Pax8/FUCCI2aR/YAP1ko (Pax8/YAP1ko) (n = 6) showing diploid (2C), tetraploid (4C) and octaploid or greater (≥8C) TC. Colours match the FUCCI2aR reporter. b Percentage of cycling TC in healthy (t0) mice and after IRI (n = 6). c Percentage of polyploid TC in healthy (t0) mice and after IRI (n = 6). (§) Significance within Pax8/WT mice: t0vst2 p = 0.015, t0vst3 p = 0.002, t0vst5 p = 0.002, t2vst3 p = 0.002, t2vst5 p = 0.026, t3vst5 p = 0.002. (†) Significance within Pax8/YAP1ko mice t0vst2 p = 0.002, t0vst3 p = 0.002, t2vst3 p = 0.04. d Glomerular filtration rate (GFR) measurement (n = 8). (t0 = healthy, t2 = day 2 after IRI, t3 = day 3 after IRI, t5 = day 5 after IRI). e FACS plots of Pax8/WT (n = 6) and Pax8/YAP1ko (n = 6) TC after nephrotoxic injury, showing diploid (2C), tetraploid (4C) and octaploid or greater (≥8C) TC. f Percentage of cycling TC in healthy (t0) mice and after nephrotoxic injury (n = 6). g Percentage of polyploid TC in healthy mice (t0) and after nephrotoxic injury (n = 6). h Percentage of dead TC after nephrotoxic injury (n = 6). i Total FUCCI2aR TC number after nephrotoxic injury (n = 4). j Survival analysis of mice after nephrotoxic injury. Kaplan-Meier analysis showed a significant difference at Log rank comparison X2 = 17.663, p = 0.0004 (n = 24 Pax8/WT, n = 14 Pax8/YAP1ko, none censored). k Blood urea nitrogen measurement (n = 10). l Potassium level in the serum (n = 10). m Kidney weight (n = 18), p = 0.0000016. n Picture of Pax8/WT and Pax8/YAP1ko kidneys 2 days after nephrotoxic injury. o Cell surface area of mCherry+ TC at day 1 and 2 after nephrotoxic injury. 30 TC for each mouse (t1 n = 2; t2 n = 2) were counted. (t0 = healthy, t1 = day 1 after nephrotoxic AKI, t2 = day 2 after nephrotoxic AKI, p = 5.4 × 10−10). Statistical significance was calculated by two-sided Mann-Whitney test; numbers on graphs represent exact p values or are provided in the legend. Box-and-whisker plots: line = median, box = 25–75%, whiskers = outlier (coef. 1.5).
Fig. 6
Fig. 6. Pax8/SAV1ko healthy mice show increased tubular cell (TC) polyploidization and spontaneously progress toward CKD.
a Representative pictures for immunohistochemistry of active-YAP1 staining. Bars 100 µm. A representative experiment out of 4 is shown. b Picture of Pax8/FUCCI2aR/SAV1ko (Pax8/SAV1ko) and Pax8/WT kidneys. c Kidney weight in Pax8/WT (n = 30) and Pax8/SAV1ko mice (n = 16), p = 7.2 × 10−6. FACS plots of TC in d Pax8/WT and in e Pax8/SAV1ko mice, showing diploid (2C), tetraploid (4C) and octaploid or greater (≥8C) TC. Colours match the FUCCI2aR reporter (n = 8). f Percentage of polyploid TC (n = 8). g Representative pictures of Masson’s trichrome staining (n = 8). Bars 100 µm. h Tubular score evaluated on Masson’s trichrome staining (n = 8). i Sequential scanning of kidney section stained for fibronectin. DAPI counterstains nuclei. Bars 500 µm. j Quantification of fibronectin deposition by digital morphometry (n = 8). k Senescence-associated β-galactosidase assay (n = 8). Bars 100 µm. l Percentage of β-galactosidase+ TC (n = 8). m GFR measurement for 30 days (n = 5). Statistical significance was calculated by two-sided Mann-Whitney test; numbers on graphs represent exact p values or are provided in the legend. Two-way ANOVA test of significance followed by Bonferroni post-test was employed for graph m. Data are expressed as mean ± SEM in graph m. Box-and-whisker plots: line = median, box = 25–75%, whiskers = outlier (coef. 1.5).
Fig. 7
Fig. 7. YAP1-driven tubular cell (TC) polyploidization attenuates AKI but aggravates AKI-CKD transition.
a Transmission electron microscopy of a binucleated TC in Pax8/SAV1ko mice at day 30 after IRI. Bar 5 µm. b FACS plots of TC in Pax8/WT (n = 6) and in Pax8/SAV1ko mice (n = 6) at day 30 after IRI, showing diploid (2C), tetraploid (4C) and octaploid or greater (≥8C) TC. Colours match the FUCCI2aR reporter. c Cell cycle distribution of polyploid TC at day 30 after IRI (n = 6). d Matrix plot showing epithelial, fibrotic and senescence genes in mouse proximal tubular cells at day 2 and 30 after IRI. e FACS plots of TC at day 30 (t30) after nephrotoxic injury in Pax8/WT (n = 8) and in Pax8/SAV1ko mice (n = 8). f Percentage of polyploid TC after nephrotoxic injury (n = 8). g Sequential scanning of whole kidney sections stained for fibronectin at day 30 after nephrotoxic injury. DAPI counterstains nuclei. Bars 500 µm. h Quantification of fibronectin deposition by digital morphometry after nephrotoxic injury (n = 8). i Tubular score evaluated on Masson’s trichrome staining (n = 8). j Senescence-associated β-galactosidase assay at day 30 after nephrotoxic injury (n = 8). Bars 100 µm. k Percentage of β-galactosidase+ TC after nephrotoxic injury (n = 8). l Blood urea nitrogen measurement after nephrotoxic injury (n = 10 nephrotoxic Pax8/WT and Pax8/SAV1ko, n = 6 healthy Pax8/SAV1ko). #statistical significance calculated between nephrotoxic Pax8/WT and Pax8/SAV1ko, *statistical significance calculated between nephrotoxic and healthy Pax8/SAV1ko. m Survival analysis after nephrotoxic injury. Kaplan-Meier analysis showed a significant difference at Log rank comparison X2 = 5.07, p = 0.024 (n = 24 Pax8/WT, n = 11 Pax8/SAV1ko, none censored). Statistical significance was calculated by two-sided Mann-Whitney test; numbers on graphs represent exact p values or are provided in the legend. Data are expressed as mean ± SEM in graph l. Box-and-whisker plots: line = median, box = 25–75%, whiskers = outlier (coef. 1.5).
Fig. 8
Fig. 8. YAP1-related tubular cell (TC) polyploidization correlates with fibrosis in human kidney biopsies.
a Representative sequential scanning of kidney biopsy from a CKD after AKI patient showing CDK4, p-H3 and Phalloidin staining (n = 45). DAPI counterstains nuclei. Bar 250 µm. b, b’ Higher magnification of kidney section with split images. Bar 50 µm. c Percentage of polyploid TC in CKD after AKI (n = 45) vs healthy patients (n = 18). d Percentage of polyploid TC in “early” (n = 14) and “late” groups (n = 31). e Representative sequential scanning of kidney biopsy from a CKD after AKI patient showing YAP1 and Phalloidin staining (n = 8). PicoGreen counterstains nuclei. Bar 250 µm. e’ Higher magnification of kidney section with split images. Bar 25 µm. f DNA content quantification of YAP1+ nuclei vs YAP1 nuclei of TC over diploid TC (n = 8, for each biopsy 25 YAP1+/Phalloidin+ and 25 YAP1/Phalloidin+ nuclei respectively were quantified), p = 2.19 × 1011. g Scoring of glomerular sclerosis (GS) and interstitial fibrosis and tubular atrophy (IFTA) in kidney biopsies of “late” group (n = 16). h Representative sequential scanning of biopsies stained for fibronectin (n = 16). DAPI counterstains nuclei. Bars 250 µm. i Linear correlation between polyploid TC and fibronectin deposition quantified by digital morphometry in the “late” group (n = 16) was assessed by Pearson correlation coefficient. Statistical significance was calculated by two-sided Mann-Whitney test; numbers on graphs represent exact p values or are provided in the legend. Box-and-whisker plots: line = median, box = 25–75%, whiskers = outlier (coef. 1.5).
Fig. 9
Fig. 9. Time-dependent inhibition of tubular cells (TC) polyploidization attenuates AKI-CKD transition.
a Blood urea nitrogen measurement in healthy WT mice (n = 5) and after nephrotoxic injury (n = 7). b qRT-PCR for YAP1-downstream target CTGF in nephrotoxic injury after CA3 treatment (n = 7). c FACS plots of TC in Pax8/FUCCI2aR mice after nephrotoxic injury, showing diploid (2C), tetraploid (4C) and octaploid or greater (≥8C) TC (n = 8). Colours match the FUCCI2aR reporter. d Percentage of total and ≥8C cycling polyploid TC in Pax8/FUCCI2aR mice after nephrotoxic injury (n = 8). e Total number of FUCCI2aR TC after nephrotoxic injury (n = 8). f PAS staining in WT mice at day 30 after nephrotoxic injury (n = 7). Bars 50 µm. g Senescence-associated β-galactosidase assay in WT mice at day 30 after nephrotoxic injury (n = 7). Bars 100 µm. h Percentage of β-galactosidase+ TC (n = 7). i Sequential scanning of kidney sections stained for fibronectin in WT mice at day 30 after nephrotoxic injury (n = 7). Bars 500 µm. DAPI counterstains nuclei. j Quantification of fibronectin deposition by digital morphometry (n = 7). k Blood urea nitrogen measurement in Pax8/WT and Pax8/YAP1ko mice after nephrotoxic injury (n = 8). l FACS plots of TC after nephrotoxic injury showing diploid (2C), tetraploid (4C) and octaploid or greater (≥8C) TC (n = 8). Colours match the FUCCI2aR reporter. m Percentage of total and ≥8C cycling polyploid TC (n = 8). n Percentage of β-galactosidase+ TC (n = 8). o Quantification of fibronectin deposition by digital morphometry (n = 8). p Blood urea nitrogen measurement in Pax8/WT mice after nephrotoxic injury (n = 7). q FACS plots of TC in Pax8/FUCCI2aR mice after nephrotoxic injury, showing diploid (2C), tetraploid (4C) and octaploid or greater (≥8C) TC (n = 7). Colours match the FUCCI2aR reporter. r Percentage of total and ≥8C cycling polyploid TC (n = 7). s Percentage of β-galactosidase+ TC (n = 7). t Quantification of fibronectin deposition by digital morphometry (n = 7). t30: day 30 after nephrotoxic AKI. t4 recombination: doxycycline administered 4 days after nephrotoxic AKI. Senolytic treatment: quercetin+dasatinib. PAS: Periodic-acid schiff. Statistical significance was calculated by two-sided Mann-Whitney test; numbers on graphs represent exact p values. Data are expressed as mean ± SEM in graph a, k, and p. Box-and-whisker plots: line = median, box = 25–75%, whiskers = outlier (coef. 1.5).

References

    1. Kellum JA, et al. Acute kidney injury. Nat. Rev. Dis. Prim. 2021;7:52. doi: 10.1038/s41572-021-00284-z. - DOI - PubMed
    1. Romagnani P, et al. Chronic kidney disease. Nat. Rev. Dis. Prim. 2017;3:17088. doi: 10.1038/nrdp.2017.88. - DOI - PubMed
    1. Lewington AJ, Cerda J, Mehta RL. Raising awareness of acute kidney injury: a global perspective of a silent killer. Kidney Int. 2013;84:457–467. doi: 10.1038/ki.2013.153. - DOI - PMC - PubMed
    1. See EJ, et al. Long-term risk of adverse outcomes after acute kidney injury: a systematic review and meta-analysis of cohort studies using consensus definitions of exposure. Kidney Int. 2019;95:160–172. doi: 10.1016/j.kint.2018.08.036. - DOI - PubMed
    1. Noble RA, Lucas BJ, Selby NM. Long-term outcomes in patients with acute kidney injury. Clin. J. Am. Soc. Nephrol. 2020;15:423–429. doi: 10.2215/CJN.10410919. - DOI - PMC - PubMed

Publication types