. 2022 Oct 4;13(1):5866.
doi: 10.1038/s41467-022-33502-7.

Multicellular immune dynamics implicate PIM1 as a potential therapeutic target for uveitis

Affiliations

Multicellular immune dynamics implicate PIM1 as a potential therapeutic target for uveitis

He Li et al. Nat Commun. .

Abstract

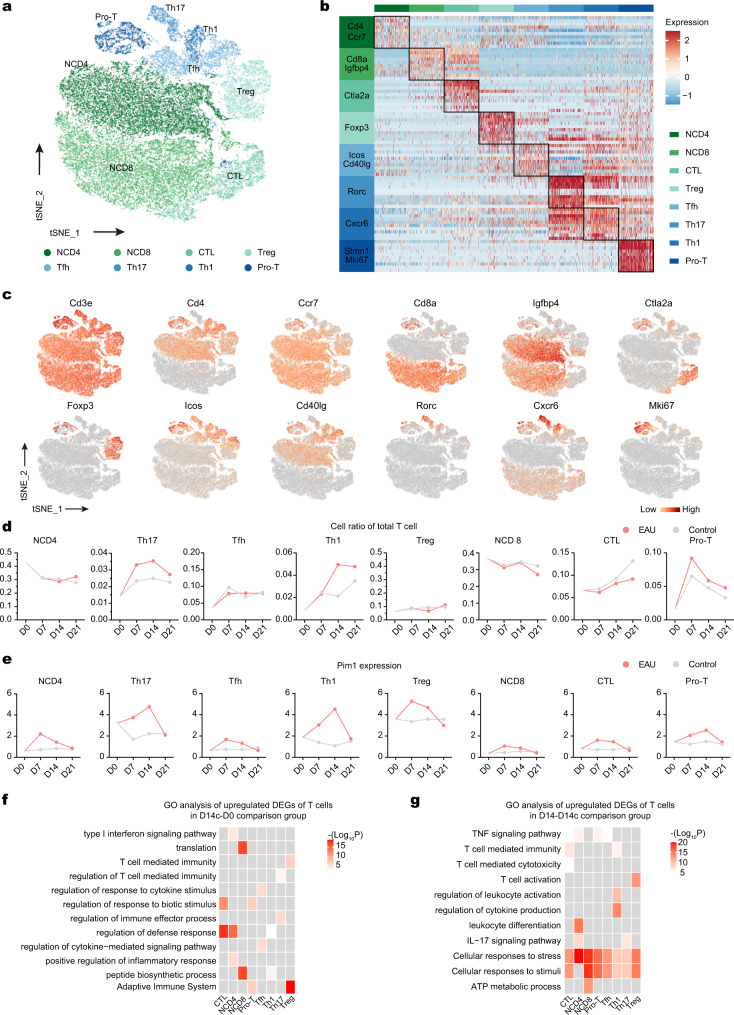
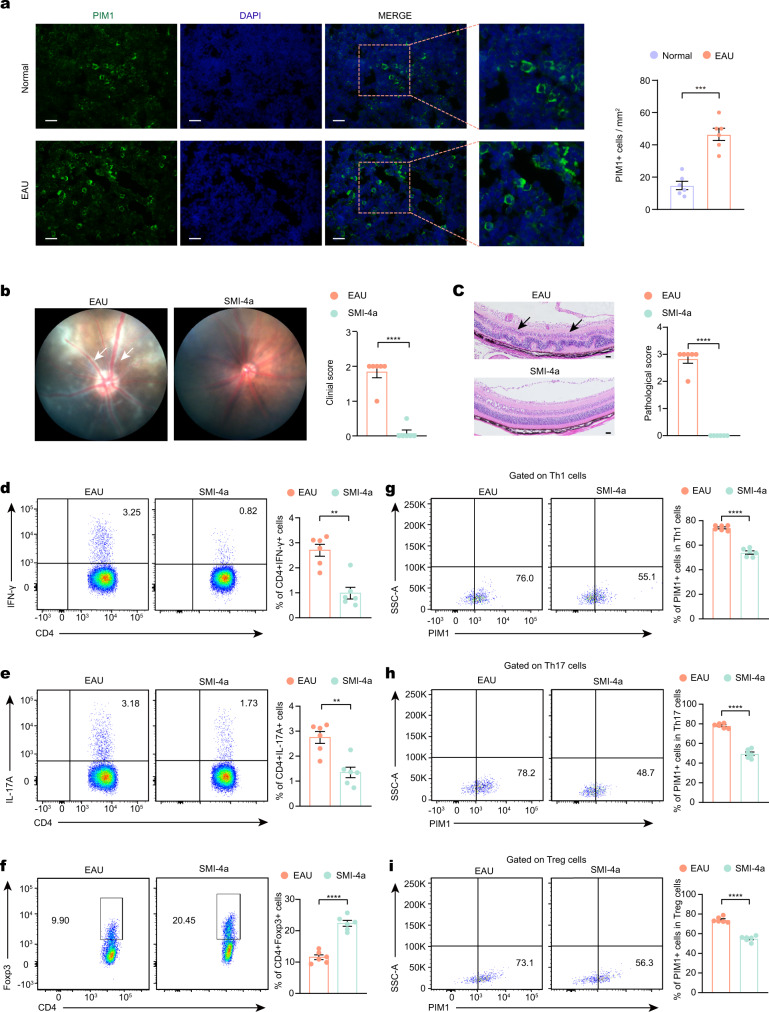
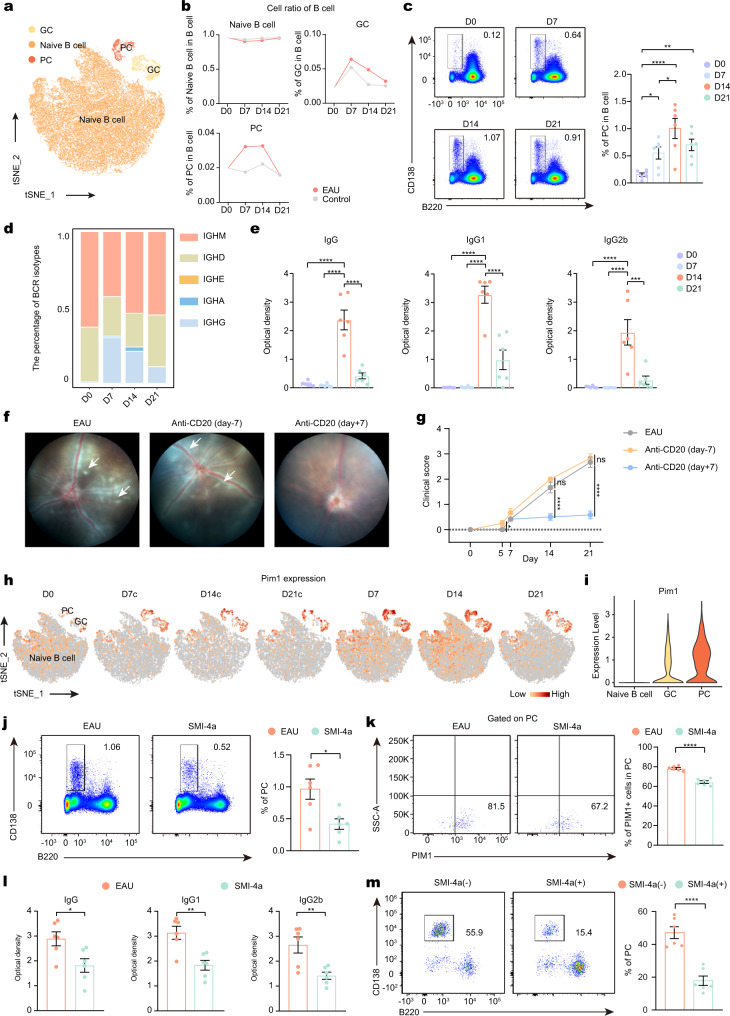
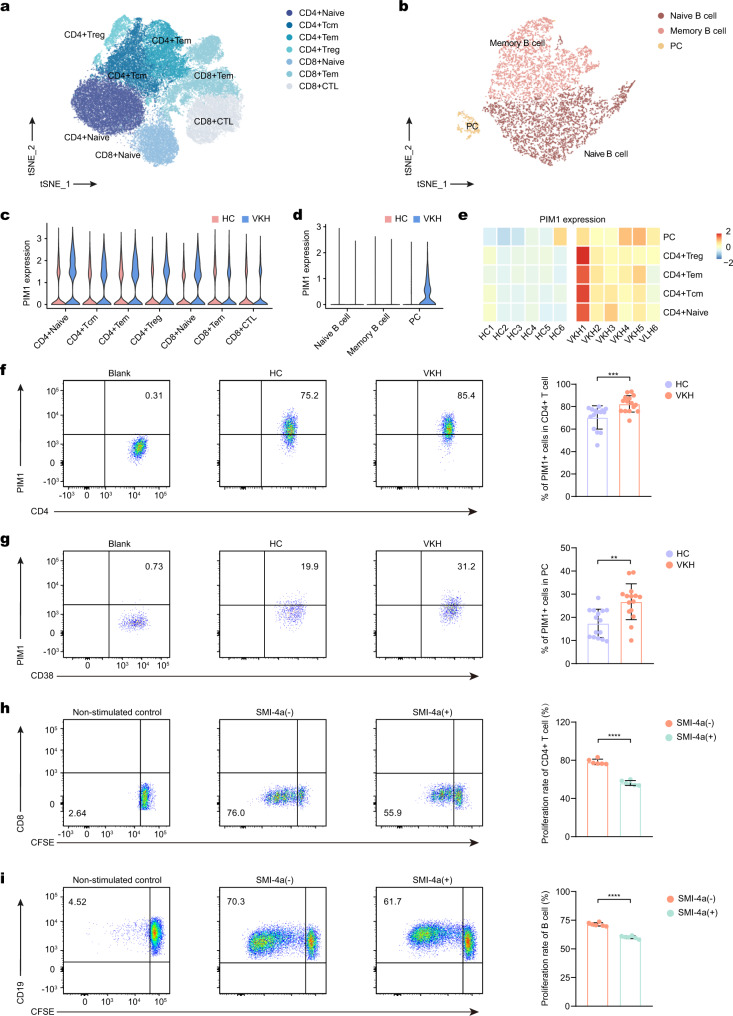
Uveitis is a severe autoimmune disease, and a common cause of blindness; however, its individual cellular dynamics and pathogenic mechanism remain poorly understood. Herein, by performing single-cell RNA sequencing (scRNA-seq) on experimental autoimmune uveitis (EAU), we identify disease-associated alterations in cell composition and transcriptional regulation as the disease progressed, as well as a disease-related molecule, PIM1. Inhibiting PIM1 reduces the Th17 cell proportion and increases the Treg cell proportion, likely due to regulation of PIM1 to the protein kinase B (AKT)/Forkhead box O1 (FOXO1) pathway. Moreover, inhibiting PIM1 reduces Th17 cell pathogenicity and reduces plasma cell differentiation. Importantly, the upregulation of PIM1 in CD4+ T cells and plasma cells is conserved in a human uveitis, Vogt-Koyanagi-Harada disease (VKH), and inhibition of PIM1 reduces CD4+ T and B cell expansion. Collectively, a dynamic immune cellular atlas during uveitis is developed and implicate that PIM1 may be a potential therapeutic target for VKH.


Conflict of interest statement

The authors declare no competing interests.

Figures

Fig. 1
Fig. 1. Study design and scRNA-seq analysis of EAU in multiple time points.
a Schematic of the experimental design for single-cell RNA sequencing analysis. CDLN cells were harvested from control groups or EAU groups at different time points. Day 0 group (D0) and each EAU groups (D7, D14, D21) included two samples, while each control group (D7c, D14c, D21c) include one sample. Each sample included three mice. b t-Distributed stochastic neighbor embedding (t-SNE) clustering of CDLN cells from all mice groups. c Heatmap showing scaled expression of discriminative gene sets for major immune cell types in CDLNs from all mice groups. d Pie charts and line charts showing the percentages of the major immune cell types in control or EAU groups at different time points. e Volcano plot showing upregulated and downregulated DEGs of total immune cells in the EAU/control comparison groups at different time points. Red and blue dots indicate upregulated and downregulated DEGs in EAU groups compared to control groups, respectively. Significance was determined using “FindMarkers” functions of Seurat package with Wilcoxon Rank Sum test and adjusted by Bonferroni correction. f Heatmap showing representative GO terms and KEGG pathways enriched in upregulated DEGs of total immune cells in the control/day 0 comparison groups and EAU/control comparison groups at different time points. Significance was calculated based on the accumulative hypergeometric distribution by Metascape webtool. g Venn diagrams showing the number of upregulated DEGs in EAU groups compared to control groups without those in control groups compared to day 0 group at different time points. h Heatmap of the relative expression of the ten DEGs annotated in (G) in control and EAU groups at different time points.
Fig. 2
Fig. 2. scRNA-seq analysis of the dynamic changes in T cell subsets.
a t-SNE plots of T cell subsets from all mice groups. b Heatmap showing scaled expression of discriminative gene sets for T cell subsets from all mice groups. c t-SNE plots of canonical markers for T cell subsets from all mice groups. d Line charts showing the proportion of T cell subsets in total T cells from EAU and control groups at different time points. e Line charts showing the mean expression of Pim1 in T cell subsets from EAU and control groups at different time points. f Heatmap showing representative GO terms and KEGG pathways enriched in upregulated DEGs of the T cell subsets in the D14c/D0 comparison groups at different time points. Significance was calculated based on the accumulative hypergeometric distribution by Metascape webtool. g Heatmap showing representative GO terms and KEGG pathways enriched in upregulated DEGs of the T cell subsets in the D14/D14c comparison groups at different time points. Significance was calculated based on the accumulative hypergeometric distribution by Metascape webtool.
Fig. 3
Fig. 3. Inhibiting PIM1 alleviated EAU.
a Immunostaining of cross-sections of CDLNs from day 0 group and day 14 EAU group shows PIM1 (green) and nuclei (4′,6-diamidino-2-phenylindole [DAPI]; blue). Each group contains six mice. P(EAU-Normal) = 0.0003. Data represented as mean ± SEM. Significance was determined using unpaired two-tailed student’s t test. ***P < 0.001. Scale bars, 20 mm. b Representative fundus images and clinical scores of eyes from the vehicle group and SMI-4a group after immunization at day 14. White arrowheads indicate inflammatory exudation and vascular deformation. Each group contains six mice. P(EAU-SMI-4a) = 2.8E-06. Data represented as mean ± SEM. Significance was determined using unpaired two-tailed student’s t test. ****P < 0.0001. c Representative histopathological images (hematoxylin and eosin staining) and pathological scores of eyes from the vehicle group and SMI-4a group after immunization at day 14. Black arrowheads indicate infiltration of inflammatory cells and retinal folding. Each group contains six mice. P(EAU-SMI-4a) = 1.0E-08. Data expressed as mean ± SEM. Significance was determined using unpaired two-tailed student’s t test. ****P < 0.0001. Scale bars, 20 mm. df Proportions of Th1 cells (d), Th17 cells (e) and regulatory T cells (Treg) (f) were measured by flow cytometry after immunization at day 14. Each group contains six mice. P(Th1) = 0.0005, P(Th7) = 0.0014, P(Treg) = 3.8E-06. Data expressed as mean ± SEM. Significance was determined using unpaired two-tailed student’s t test. *P < 0.05, **P < 0.01, ****P < 0.0001. gi Proportions of PIM+ cells in Th1 cells (g), Th17 cells (h) and regulatory T cells (Treg) (i) were measured by flow cytometry after immunization at day 14. Each group contains six mice. P(Th1) = 1.8E-07, P(Th7) = 7.4E-08, P(Treg) = 3.5E-07. Data expressed as mean ± SEM. Significance was determined using unpaired two-tailed student’s t test. ****P < 0.0001.
Fig. 4
Fig. 4. Pim1 regulated the balance of Th17/Treg cell.
ac CDLN cells from EAU mice were cultured with IRBP1-20 or IRBP1-20 plus SMI-4a (20 μM). Flow cytometry was performed to show the proportion of Th1 cells (a), Th17 cells (b) and Treg cells (c). Each group contains six mice. P(Th1) = 9.3E-09, P(Th7) = 0.0030, P(Treg) = 0.0040. Data expressed as mean ± SEM. Significance was determined using unpaired two-tailed student’s t test. **P < 0.01. d, e Representative fundus images (d) and clinical score (e) after induction of CD4+ T cells cultured with IRBP1-20 or IRBP1-20 plus SMI-4a at day 14. White arrowheads indicate inflammatory exudation and vascular deformation. Each group contains six mice. P(EAU-SMI-4a) = 3.8E-05. Data expressed as mean ± SEM. Significance was determined using unpaired two-tailed student’s t test. ****P < 0.0001. f, g Representative fundus images (f) and clinical score (g) after induction of Pim1 shRNA treated-CD4+ T cells cultured with IRBP1-20 at day 14. Each group contains six mice. P(CD4-CD4 + Nc shRNA) = 0.9552, P(CD4-CD4 + pim1 shRNA) = 0.0002, P(CD4 + Nc shRNA- CD4 + pim1 shRNA) = 0.0003. Data expressed as mean ± SEM. Significance was determined using one-way ANOVA. ns no significant differences, ***P < 0.001. hj CD4 T cells from EAU group cultured with IRBP1-20 alone or with IRBP1-20 plus with SMI-4a for 72 h. Flow cytometry showed the proportion of PIM1+ cells (h), pAKT+ cells (i), and pFOXO1+ cells (j) in total CD4+-gated T cells. Data represented as mean ± SEM from six independent experiments. P(PIM1+ cells,Control-IRBP1-20) = 0.0208, P(PIM1+ cells, IRBP1-20-IRBP1-20+SMI-4a) = 8.2E-09, P(pAKT+ cells,Control-IRBP1-20) = 3.8E-12, P(pAKT+ cells, IRBP1-20-IRBP1-20+SMI-4a) = 8.6E-10, P(pFOXO1+ cells cells,Control-IRBP1-20) = 4.4E-07, P(pFOXO1+ cells, IRBP1-20-IRBP1-20+SMI-4a) = 1.8E-06. Significance was determined using two-way ANOVA. **P < 0.01, ****P < 0.0001.
Fig. 5
Fig. 5. Depleting B cells ameliorated EAU and PIM1 regulated PCs differentiation.
a t-SNE plots of B cell subsets from all mice groups. b Proportion of B cell subsets. c Frequency of PCs. Each group contains six mice. P(D0-D7) = 0.0316, P(D0-D14) = 7.7E-05, P(D0-D21) = 0.0047, P(D7-D14) = 0.0157. Data represented as mean ± SEM. Significance was determined using one-way ANOVA. *P < 0.05, **P < 0.01, ****P < 0.0001. d Percentage of BCR isotype. e Concentration of IRBP1-20-specific antibodies. Each group contains six mice. P(IgG, D0-D14) = 1.8E-07, P(IgG, D7-D14) = 1.2E-07, P(IgG,D14-D21) = 1.4E-06, P(IgG1, D0-D14) = 1.6E-08, P(IgG1, D7-D14) = 1.7E-08, P(IgG1,D14-D21) = 4.1E-06, P(IgG2b, D0-D14) = 6.2E-05, P(IgG2b, D7-D14) = 5.1E-05, P(IgG2b,D14-D21) = 0.0003. Data represented as mean ± SEM. Significance was determined using one-way ANOVA. ***P < 0.001, ****P < 0.0001. f Administration of anti-CD20 antibodies to deplete the B cells before (7 days before immunization, day −7) and after EAU (7 days after immunization, day +7). Representative fundus images of eyes after immunization at day 14. White arrowheads indicate inflammatory exudation. g Clinical scores after immunization at day 14. Each group contains six mice. P(D5, EAU- Anti-CD20 (day-7)) = 0.0493, P(D14, EAU- Anti-CD20 (day-7)) = 0.2557, P(D14, EAU- Anti-CD20 (day + 7)) = 6.0E-06, P(D21, EAU- Anti-CD20 (day-7)) = 0.7900, P(D21, EAU- Anti-CD20 (day + 7)) = 1.7E-06. Data represented as mean ± SEM. Significance was determined using one-way ANOVA. ns, no significant differences, *P < 0.05, ****P < 0.0001. h t-SNE plots of Pim1 by B cell subsets. i Violin plots of Pim1 in B cell subsets from all mice groups. j Proportions of PCs after immunization at day 14. Each group contains six mice. P(EAU-SMI-4a) = 0.0114. Data expressed as mean ± SEM. Significance was determined using unpaired two-tailed student’s t test. *P < 0.05. k Proportions of PIM1+ cells in PCs after immunization at day 14. Each group contains six mice. P(EAU-SMI-4a) = 1.7E-06. Data expressed as mean ± SEM. Significance was determined using unpaired two-tailed student’s t test. ****P < 0.0001. l Concentration of IRBP1-20-specific antibodies. Each group contains six mice. P(IgG) = 0.0207, P(IgG1) = 0.0027, P(IgG2b) = 0.0058. Data expressed as mean ± SEM. Significance was determined using unpaired two-tailed student’s t test. *P < 0.05, **P < 0.01. m Proportion of PCs. Data represented as mean ± SEM from six independent experiments. P(SMI-4a (-)-SMI-4a (+)) = 8.4E-05. Significance was determined using unpaired two-tailed student’s t test. ****P < 0.0001.
Fig. 6
Fig. 6. Upregulation of PIM1 in VKH patients.
a t-SNE plots of T cell subsets from all healthy controls and VKH samples. b t-SNE plots of B cells subsets from all healthy controls and VKH samples. c Violin plots of PIM1 expression in T cell subsets of healthy controls and VKH patients. d Violin plots of PIM1 expression in B cell subsets of healthy controls and VKH patients. e Heatmap of the average expression of PIM1 by PCs and CD4 T cell subsets in healthy controls and VKH patients. f, g The percentage of PIM1+ cells in CD4 T cells (f) and PCs (g) measured by flow cytometry. Each group contains 15 samples. P(CD4 T cells, VKH-HC) = 0.0010, P(PCs, VKH-HC) = 0.0011. Data expressed as mean ± SEM. Significance was determined using unpaired two-tailed student’s t test. **P < 0.01, ***P < 0.001. h, i The proliferating rate of CD4 T cells (gated on CD3+CD8- T cells) (h) and B cells (i) measured by flow cytometry. P(CD4 T cells, SMI-4a (−)-SMI-4a (+)) = 6.4E-08, P(PCs, SMI-4a (−)-SMI-4a (+)) = 7.1E-08. Data represented as mean ± SEM from six independent experiments. Significance was determined using unpaired two-tailed student’s t test. ****P < 0.0001.

References

    1. Wildner G, Diedrichs-Möhring M. Resolution of uveitis. Semin Immunopathol. 2019;41:727–736. doi: 10.1007/s00281-019-00758-z. - DOI - PubMed
    1. Zeboulon N, Dougados M, Gossec L. Prevalence and characteristics of uveitis in the spondyloarthropathies: a systematic literature review. Ann. Rheum. Dis. 2008;67:955–959. doi: 10.1136/ard.2007.075754. - DOI - PubMed
    1. Muldoon LL, et al. Immunologic privilege in the central nervous system and the blood-brain barrier. J. Cereb. Blood Flow. Metab. 2013;33:13–21. doi: 10.1038/jcbfm.2012.153. - DOI - PMC - PubMed
    1. Chong WP, et al. IL-27p28 inhibits central nervous system autoimmunity by concurrently antagonizing Th1 and Th17 responses. J. Autoimmun. 2014;50:12–22. doi: 10.1016/j.jaut.2013.08.003. - DOI - PMC - PubMed
    1. Rosenbaum JT, et al. New observations and emerging ideas in diagnosis and management of non-infectious uveitis: A review. Semin Arthritis Rheum. 2019;49:438–445. doi: 10.1016/j.semarthrit.2019.06.004. - DOI - PubMed

Publication types

MeSH terms

Substances