. 2022 Oct;54(10):1504-1513.
doi: 10.1038/s41588-022-01188-8. Epub 2022 Oct 4.

Long-range phasing of dynamic, tissue-specific and allele-specific regulatory elements

Affiliations

Long-range phasing of dynamic, tissue-specific and allele-specific regulatory elements

Sofia Battaglia et al. Nat Genet. 2022 Oct.

Abstract

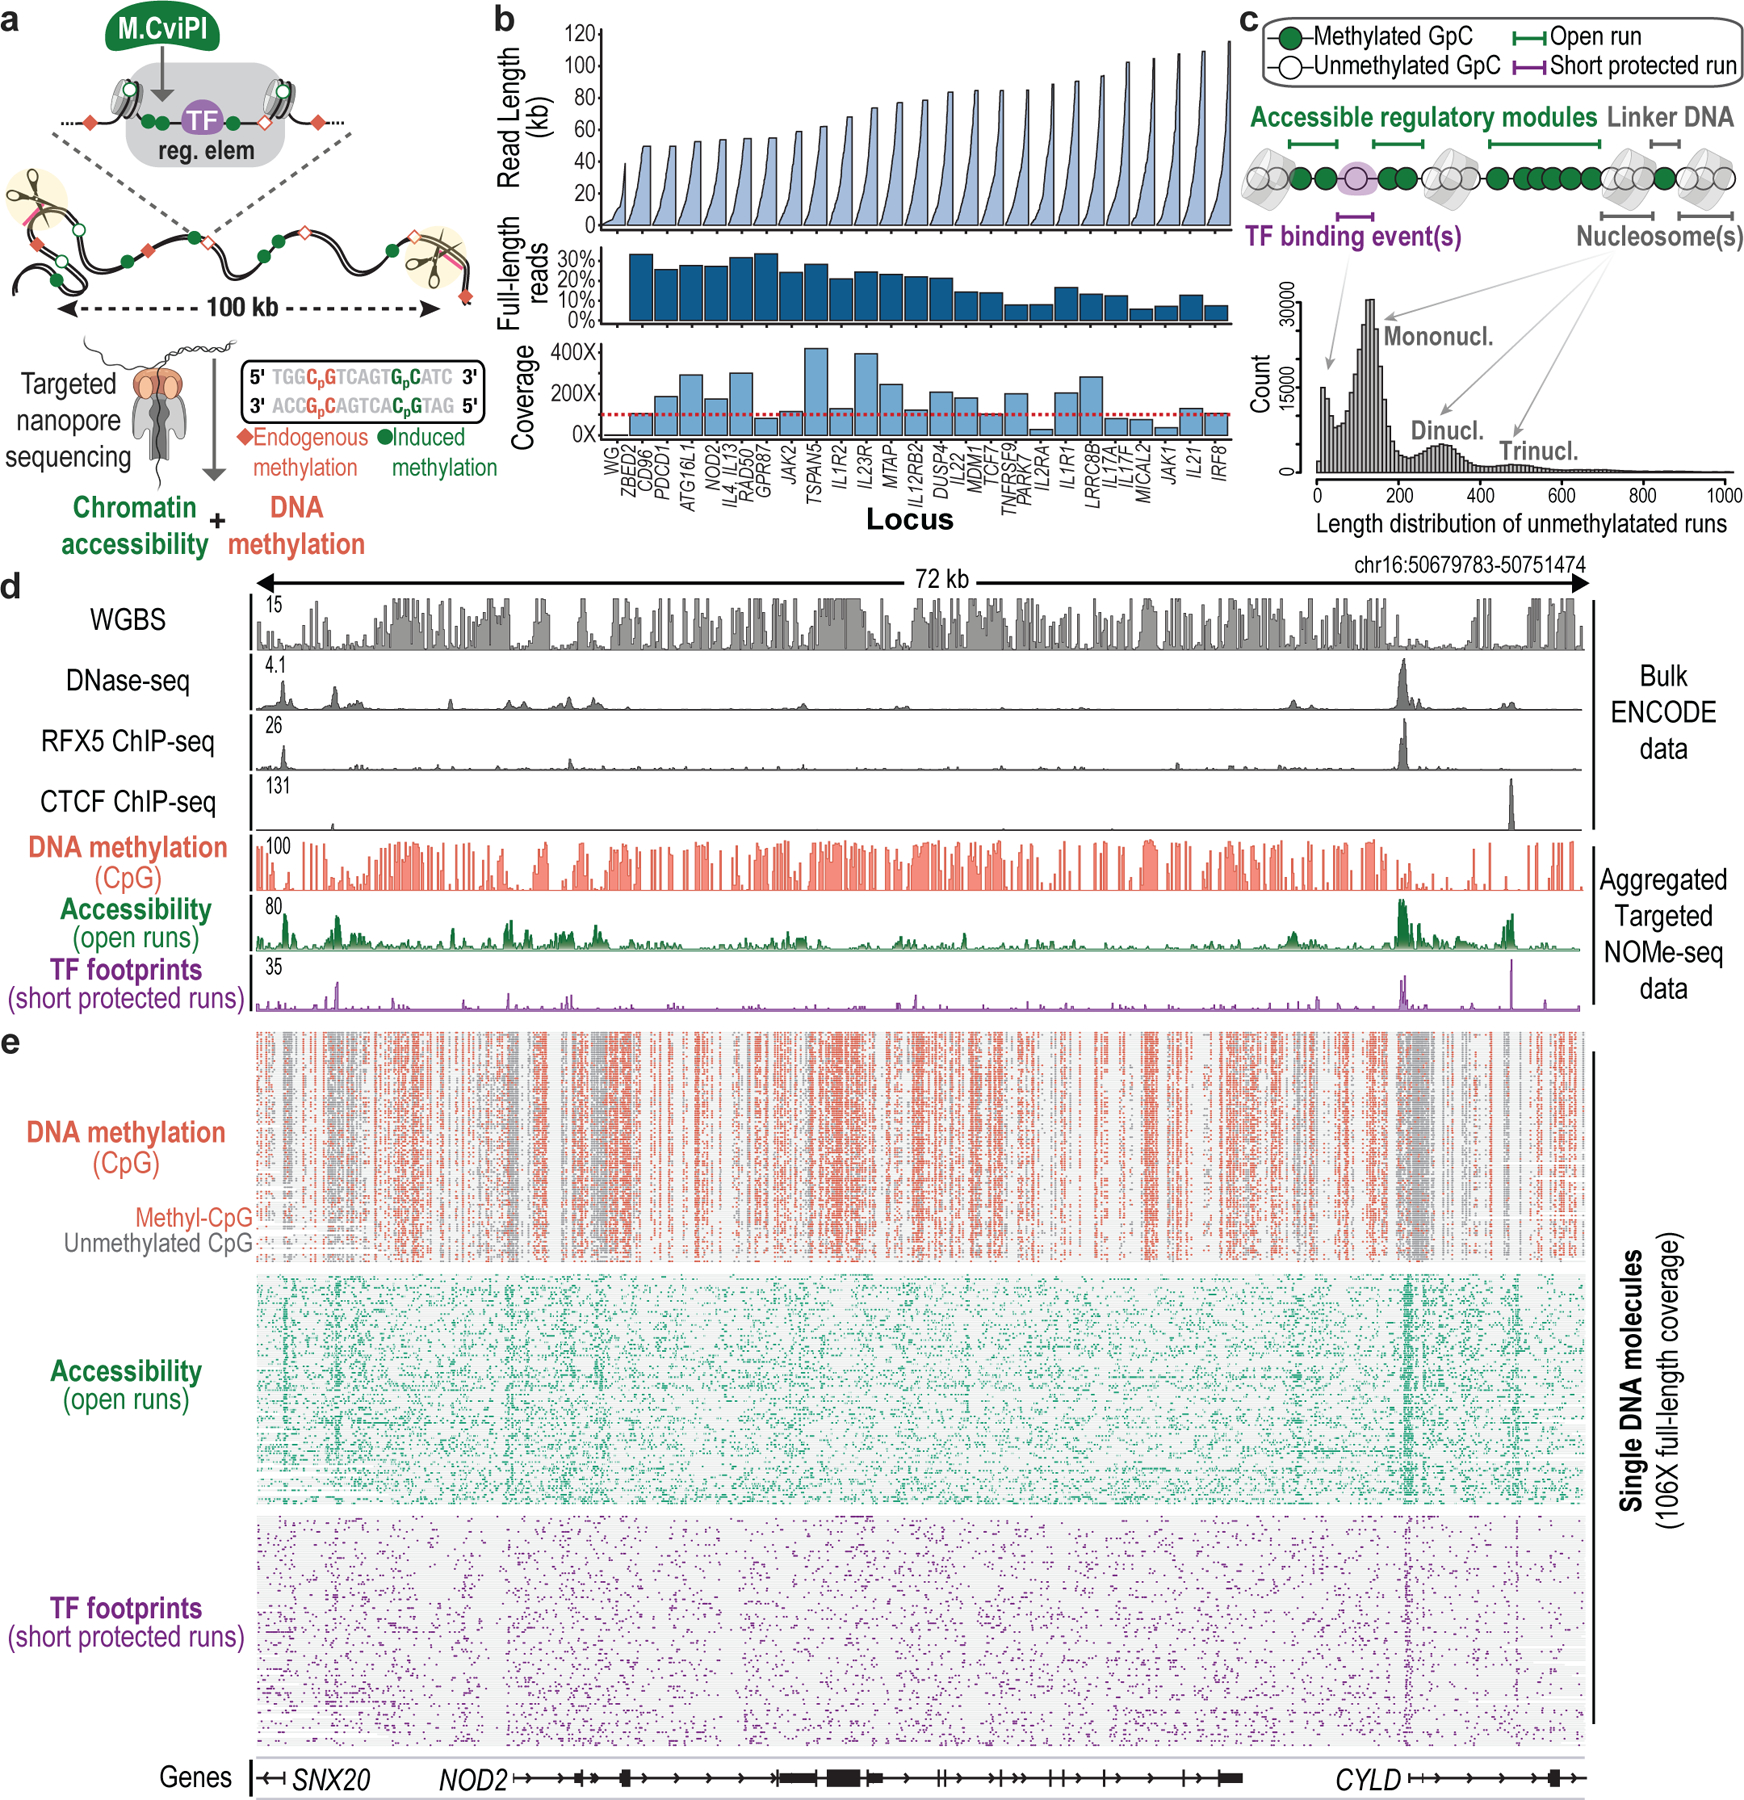
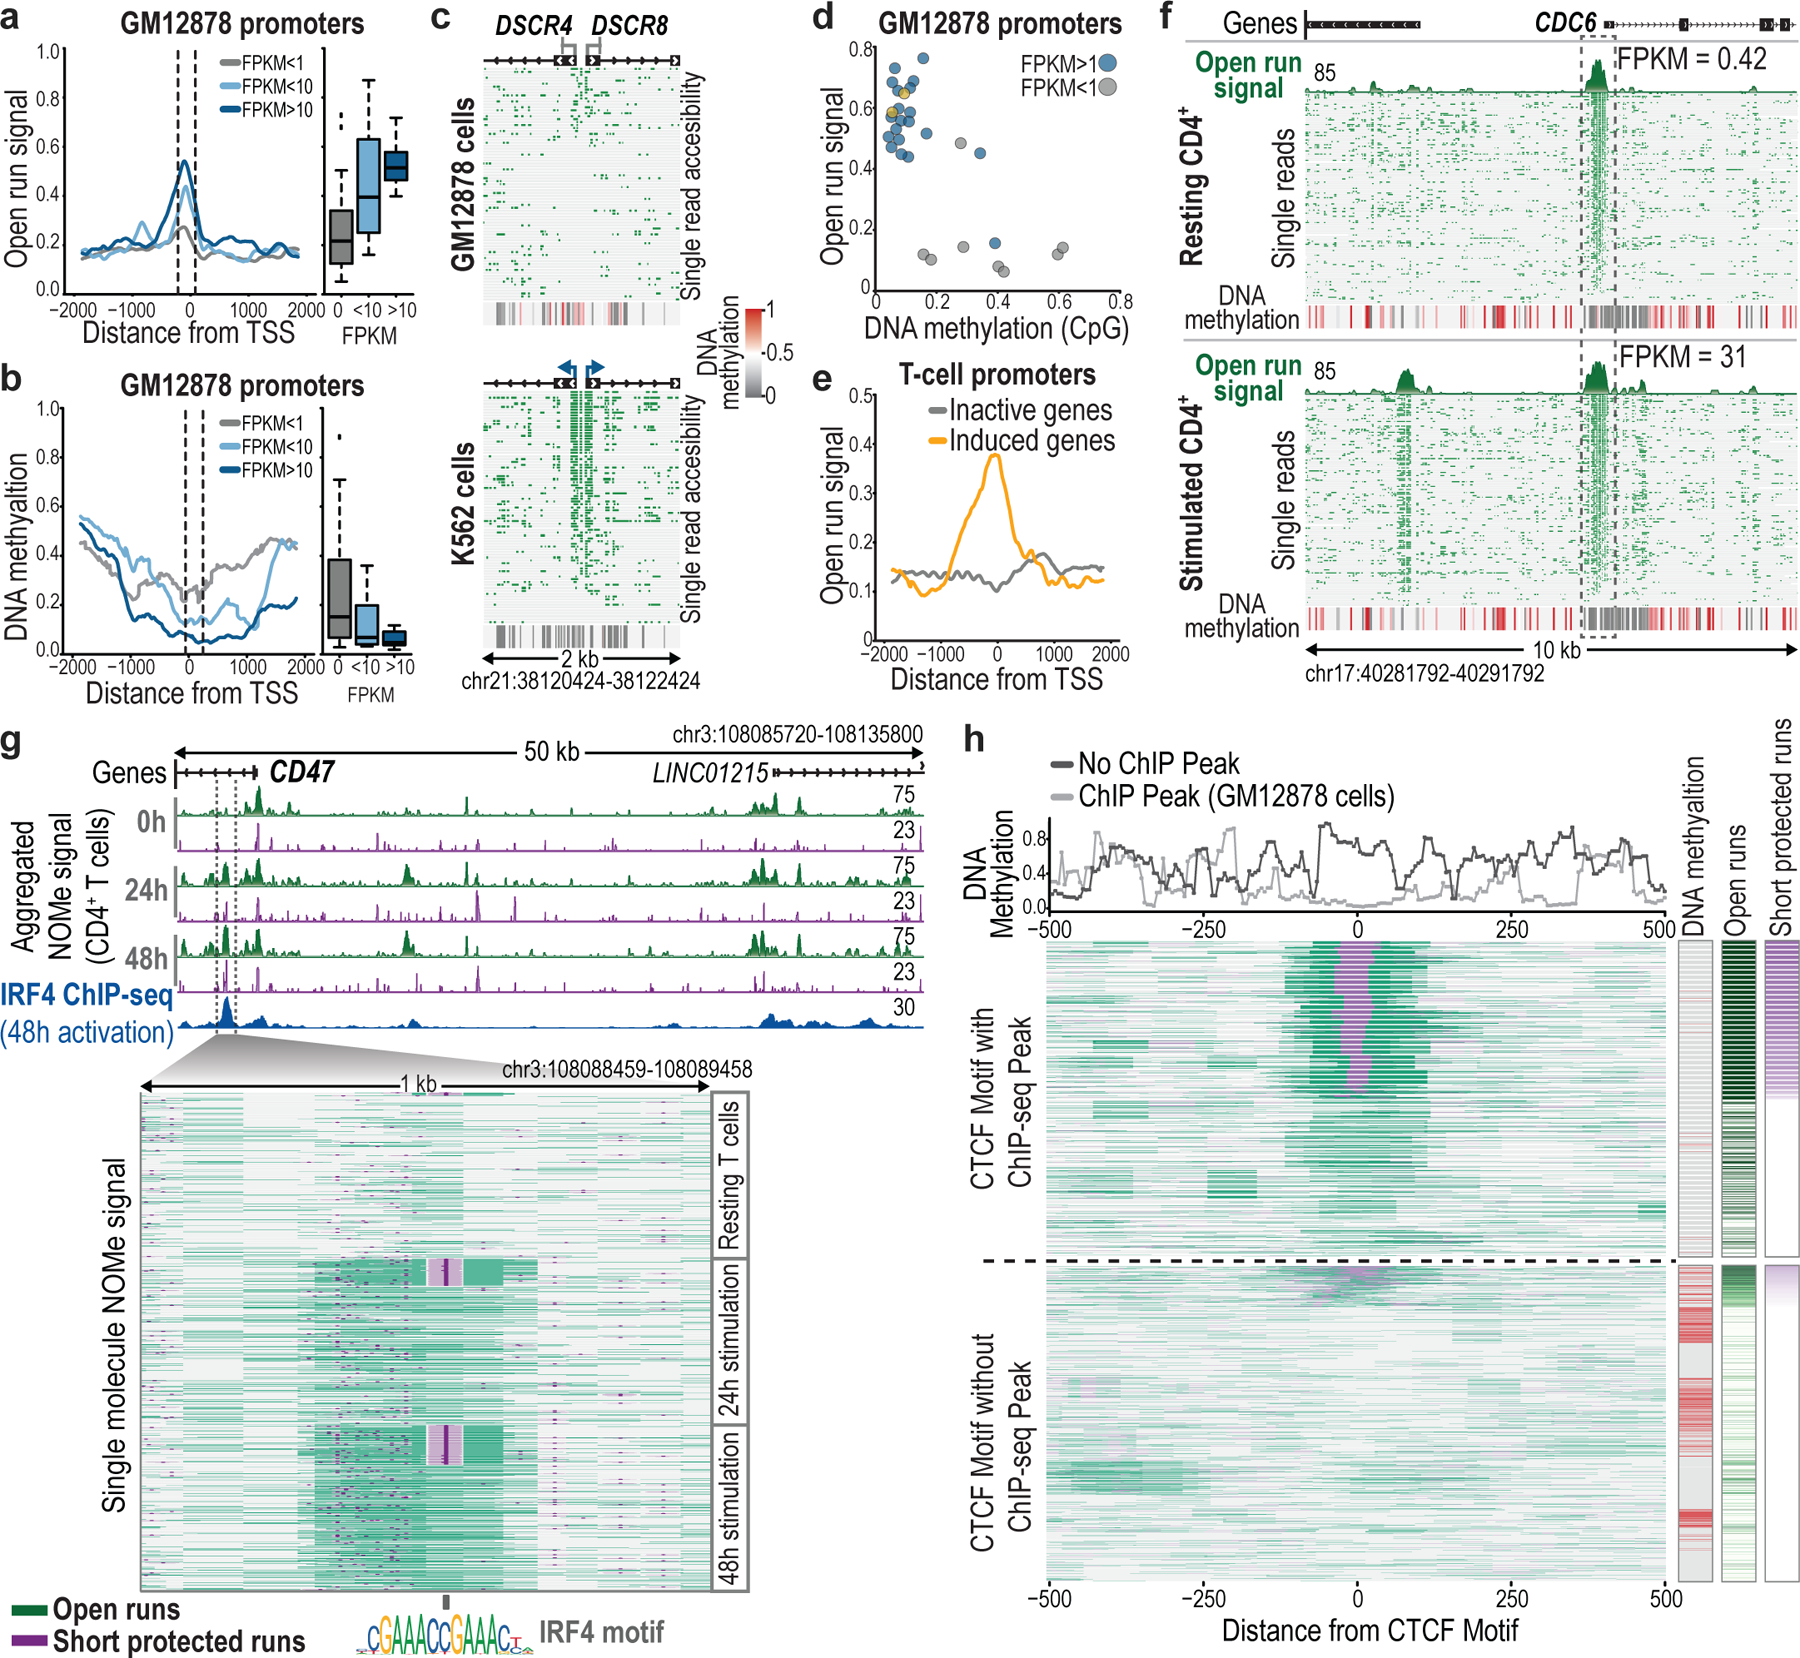
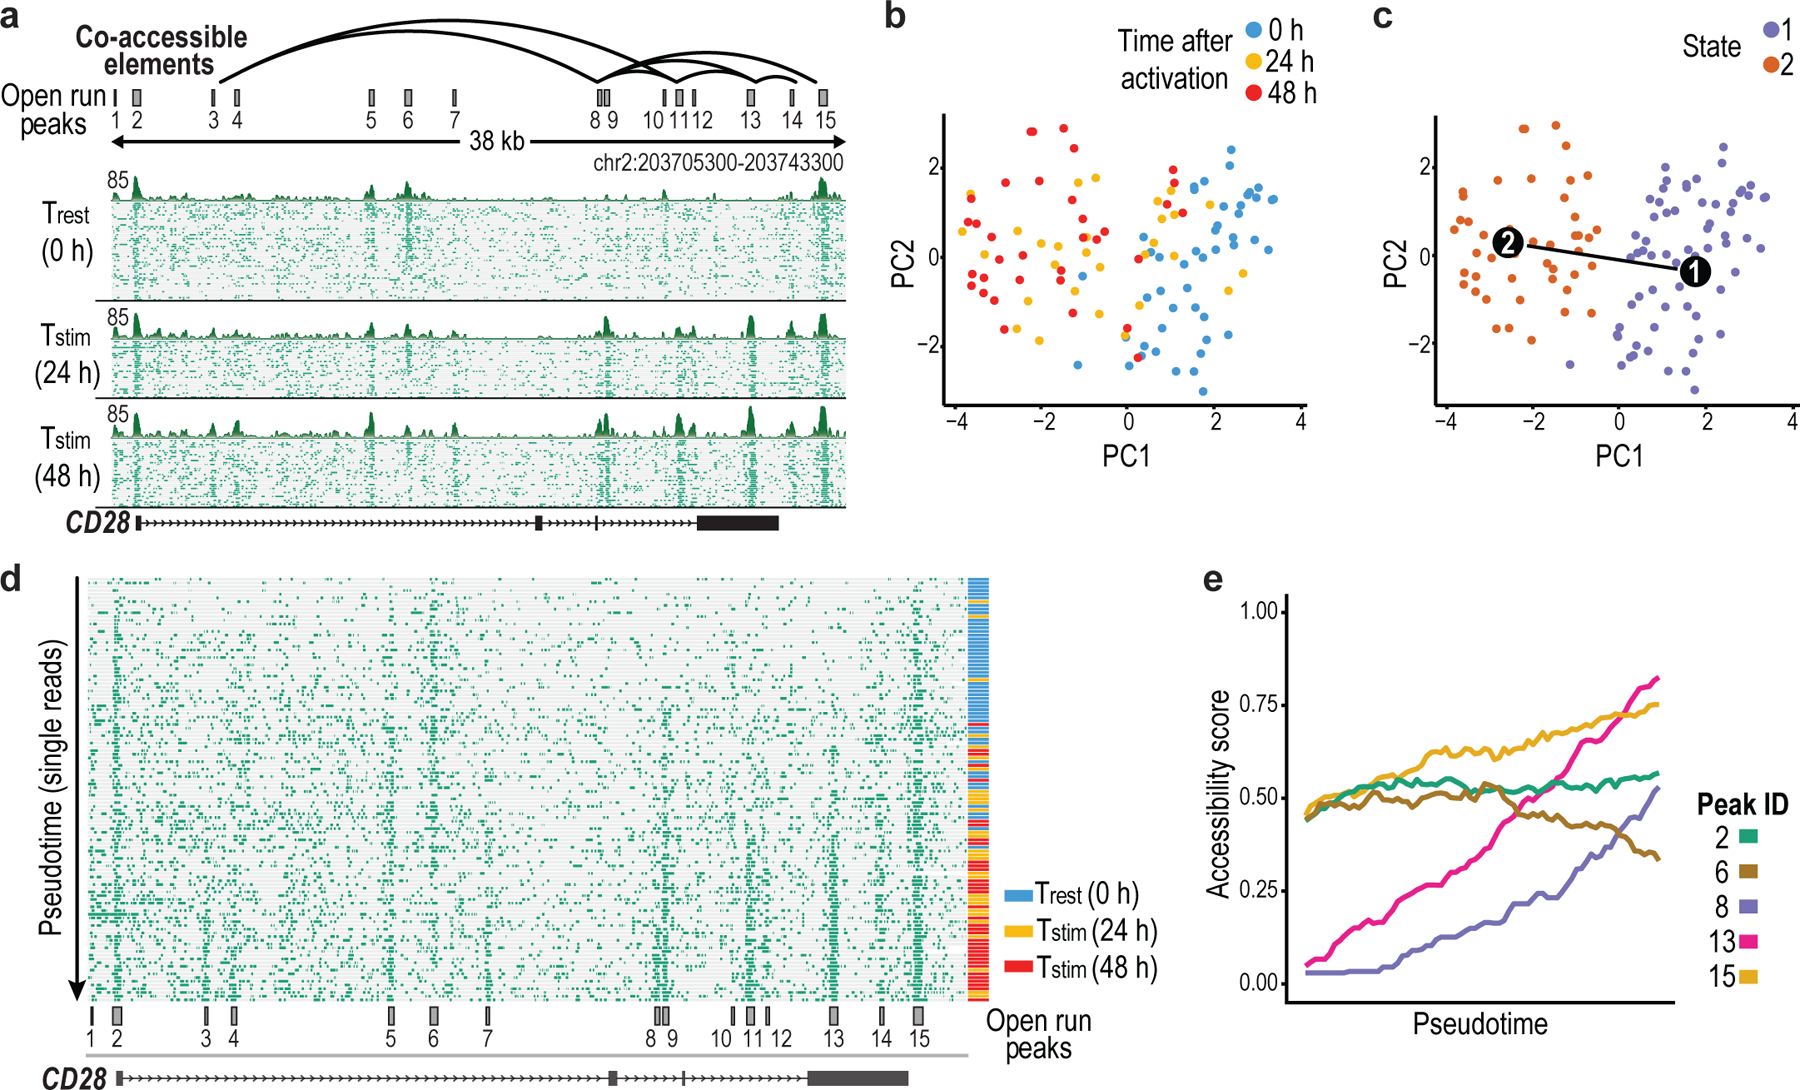
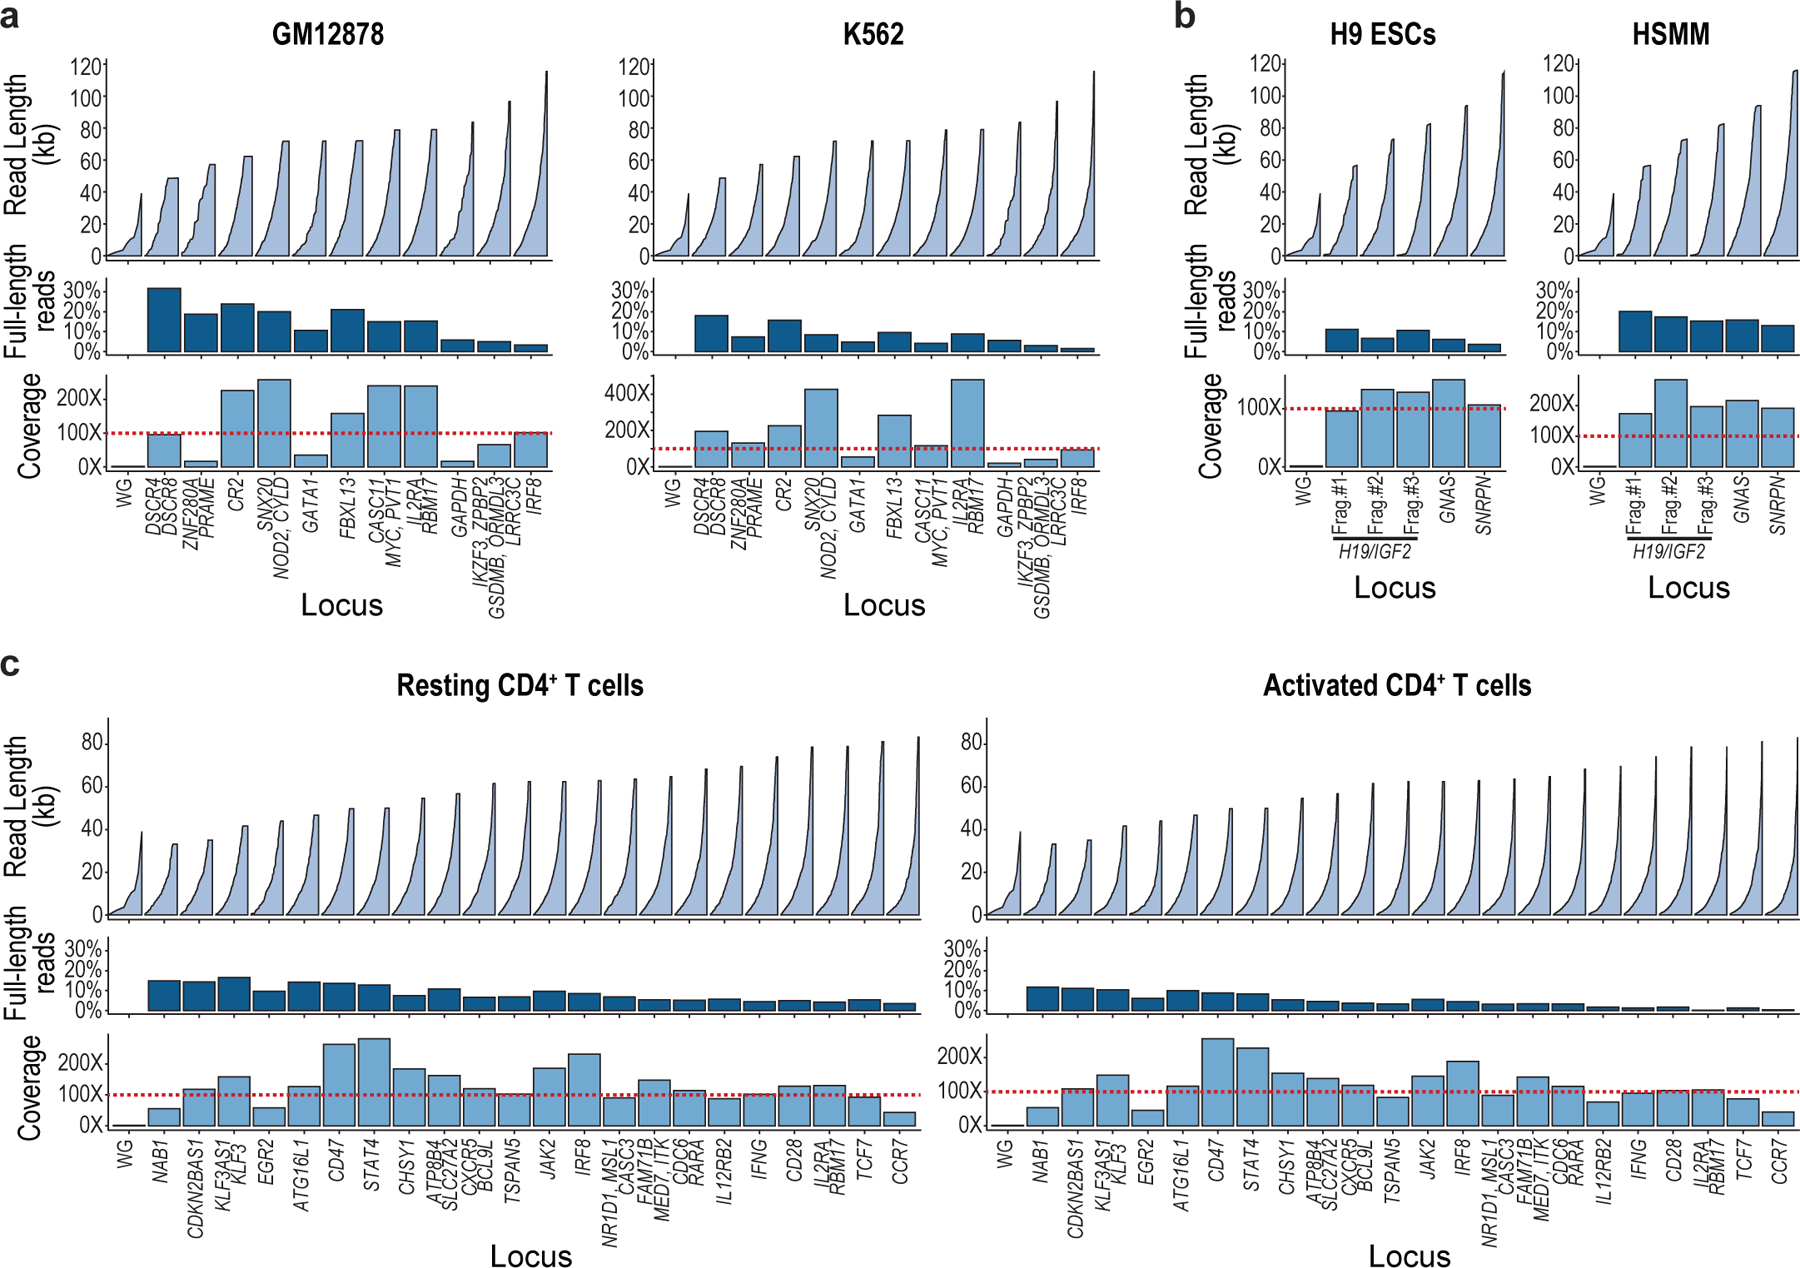
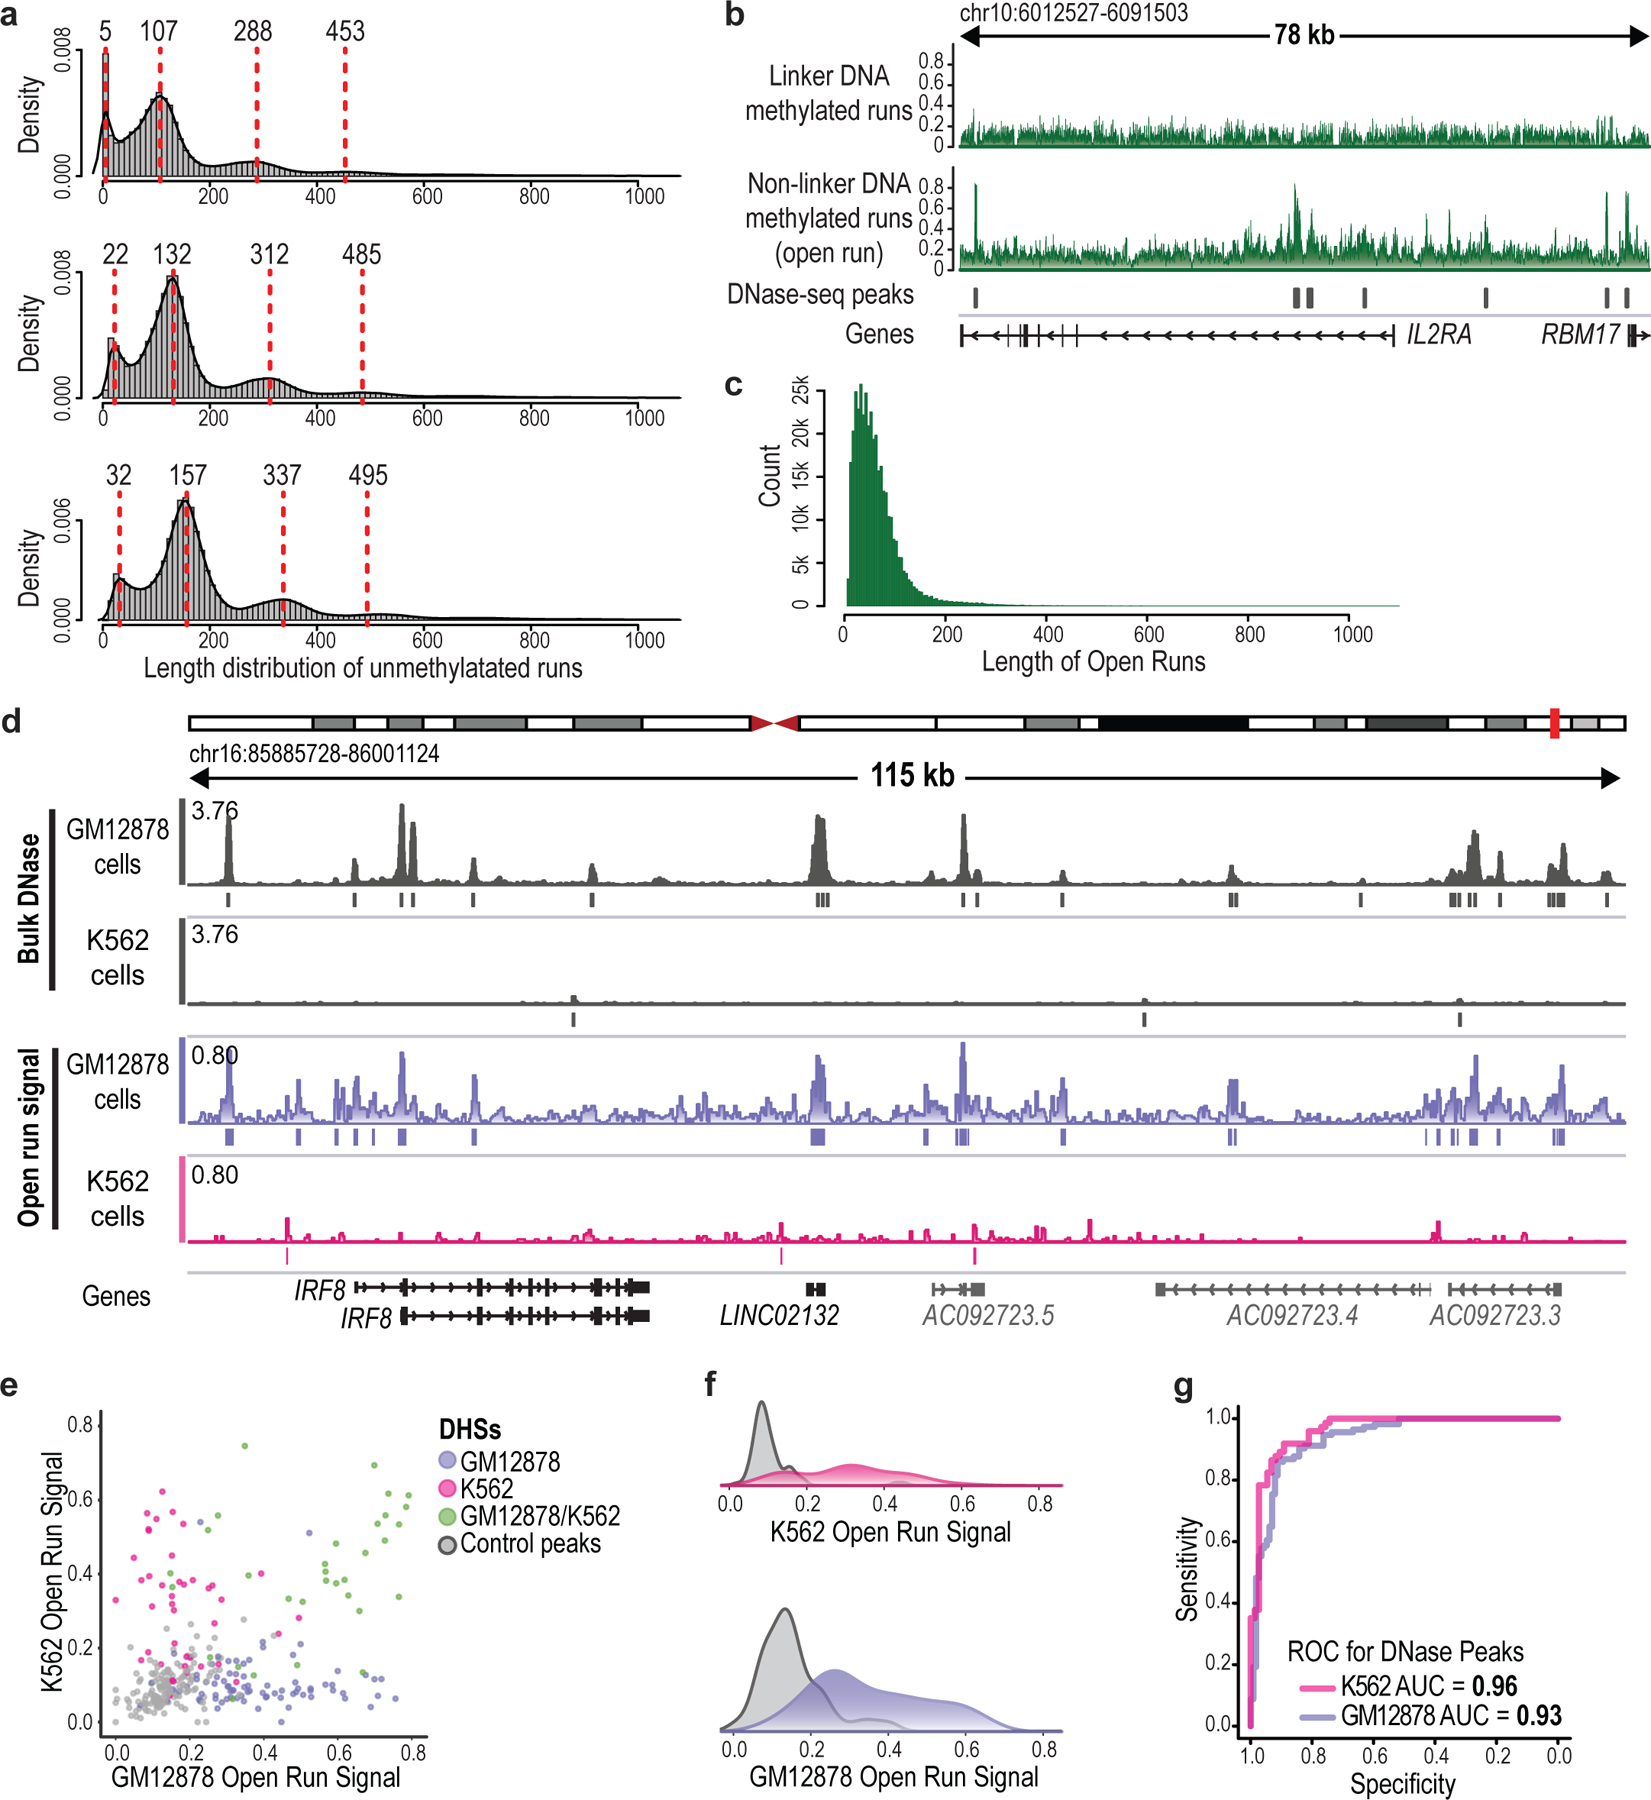
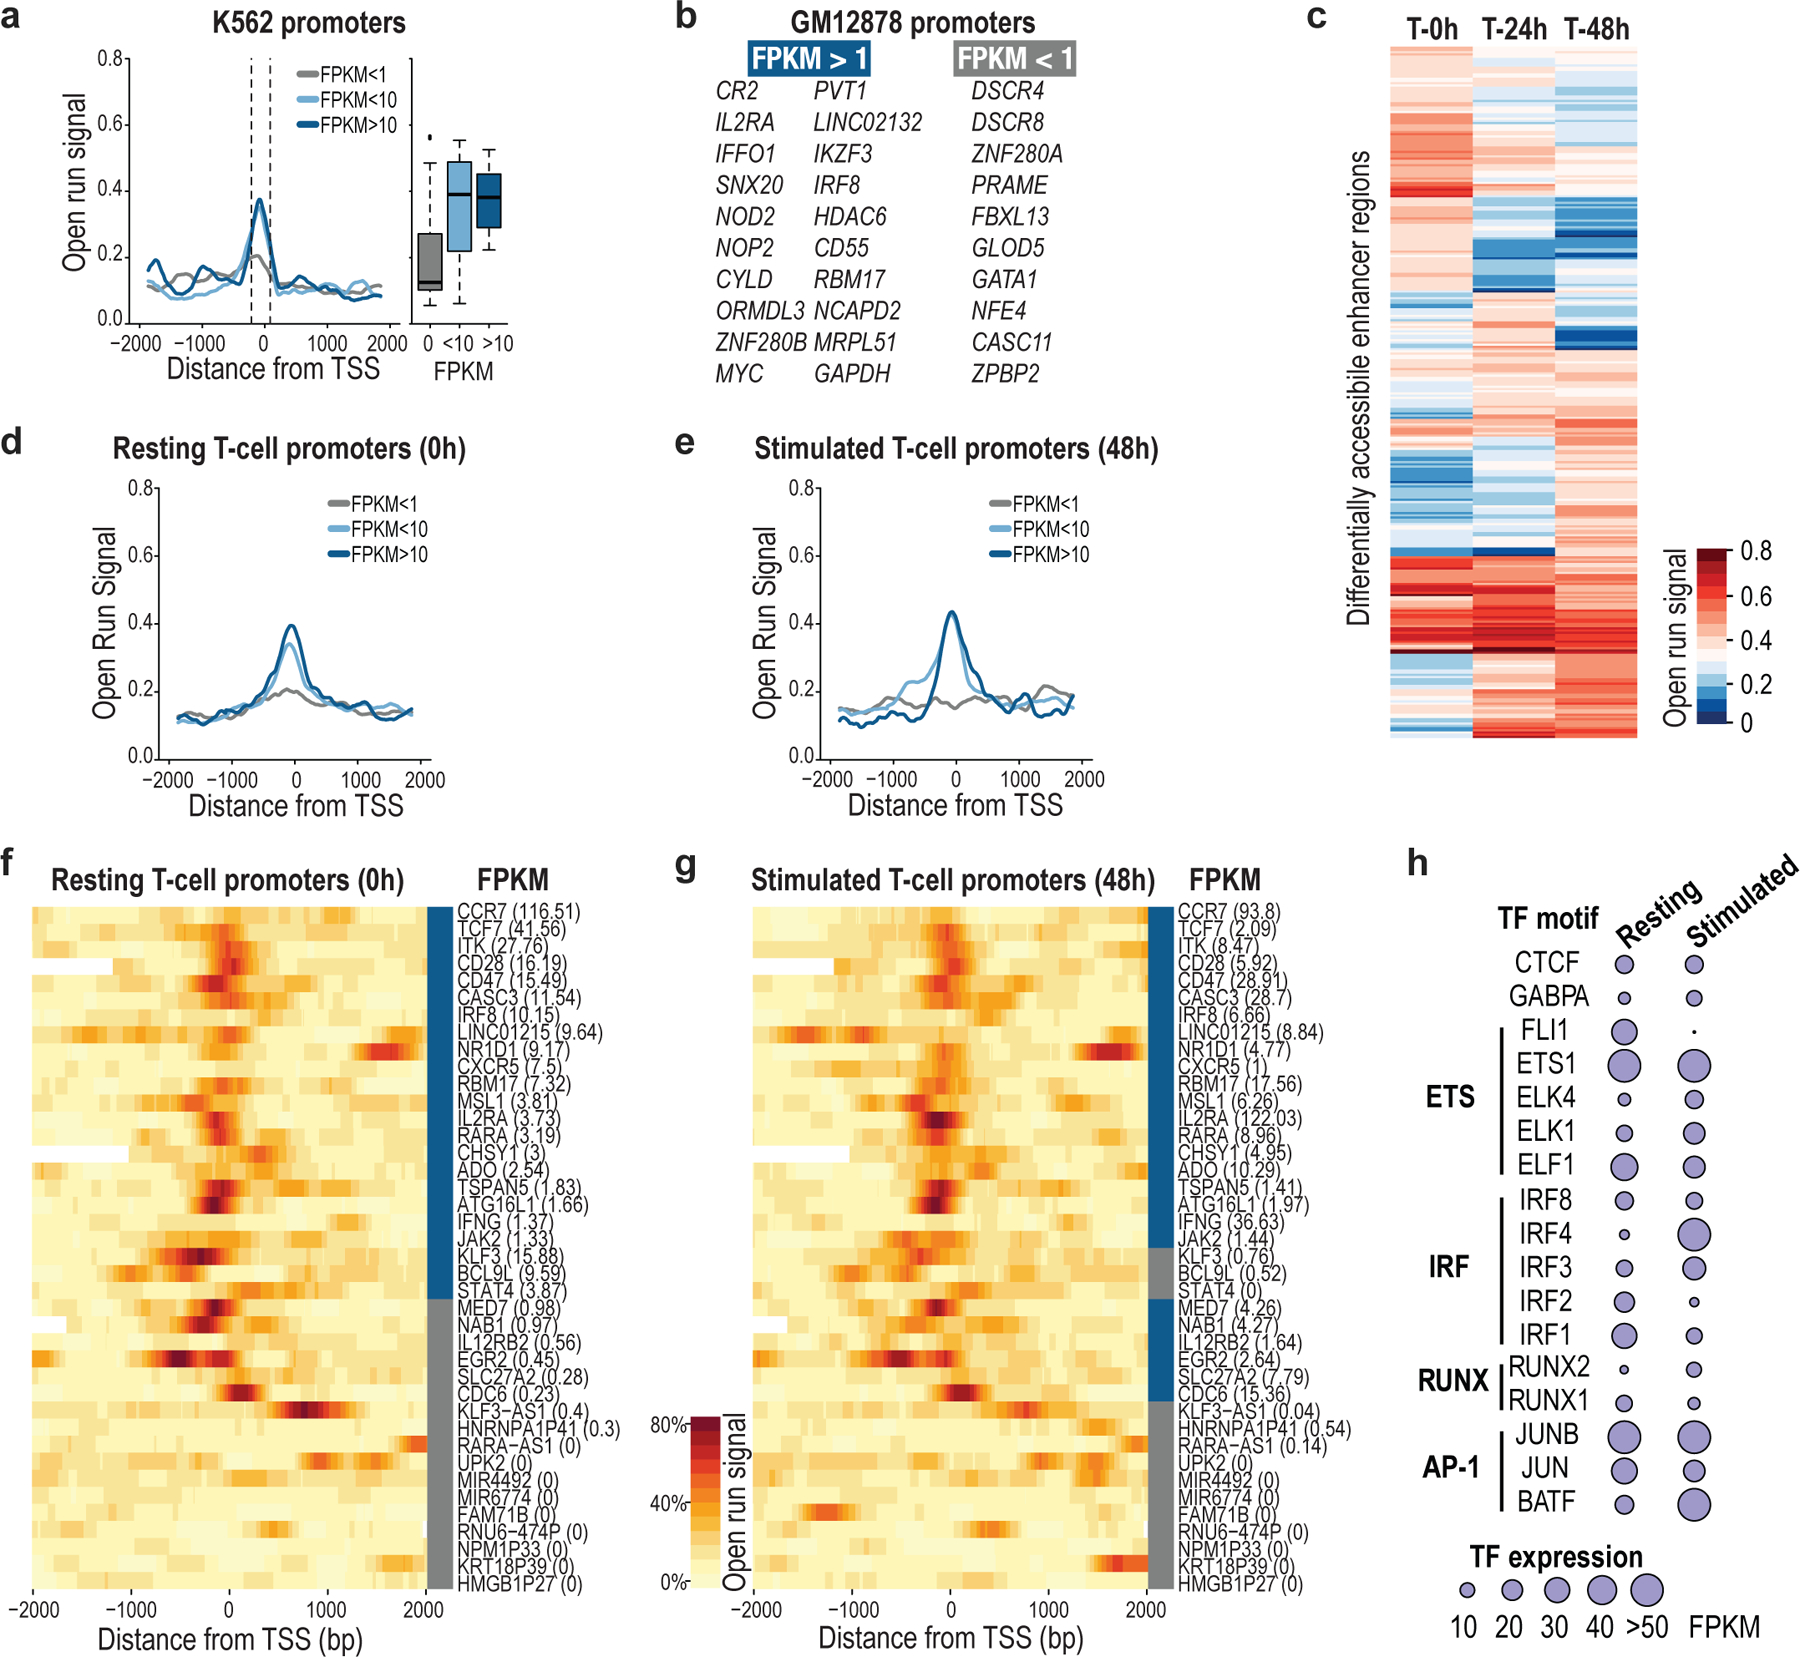
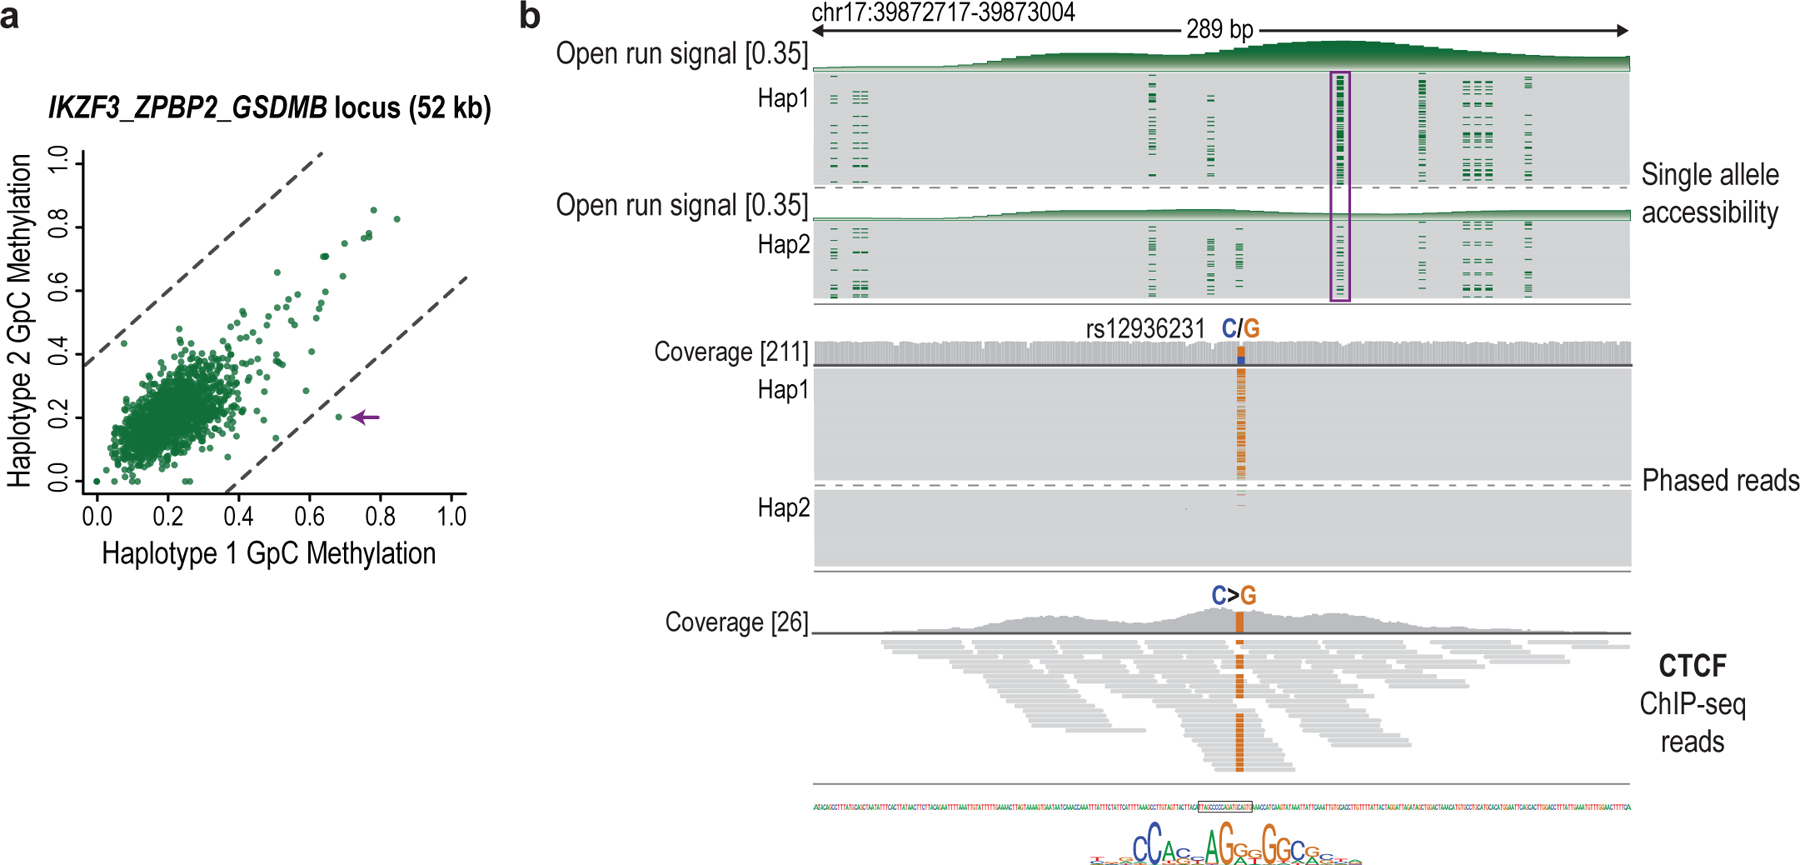
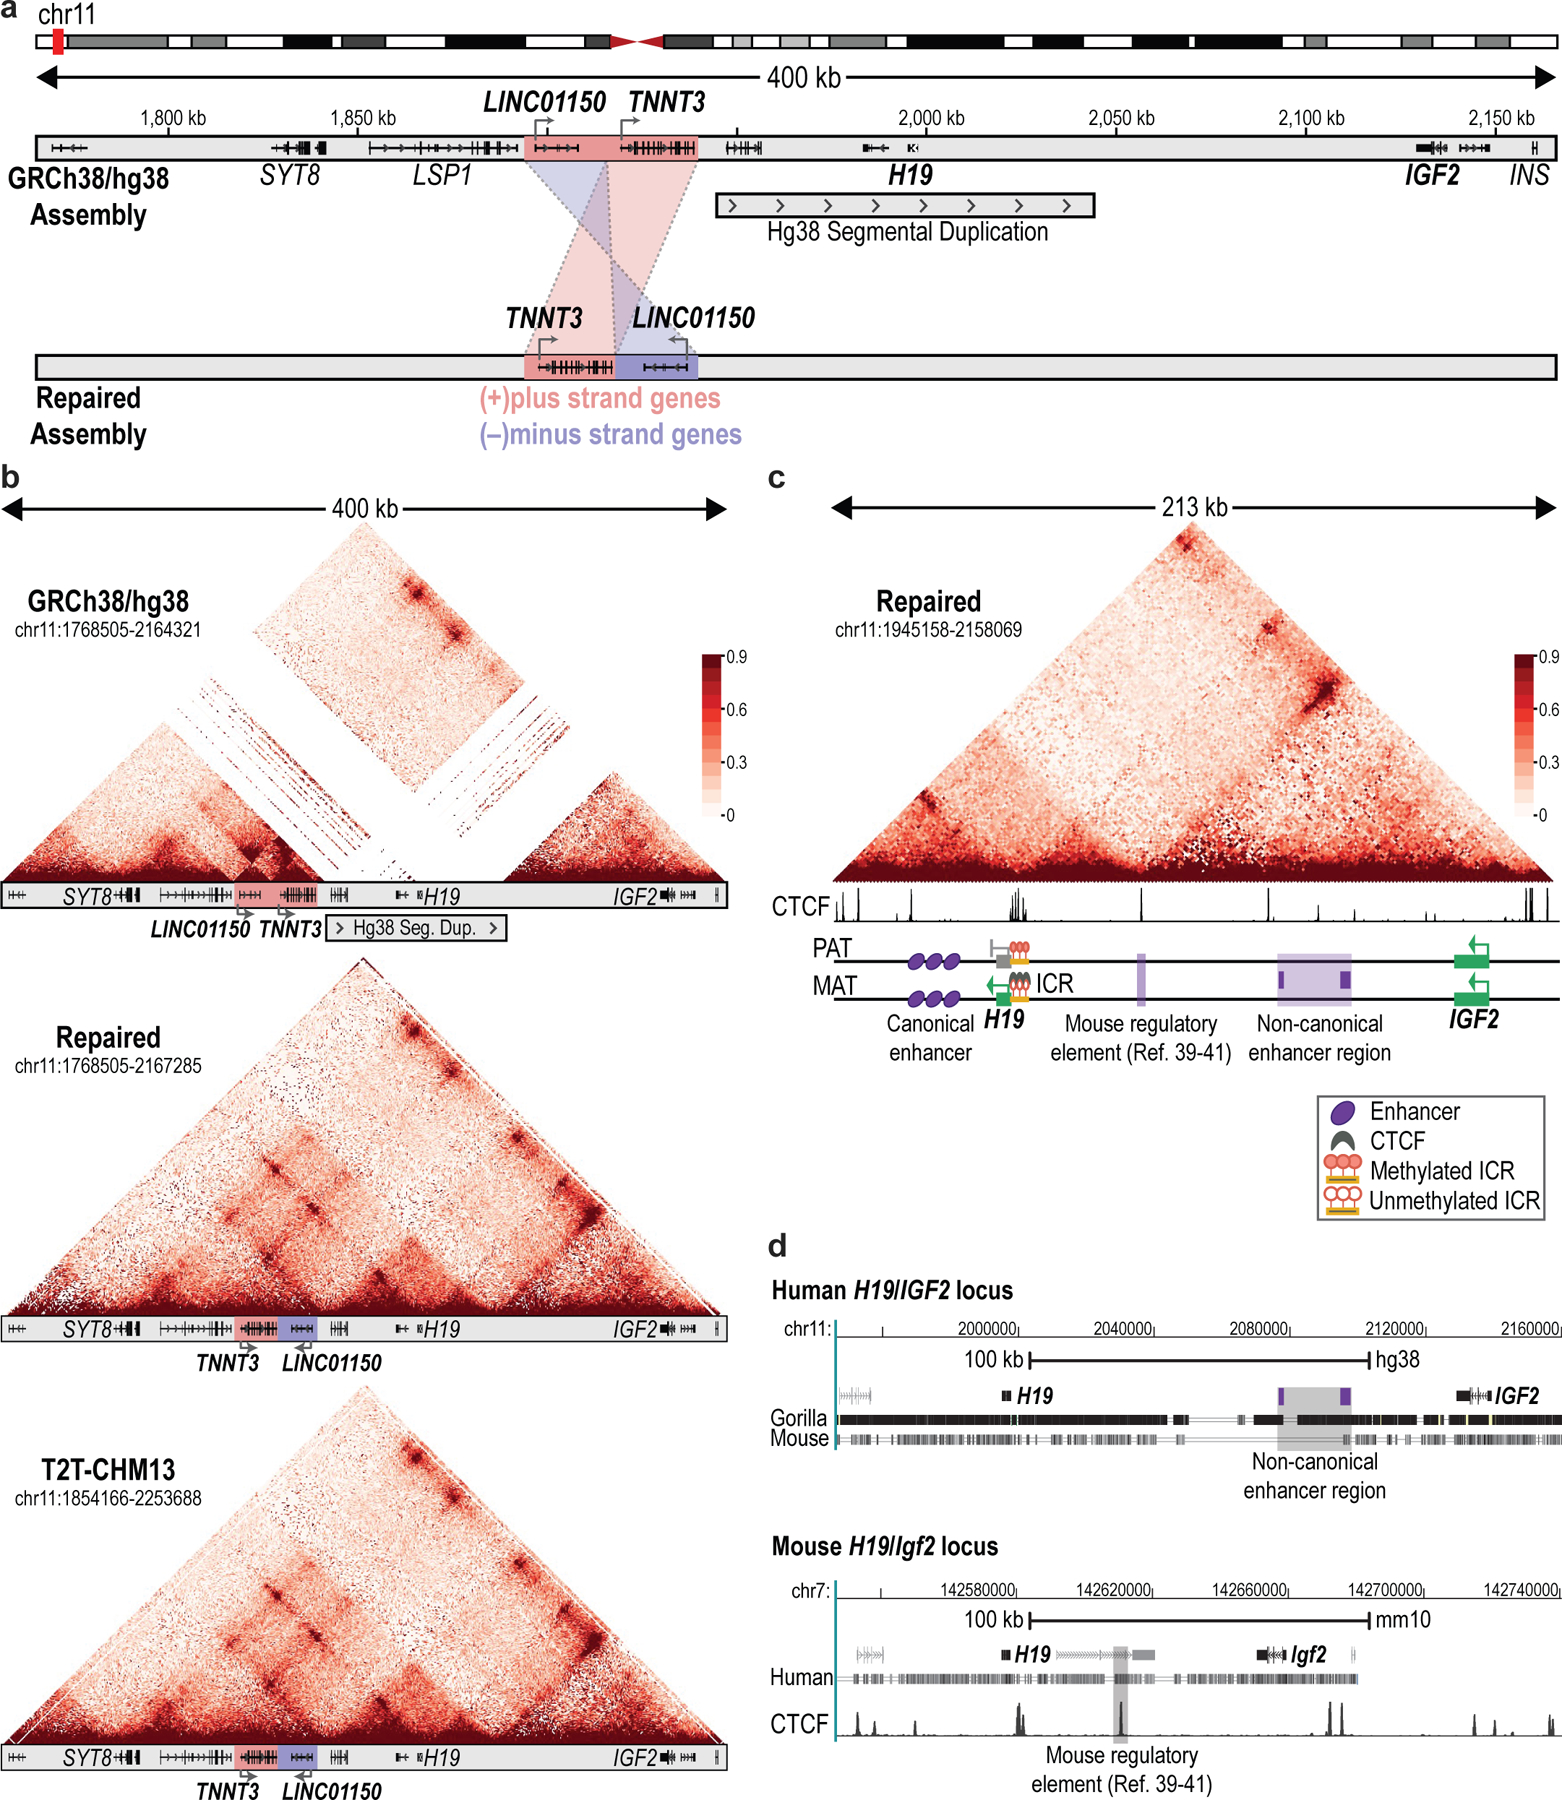
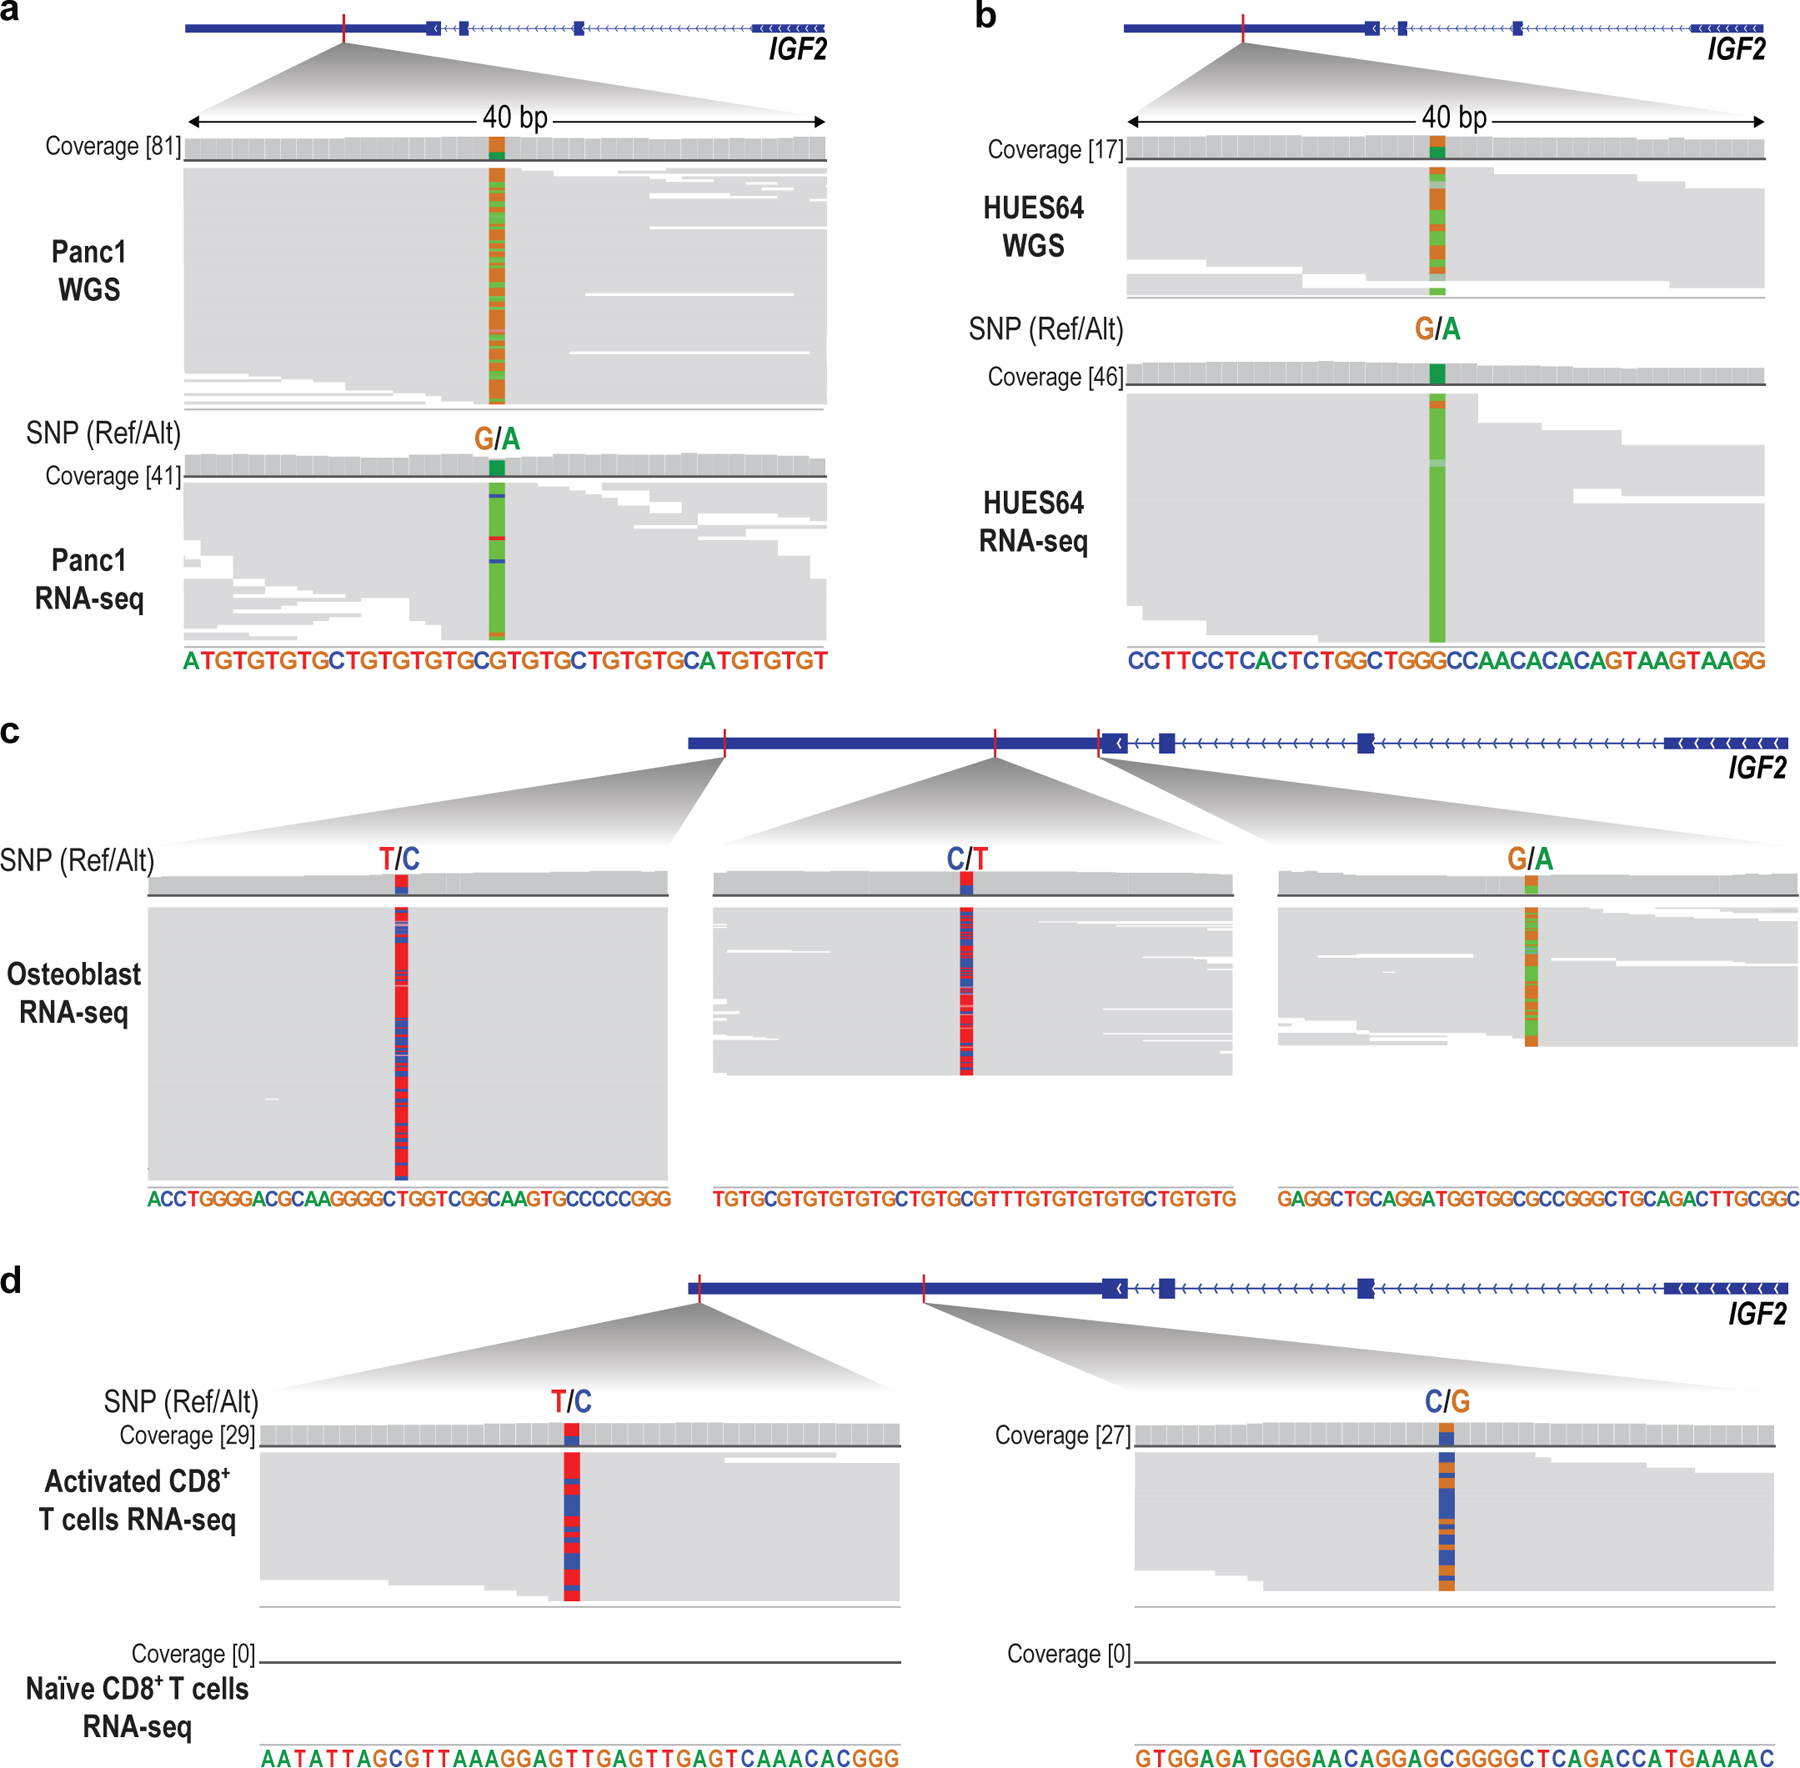
Epigenomic maps identify gene regulatory elements by their chromatin state. However, prevailing short-read sequencing methods cannot effectively distinguish alleles, evaluate the interdependence of elements in a locus or capture single-molecule dynamics. Here, we apply targeted nanopore sequencing to profile chromatin accessibility and DNA methylation on contiguous ~100-kb DNA molecules that span loci relevant to development, immunity and imprinting. We detect promoters, enhancers, insulators and transcription factor footprints on single molecules based on exogenous GpC methylation. We infer relationships among dynamic elements within immune loci, and order successive remodeling events during T cell stimulation. Finally, we phase primary sequence and regulatory elements across the H19/IGF2 locus, uncovering primate-specific features. These include a segmental duplication that stabilizes the imprinting control region and a noncanonical enhancer that drives biallelic IGF2 expression in specific contexts. Our study advances emerging strategies for phasing gene regulatory landscapes and reveals a mechanism that overrides IGF2 imprinting in human cells.


Conflict of interest statement

Competing interest

B.E.B. declares outside interests in Fulcrum Therapeutics, Arsenal Biosciences, HiFiBio, Cell Signaling Technologies and Chroma Medicine. The remaining authors declare no competing interests.

Figures

Fig. 1 |
Fig. 1 |. Phasing chromatin accessibility and DNA methylation across long single molecules.
a, Experimental overview. Accessible chromatin is marked in situ using a GpC methyltransferase (M.CviPI), as in NOMe-seq,. HMW gDNA is extracted, dephosphorylated, and incubated with a pool of Cas9/RNA complexes targeting sites that flank target loci of interest. Released fragments are adapted and directly sequenced to high coverage, thereby capturing primary sequence, endogenous CpG methylation (red diamonds) and exogenous GpC methylation (green circles) indicative of accessibility. b, 24 loci ranging from 50 to 115 kb were released and sequenced with up to 485-fold coverage enrichment and 34% full-length reads. Plots show reads sorted in ascending order by size (top), percent of full-length reads (middle), and coverage (bottom) for each locus in data acquired for resting CD4+ T cells. c, Analytical approach. Runs of GpC methylation distinguish accessible regions with potential regulatory functions (open runs), TF binding events (short-protected runs) and nucleosomal DNA (longer protected intervals) across individual DNA molecules. d, Genomic tracks for a target locus (NOD2) show CpG methylation, accessibility and TF footprints aggregated over NOMe-seq reads compared to gold-standard WGBS, DNase-seq and ChIP-seq data for GM12878. e, CpG methylation (methyl-CpG in red; unmethylated CpG in dark gray), open runs (green) and TF footprints (purple) are shown for the corresponding reads (rows, 106 reads, 72 kb in length). The correspondence between individual reads and aggregate profiles supports the accuracy of the phased single-molecule data.
Fig. 2 |
Fig. 2 |. Single-molecule promoter, enhancer and TF binding states.
a, Metaplot of open run signal in GM12878 centered at 46 transcription start sites (TSSs). Boxplots show open run distribution for 150-bp windows centered 60 bp upstream of TSSs. Boxes indicate median and first and third quartiles, whiskers and datapoints reflect outliers. FPKM <1: n = 21; FPKM <10: n = 9; FPKM <10: n = 10. b, Metaplot and boxplots show CpG methylation distribution over the same TSSs as in (a), for 150-bp windows centered 100 bp downstream of TSSs. c, Plot shows 79 (top) and 82 (bottom) reads (rows) marked with open runs (green) for the DSCR4/DSCR8 bidirectional promoter, which is silent in GM12878, but expressed in K562. Aggregate DNA methylation signal is shown below. d, Open run signal and methylation in GM12878 promoters, colored by expression state. Yellow dots notate inactive genes (CASC11, ZPBP2) that share a promoter with active genes (MYC, IKZF3). e, Metaplot of open run signal in resting CD4+ T cells for 17 TSSs that are inactive (FPKM <1) in resting cells, stratified by their expression after stimulation. f, Plot shows individual reads marked with open runs for the CDC6 locus with aggregate open run signal and DNA methylation in resting (top; 137 reads) and stimulated cells (bottom; 137 reads). Although the promoter state is unchanged, an upstream enhancer gains accessibility upon stimulation. g, Tracks show coordinate change in accessibility (green) and TF footprints (purple) for the CD47 locus in T cells at rest (0 h) and with stimulation (24 h, 48 h). ChIP-seq for IRF4 in activated cells is shown. Inset shows 330 reads for each time point (rows) marked with open runs (green) and ordered by short-protected runs (purple) that overlap IRF4 motifs. h, Metaplot shows individual reads from GM12878 centered over 30 CTCF motifs. Reads are stratified by whether the motif is bound (top; 13 sites; 1577 reads) or unbound (bottom, 17 sites; 1895 reads) per ChIP-seq. Reads are marked with open runs and sorted by short protected runs. The metaplot above shows aggregate CpG methylation. For each read, color bars (right) show CpG methylation (red), open run signal (green), and short-protected run signal (purple) averaged over a 50-bp window over the motif.
Fig. 3 |
Fig. 3 |. Dynamic chromatin remodeling events ordered by pseudotime reconstruction.
a, The CD28 locus, which flanks CTLA4 and ICOS, was captured with contiguous 78-kb NOMe-seq reads and profiled across a time course of CD4+ T-cell activation. Plot depicts a 38-kb portion of the captured locus that harbors 15 accessible elements (full target locus shown in Extended Data Fig. 6c). Open runs (green) are shown for 50 (0 h), 30 (24 h) and 34 (48 h) individual reads (rows) and for the aggregate of each timepoint (above). Correlation of the open run signal (green) in 1-kb sliding windows identified pairs of peaks with coordinated accessibility changes across the molecules (arcs). b, PCA based on open run signals of single molecules (dots) revealed a cluster of resting T cells and another containing 48 h stimulated cells. Reads from 24 h were relatively more distributed. c, PCA plot as in (b) with reads colored by cluster assignment and with a pseudotime axis determined by TSCAN. d, Plot shows 114 single molecules as in (a), but ordered by their pseudotime projection. Reads are annotated by time point (left). e, Plot depicts the accessibility of representative peaks over the pseudotime projection, illustrating their different temporal dynamics.
Fig. 4 |
Fig. 4 |. Phased epigenomic profiles deconvolve alternate H19/IGF2 alleles.
a, Schematic depicts paternal and maternal alleles of the classical imprinted locus. A canonical enhancer (purple ovals) activates the H19 non-coding RNA on the maternal chromosome (MAT) and the IGF2 growth factor gene on the paternal chromosome (PAT). The differential expression is directed by the ICR, which is bound by the CTCF insulator on the maternal allele, but methylated on the paternal allele. Active and inactive gene alleles are represented by green and grey rectangles, respectively. b, Connecting arrows highlight the positions of RNPs used to excise three overlapping regions for sequencing. NOMe-seq tracks show allele specific CpG methylation (red) and accessibility (green; open runs) in H9 ESCs and myoblasts (HSMM). ChIP-seq tracks for CTCF (ESCs) and H3K27ac (ESCs and HSMM) are also shown. In HSMM, a non-canonical enhancer (dashed box) is strongly marked by accessible chromatin on both parental alleles, and enriched for H3K27ac. c, Expanded view of the ICR shows differential methylation and accessibility on paternal and maternal alleles distinguished from long reads. Also shown are ChIP-seq tracks for CTCF and H3K27ac, LTRs (black bars) and duplicated sequences (grey bars paired by arcs). d, Expanded view shows nanopore DNA sequencing data (top) and RNA-seq data (bottom) for HSMM over a region in the last exon of IGF2 that harbors 3 heterozygous SNPs (chr11:2130822 / rs3802971; chr11:2130876 / rs57156844; chr11:2131037 / rs59196953). The nanopore data identify two SNPs specific to the maternal allele. Their presence in the RNA-seq at ~50% frequency indicates that IGF2 is expressed from both parental alleles in these primary human muscle cells. (Ref = reference; Alt = alternate).
Fig. 5 |
Fig. 5 |. A non-canonical enhancer associated with bi-allelic IGF2 expression.
A, H3K27ac ChIP-seq signal for ten human cell types is shown for the H19/IGF2 locus, highlighting canonical and non-canonical enhancer regions. Expanded view of the non-canonical enhancer (below) shows H3K27ac signal over the non-canonical enhancer region in two cell types. Genetic variants in the region associated with human traits are indicated. b, Cell and tissue types over-represented among ENCODE samples with the strongest H3K27ac signal over the non-canonical enhancer. *The activated T cells group includes biosamples from different donors, activated with cytokines or by T-cell receptor stimulation. c, H3K27ac ChIP-seq signal for resting and activated CD8+ T cells is shown for the H19/IGF2 locus. d, Bar plots show IGF2 RNA expression in cells with CRISPRi targeting the IGF2 promoter, the canonical enhancer, or the non-canonical enhancer; target site indicated by yellow bar in panel a. RT-qPCR data shown as mean ± SEM from four (AG04450) and three (HSMM) independent experiments, relative to safe harbor control. e, Heatmap shows expression of T-cell marker genes and IGF2 (rows) in GTEx whole-blood samples (columns; n = 383). Samples are ordered based on a T-cell activation score defined as the mean expressions of CD8A, CD69 and GNLY. Black lines indicate 72 samples with bi-allelic IGF2 from a total of 383 donors with heterozygous SNPs over IGF2 (Supplementary Table 3; see Methods). f, Schematic proposes a revised model for the H19/IGF2 locus. It posits that IGF2 is regulated by both a canonical and a non-canonical enhancer, with the former driving paternal IGF2 expression as classically described, and the latter driving bi-allelic IGF2 expression in certain proliferative tissues and cells. Although the non-canonical enhancer does not disrupt H19 imprinting, it could potentially influence expression levels of maternal H19.
None
None
None
None
None
None
None
None
None
None

References

    1. Baylin SB & Jones PA A decade of exploring the cancer epigenome - biological and translational implications. Nat. Rev. Cancer 11, 726–734 (2011). - PMC - PubMed
    1. Greenberg MVC & Bourc’his D The diverse roles of DNA methylation in mammalian development and disease. Nat. Rev. Mol. Cell Biol 20, 590–607 (2019). - PubMed
    1. Lappalainen T & Greally JM Associating cellular epigenetic models with human phenotypes. Nat. Rev. Genet 18, 441–451 (2017). - PubMed
    1. Cavalli G & Heard E Advances in epigenetics link genetics to the environment and disease. Nature 571, 489–499 (2019). - PubMed
    1. Klemm SL, Shipony Z & Greenleaf WJ Chromatin accessibility and the regulatory epigenome. Nat. Rev. Genet 20, 207–220 (2019). - PubMed

Methods-only references

    1. Krietenstein N et al. Ultrastructural Details of Mammalian Chromosome Architecture. Mol. Cell 78, 554–565.e7 (2020). - PMC - PubMed
    1. Johnstone SE et al. Large-Scale Topological Changes Restrain Malignant Progression in Colorectal Cancer. Cell 182, 1474–1489.e23 (2020). - PMC - PubMed
    1. Buenrostro JD, Wu B, Chang HY & Greenleaf WJ ATAC-seq: A method for assaying chromatin accessibility genome-wide. Curr. Protoc. Mol. Biol 109, 21.29.1–21.29.9 (2015). - PMC - PubMed
    1. Joung J et al. Genome-scale CRISPR-Cas9 knockout and transcriptional activation screening. Nat. Protoc 12, 828–863 (2017). - PMC - PubMed
    1. Schmiedel BJ et al. 17q21 asthma-risk variants switch CTCF binding and regulate IL-2 production by T cells. Nat. Commun 7, 13426 (2016). - PMC - PubMed

Publication types