. 2022 Oct 4;21(1):201.
doi: 10.1186/s12934-022-01930-1.

Metabolic control analysis enables rational improvement of E. coli L-tryptophan producers but methylglyoxal formation limits glycerol-based production

Affiliations

Metabolic control analysis enables rational improvement of E. coli L-tryptophan producers but methylglyoxal formation limits glycerol-based production

Kristin Schoppel et al. Microb Cell Fact. .

Abstract

Background: Although efficient L-tryptophan production using engineered Escherichia coli is established from glucose, the use of alternative carbon sources is still very limited. Through the application of glycerol as an alternate, a more sustainable substrate (by-product of biodiesel preparation), the well-studied intracellular glycolytic pathways are rerouted, resulting in the activity of different intracellular control sites and regulations, which are not fully understood in detail. Metabolic analysis was applied to well-known engineered E. coli cells with 10 genetic modifications. Cells were withdrawn from a fed-batch production process with glycerol as a carbon source, followed by metabolic control analysis (MCA). This resulted in the identification of several additional enzymes controlling the carbon flux to L-tryptophan.

Results: These controlling enzyme activities were addressed stepwise by the targeted overexpression of 4 additional enzymes (trpC, trpB, serB, aroB). Their efficacy regarding L-tryptophan productivity was evaluated under consistent fed-batch cultivation conditions. Although process comparability was impeded by process variances related to a temporal, unpredictable break-off in L-tryptophan production, process improvements of up to 28% with respect to the L-tryptophan produced were observed using the new producer strains. The intracellular effects of these targeted genetic modifications were revealed by metabolic analysis in combination with MCA and expression analysis. Furthermore, it was discovered that the E. coli cells produced the highly toxic metabolite methylglyoxal (MGO) during the fed-batch process. A closer look at the MGO production and detoxification on the metabolome, fluxome, and transcriptome level of the engineered E. coli indicated that the highly toxic metabolite plays a critical role in the production of aromatic amino acids with glycerol as a carbon source.

Conclusions: A detailed process analysis of a new L-tryptophan producer strain revealed that several of the 4 targeted genetic modifications of the E. coli L-tryptophan producer strain proved to be effective, and, for others, new engineering approaches could be derived from the results. As a starting point for further strain and process optimization, the up-regulation of MGO detoxifying enzymes and a lowering of the feeding rate during the last third of the cultivation seems reasonable.

Keywords: Escherichia coli; Glycerol; L-tryptophan; Metabolic control analysis; Methylglyoxal; Thermodynamics-based flux analysis.


Conflict of interest statement

Not applicable.

Figures

Fig. 1
Fig. 1
Final total l-tryptophan amounts (unit: g) in fed-batch cultivation processes on a 15 L scale (37 °C, pH 7.0, DO  > 30% air saturation) with E. coli strains (relevant genotype variations to the reference strain NT1259 are indicated: (NT1259), NT1259 trpCmt (NT1405), NT1259 trpBA (NT1438), NT1259 trpBA trpCmt (NT1439), NT1259 trpBA trpCmt aroB (NT1445), NT1259 trpBA trpCmt serB (NT1444), NT1259 trpBA trpCmt aroB serB (NT1446). All strains carried the plasmid pF112aroFBLKan. Error bars without caps refer to standard deviations of different samples; error bars with caps represent the deviations of three technical replicates (E. coli NT1259 and E. coli NT1446). Level of significance*: 0.01 < p < 0.05
Fig. 2
Fig. 2
Fed-batch production of l-tryptophan with E. coli NT1446 pF112aroFBLKan on a 15 L scale (37 °C, pH 7.0, DO > 30% air saturation). A: Concentrations (unit: g L−1) of cell dry weight (CDW), L-tryptophan (l-trp) and acetate. B: Oxygen content in exhaust air (unit: %) and methylglyoxal concentration (unit: mg L.−1). Vertical solid black lines indicate (i) the end of the batch phase (9.83 h) and (ii) the beginning of the constant feeding phase/addition of IPTG (43.9 h). The dotted red line marks the process time for cell sampling for the parallel metabolic perturbation studies (47.9 h)
Fig. 3
Fig. 3
Gene expression (without units, relative to ftsZ control) of genes serB, aroF, aroB, trpC, trpCmt and trpB relative to ftsZ gene of samples from reference L-tryptophan production process after 27 h (R 27 h), 43 h (R 43 h), 50 h (R 50 h), 55 h (R 55 h) and 70 h (R 70 h) process time (IPTG for the induction of inducible genes was added 44 h after inoculation. The samples were taken from the production process with NT1446 pF112aroFBLKan (NT1446) and likewise with NT1259 shiACg pF112aroFBLKan (NT1259 shiA) [43]. Sample timepoints for NT1259 shiACg pF112aroFBLKan were the same with maximum deviations of 1.5 h. Results for NT1259 shiACg pF112aroFBLKan have been already published in [43]
Fig. 4
Fig. 4
Extracellular uptake and formation rates (unit: mmol gCDW−1 h−1) of substrates, products, and respiration during parallelized short-term metabolic analysis of E. coli NT1446 pF112aroFBLKan producing l-tryptophan. Perturbation was achieved by three-stage feeding profiles containing each glycerol, glucose, pyruvate, and succinate. Respiration rates: oxygen uptake (OUR) and CO2 production (CPR); biomass specific substrate uptake rates of glycerol (GLYC), glucose (GLUC), pyruvate (PYR) and succinate (SUC) and biomass-specific production rates of l-tryptophan (l-trp) are depicted. Numbers 1–3: metabolic steady-state conditions, resulting from a corresponding three-stage feeding profile. Ref: Extracellular rates in the 15 L fed-batch reference process during metabolic analysis time
Fig. 5
Fig. 5
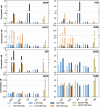
Intracellular concentrations (unit: mM) of dihydroxyacetone-phosphate (DHAP), pyruvate (PYR), o-Phospho-l-serine (pser_L), 3-dehydroshikimate (3DHS), shikimate 3-phosphate (S3P), chorismate (CHOR), anthranilate (ANTH), and 1-(2-carboxyphenylamino)-1-deoxy-d-ribulose 5-phosphate (CDRP) during parallelised short-term perturbation experiments in stirred-tank bioreactors with the carbon sources glycerol (GLYC), glucose (GLUC), pyruvate (PYR) and succinate (SUC). Numbers 1–3 (NT1446): steady-state conditions corresponding to three-stage feeding levels during metabolic analysis with E. coli NT1446 pF112aroFBLKan. Ref (NT1446): intracellular concentrations in the reference fed-batch process with E. coli NT1446 during metabolic analysis. Numbers 1–3 (NT1259 shiA): steady-state conditions corresponding to three-stage feeding levels during metabolic analysis with the former strain E. coli NT1259 shiACg pF112aroFBLKan, published in [43]. Ref (NT1259 shiA): Intracellular concentrations in the reference fed-batch process with the former strain E. coli NT1259 shiACg pF112aroFBLKan during metabolic analysis, published in [43]
Fig. 6
Fig. 6
Mean flux control coefficients (unitless) estimated by metabolic control analysis of l-tryptophan production with E. coli NT1446 pF112aroFBLKan. Columns represent enzyme activities, and lines refer to metabolic fluxes. The X-axis describes enzyme capacity; corresponding metabolic fluxes are represented on the Y-axis. The effects of changes in enzyme activity by one percent are illustrated (positive value: enhanced metabolic flux; negative value: reduced metabolic flux)
Fig. 7
Fig. 7
Selection of mean flux control coefficients (unitless) estimated by metabolic control analysis of E. coli NT1446 pF112aroFBLKan (NT1446) and NT1259 shiACg pF112aroFBLKan (NT1259 shiA) during l-tryptophan production depicted for the enzymes phosphoserine phosphatase (psp_L), phosphoribosylpyrophosphate synthetase (prpps), indole-glycerolphosphate synthase (igps), tryptophan synthase (trps2), 3-deoxy-arabino-7-phosphoheptulosonate synthase (dahpts), 3-dehydroquinate synthase (dhqs), 3-phosphoshikimate 1-carboxyvinyltransferase (pscvt) and chorismate synthase (chors). Metabolic fluxes of chorismate and l-tryptophan biosynthesis are represented on the Y-axes. The effects of changes in enzyme activity by one percent are illustrated (positive value: enhanced metabolic flux; negative value: reduced metabolic flux). Results for NT1259 shiACg pF112aroFBLKan were previously published in [43]
Fig. 8
Fig. 8
Schematic representation of the main methylglyoxal formation and degradation pathway in Escherichia coli [51] A and RT-qPCR analysis of relative gene expression (without unit) of genes mgsA (B), gloA, gloB, gloC, yeiG, dld (C), yajL, and yhbO (D) relative to ftsZ gene of samples from the reference l-tryptophan production process with NT1446 pF112aroFBLKan after process times of 27 h (R 27 h), 43 h (R 43 h), 50 h (R 50 h), 55 h (R 55 h), and 70 h (R 70 h). IPTG for the induction of inducible genes was added 44 h after inoculation

References

    1. Weiner M, Tröndle J, Albermann C, Sprenger GA, Weuster-Botz D. Perturbation experiments: approaches for metabolic pathway analysis. Adv Biochem Eng Biotechnol. 2015;152:91–136. - PubMed
    1. Weiner M, Tröndle J, Albermann C, Sprenger GA, Weuster-Botz D. Metabolic control analysis of l-phenylalanine production from glycerol with engineered E. coli using data from short-term steady-state perturbation experiments. Biochem Eng J. 2017;126:86–100. doi: 10.1016/j.bej.2017.06.016. - DOI
    1. Nasution U, van Gulik WM, Ras C, Proell A, Heijnen JJ. A metabolome study of the steady-state relation between central metabolism, amino acid biosynthesis and penicillin production in Penicillium chrysogenum. Metab Eng. 2008;10(1):10–23. doi: 10.1016/j.ymben.2007.07.001. - DOI - PubMed
    1. Link H, Anselment B, Weuster-Botz D. Rapid media transition: an experimental approach for steady state analysis of metabolic pathways. Biotechnol Prog. 2010;26(1):1–10. - PubMed
    1. Oldiges M, Takors R. Applying metabolic profiling techniques for stimulus-response experiments: chances and pitfalls. Berlin: Springer; 2005. pp. 173–96. - PubMed