. 2022 Oct 4;53(1):77.
doi: 10.1186/s13567-022-01094-1.

Modelling the effects of antimicrobial metaphylaxis and pen size on bovine respiratory disease in high and low risk fattening cattle

Affiliations

Modelling the effects of antimicrobial metaphylaxis and pen size on bovine respiratory disease in high and low risk fattening cattle

Sébastien Picault et al. Vet Res. .

Abstract

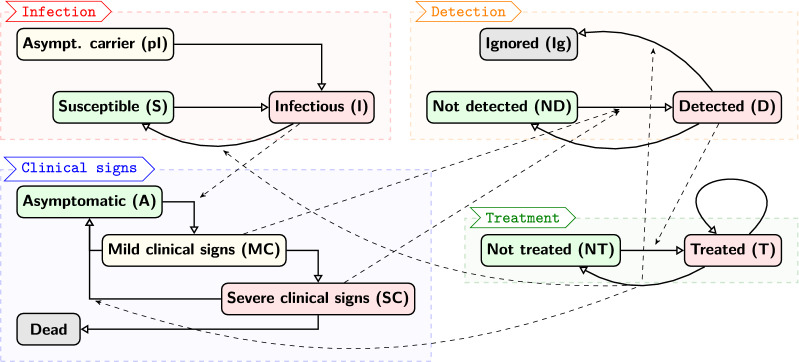
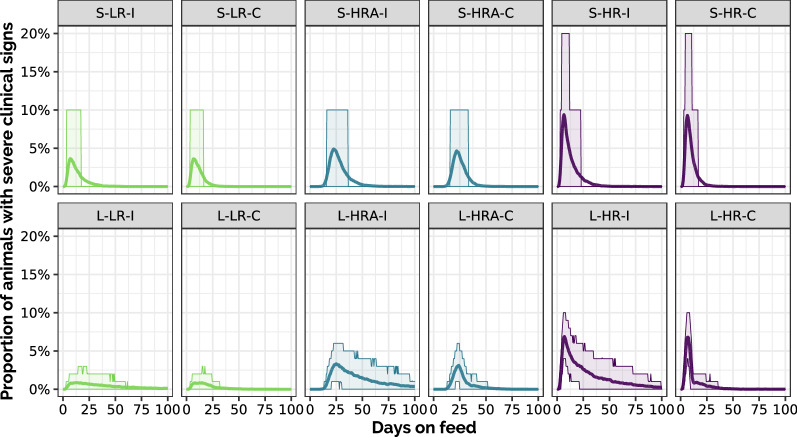
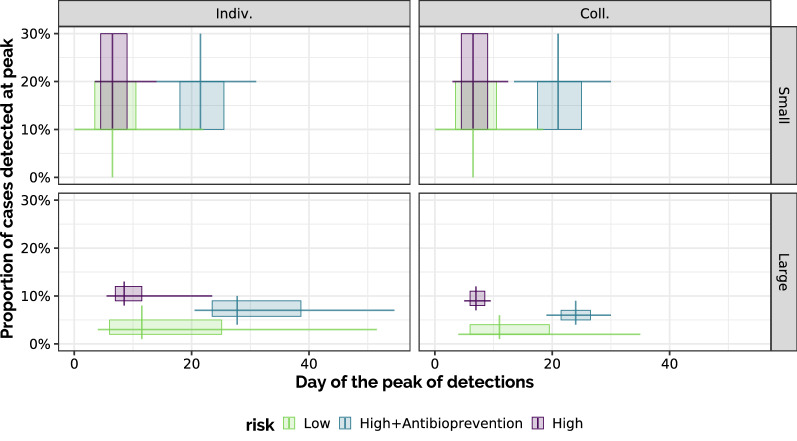
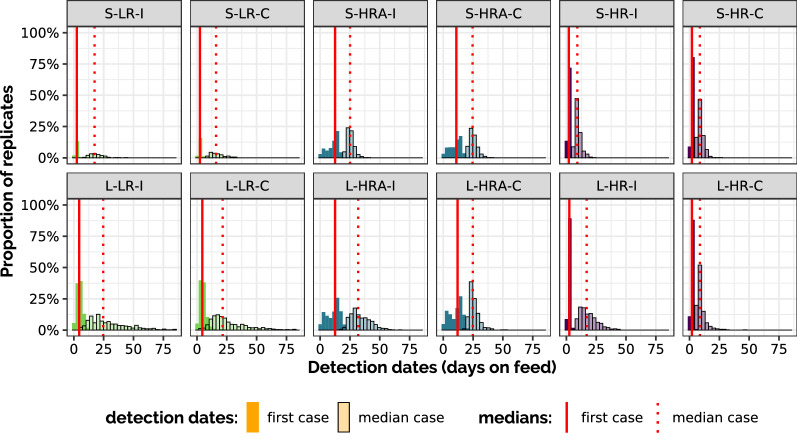
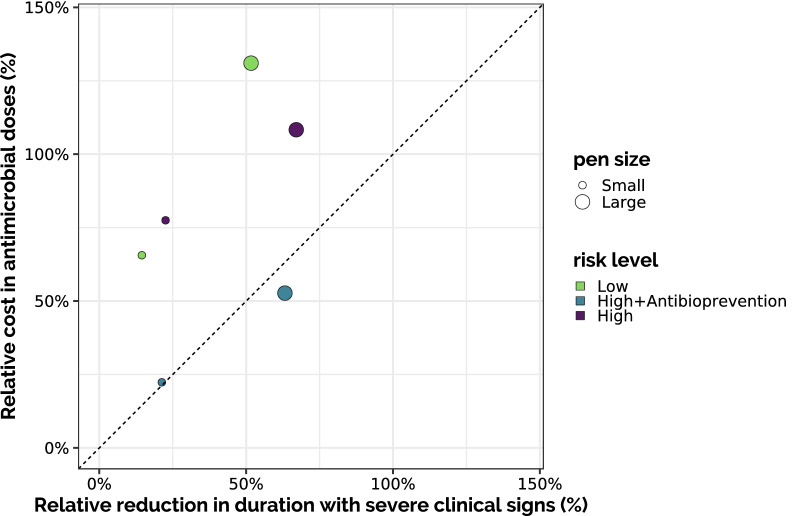
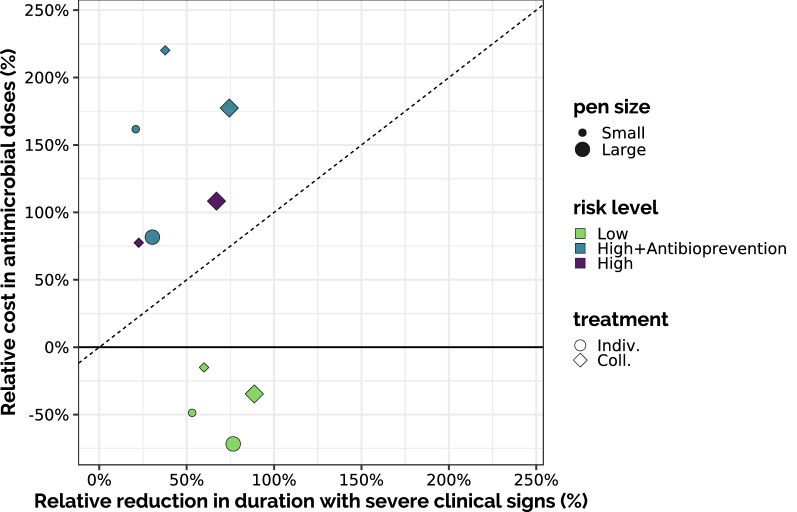
Bovine respiratory disease (BRD) dramatically affects young calves, especially in fattening facilities, and is difficult to understand, anticipate and control due to the multiplicity of factors involved in the onset and impact of this disease. In this study we aimed to compare the impact of farming practices on BRD severity and on antimicrobial usage. We designed a stochastic individual-based mechanistic BRD model which incorporates not only the infectious process, but also clinical signs, detection methods and treatment protocols. We investigated twelve contrasted scenarios which reflect farming practices in various fattening systems, based on pen sizes, risk level, and individual treatment vs. collective treatment (metaphylaxis) before or during fattening. We calibrated model parameters from existing observation data or literature and compared scenario outputs regarding disease dynamics, severity and mortality. The comparison of the trade-off between cumulative BRD duration and number of antimicrobial doses highlighted the added value of risk reduction at pen formation even in small pens, and acknowledges the interest of collective treatments for high-risk pens, with a better efficacy of treatments triggered during fattening based on the number of detected cases.

Keywords: Epidemiological modelling; antimicrobial usage; bovine respiratory disease; disease control; farming practices; stochastic models.


Conflict of interest statement

The authors declare that they have no competing interests.

Figures

Figure 1
Figure 1
Overview of the mechanistic BRD model. The model incorporated four processes (infection, clinical signs, detection, treatment) associated to individual states (rounded boxes), which could evolve by themselves (plain arrows) but also influenced each other (dashed arrows). For instance, animals becoming infectious (I) also started expressing mild clinical signs (MC), which could evolve towards severe clinical signs (SC). Both could be detected (D), which led to a first treatment (T) that could be repeated. When the treatment was successful, it made the animal return to susceptible (S) and asymptomatic (A) states. If successive treatments failed, it was stopped and the animal was no longer considered for further treatments, thus markes as “ignored” (Ig).
Figure 2
Figure 2
Temporal dynamics of the occurrence of severe clinical signs. Proportion of animals with severe clinical signs over time in each scenario: mean value (line) and 10th–90th percentiles (ribbon) calculated on 500 stochastic replicates for large pens, 5000 for small pens. First row: small-pen scenarios (S), second row: large-pen scenarios (L); green: low risk (LR), blue: high risk with antibioprevention (HRA), purple: high risk (HR); for each color: individual treatment only (I) on the left, with collective treatment enabled during fattening (C) on the right.
Figure 3
Figure 3
Dates and amplitudes of detection peaks. Each detection peak is characterised by the maximum number (y-axis) of animals detected over time in a stochastic replicate and by the date at which this maximum was reached (x-axis). Boxes extend from 1st to 3rd quartiles in each axis, lines are positioned at the median and extend from 10 to 90th percentiles. 500 (resp. 5000) stochastic replicates were conducted in large-pen (resp. small-pen, first row) scenarios (second row). First column: individual treatment only (I); second column: with collective treatment enabled during fattening (C).
Figure 4
Figure 4
Distributions of detection dates. Histogram representing how the dates of first detection (“first case”, dark) and the median date of detection in each stochastic replicate (“median case”, light) are distributed over the set of stochastic replications. Vertical red lines represent the medians of the first (solid line) and median (dashed line) detection dates over the set of stochastic repetitions. First row: small-pen scenarios (S), second row: large-pen scenarios (L); green: low risk (LR), blue: high risk with antibioprevention (HRA), purple: high risk (HR); for each color: individual treatment only (I) on the left, with collective treatment enabled during fattening (C) on the right.
Figure 5
Figure 5
Proportion of detections in each clinical state. Distribution (boxplots) and average values (red dots) of the proportion of animals with mild clinical states (respectively, with severe clinical signs and asymptomatic) that were detected (aggregated over all scenarios).
Figure 6
Figure 6
Mortality. Distribution of the number of dead animals cumulated over 100 days per 100 animals (vertical red line: mean) in the 12 scenarios (calculated on 500 stochastic replicates for large-pen scenarios, 5000 replicates aggregated 10 by 10 for small-pen scenarios). First row: small-pen scenarios (S), second row: large-pen scenarios (L); green: low risk (LR), blue: high risk with antibioprevention (HRA), purple: high risk (HR); for each color: individual treatment only (I) on the left, with collective treatment enabled during fattening (C) on the right.
Figure 7
Figure 7
Antimicrobial usage vs. disease duration per 100 animals. Total amount of antibiotics doses required in each scenario to fatten 100 young beef bulls for 100 days, compared to the cumulative duration of severe clinical signs. Boxes extend from 1st to 3rd quartiles in each axis, lines are positioned at the median and extend from 10 to 90th percentiles. First row: small-pen scenarios (S); second row: large-pen scenarios (L). First column: individual treatment only (I); second column: with collective treatment enabled during fattening (C).
Figure 8
Figure 8
Impact of collective treatment. Each point represents the relative average additional consumption of antibiotics doses and relative average reduction in the cumulate disease duration when allowing collective treatment during fattening, compared to the same scenario with individual treatment only. The bisector (dashed line) represents theoretical situations when gaining X% of disease duration would require an additional X% of antimicrobial doses: for points above this line, the relative cost in antimicrobials induced by the collective treatment was higher than the relative gain in disease duration.
Figure 9
Figure 9
Comparisons with the high-risk scenario with individual treatment only. Each point represents, for a given pen size, the relative average additional consumption of antibiotics doses and relative average reduction in the cumulate disease duration for each scenario, compared to the scenario with high risk level and individual treatment only (for the same pen size). The bisector (dashed line) represents theoretical situations when gaining X% of disease duration would require an additional X% of antimicrobial doses.
Figure 10
Figure 10
Sensitivity analysis for 6 scenarios. In both small (S) and large (L) pens, we considered the following scenarios: low risk (LR) or high risk with antibioprevention (HRA) with individual treatment only (I), vs high risk (HR) with collective treatment (C). For each scenario, we display the contribution (total sensitivity index calculated by an ANOVA, see Equation 4) of each parameter (one per line) to the variation of target outputs (one per column) when this contribution was over 5%. This contribution was made positive or negative depending on the sign of the correlation between parameter and output variations. For each output (i.e. for each column), the numeric values represent the effect of the most impactful parameter (on the corresponding line) and the sum of all contributions (part of the variations that is explained by the parameters chosen in the sensitivity analysis). Grey columns correspond to outputs that either were not relevant in the corresponding scenario (proportion of collective treatments in the individual-treatment scenarios) or could not be analysed because their distribution was not normal.

References

    1. Assié S, Seegers H, Makoschey B, Désiré-Bousquié L, Bareille N. Exposure to pathogens and incidence of respiratory disease in young bulls on their arrival at fattening operations in France. Vet Rec. 2009;165:195–199. doi: 10.1136/vr.165.7.195. - DOI - PubMed
    1. Grissett GP, White BJ, Larson RL. Structured literature review of responses of cattle to viral and bacterial pathogens causing bovine respiratory disease complex. J Vet Intern Med. 2015;29:770–780. doi: 10.1111/jvim.12597. - DOI - PMC - PubMed
    1. Kudirkiene E, Aagaard AK, Schmidt LMB, Pansri P, Krogh KM, Olsen JE. Occurrence of major and minor pathogens in calves diagnosed with bovine respiratory disease. Vet Microbiol. 2021;259:109135. doi: 10.1016/j.vetmic.2021.109135. - DOI - PubMed
    1. Babcock AH, White BJ, Dritz SS, Thomson DU, Renter DG. Feedlot health and performance effects associated with the timing of respiratory disease treatment. J Anim Sci. 2009;87:314–327. doi: 10.2527/jas.2008-1201. - DOI - PubMed
    1. Lechtenberg KF (2019) Bovine respiratory disease modeling. In: Proceedings of the fifty-second annual conference. American Association of Bovine Practitioners. American Association of Bovine Practitioners Proceedings of the Annual Conference, St Louis, Missouri, pp 89–92

MeSH terms

Substances

LinkOut - more resources