

Using machine learning in prediction of ICU admission, mortality, and length of stay in the early stage of admission of COVID-19 patients
- PMID: 36196268
- PMCID: PMC9521862
- DOI: 10.1007/s10479-022-04984-x
Using machine learning in prediction of ICU admission, mortality, and length of stay in the early stage of admission of COVID-19 patients
Abstract
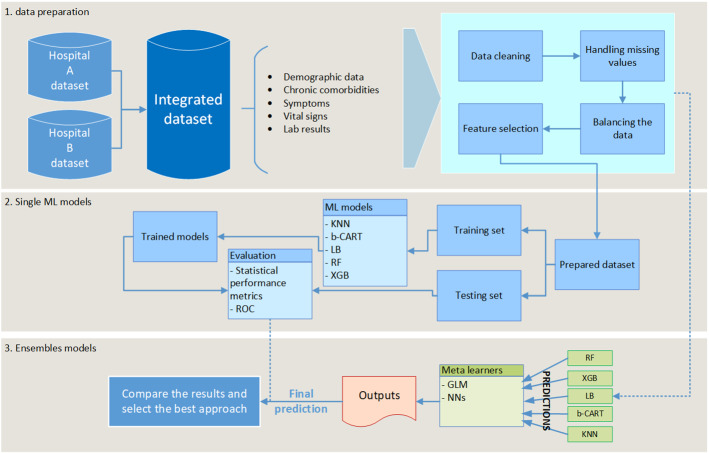
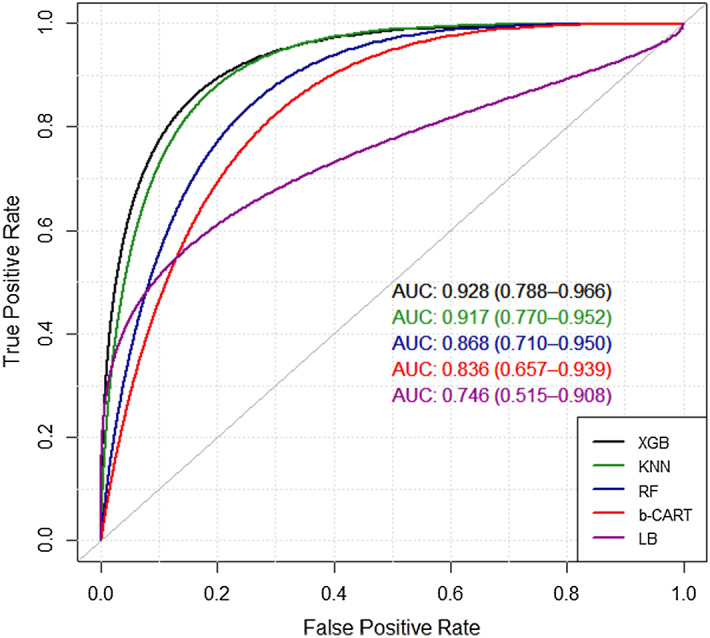
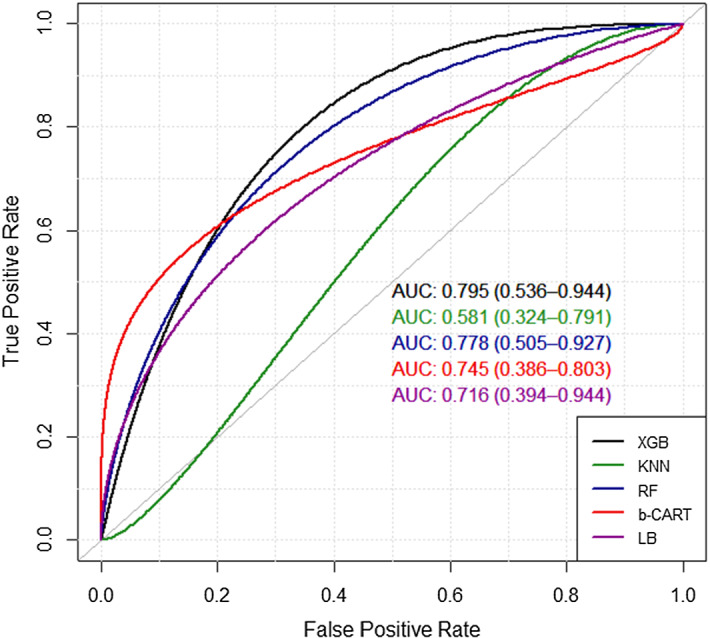
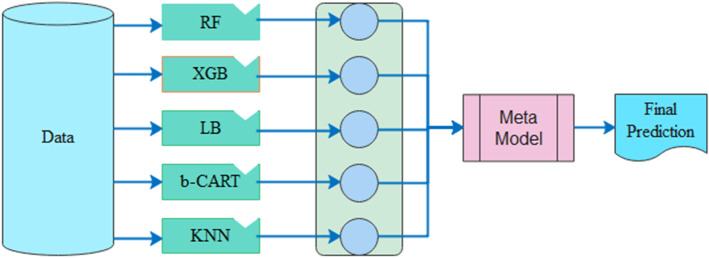
The recent COVID-19 pandemic has affected health systems across the world. Especially, Intensive Care Units (ICUs) have played a pivotal role in the treatment of critically-ill patients. At the same time however, the increasing number of admissions due to the vast prevalence of the virus have caused several problems for ICU wards such as overburdening of staff and shortages of medical resources. These issues might have affected the quality of healthcare services provided directly impacting a patient's survival. The objective of this research is to leverage Machine Learning (ML) on hospital data in order to support hospital managers and practitioners with the treatment of COVID-19 patients. This is accomplished by providing more detailed inference about a patient's likelihood of ICU admission, mortality and in case of hospitalization the length of stay (LOS). In this pursuit, the outcome variables are in three separate models predicted by five different ML algorithms: eXtreme Gradient Boosting (XGB), K-Nearest Neighbor (KNN), Random Forest (RF), bagged-CART (b-CART), and LogitBoost (LB). With the exception of KNN, the studied models show good predictive capabilities when evaluating relevant accuracy scores, such as area under the curve. By implementing an ensemble stacking approach (either a Neural Net or a General Linear Model) on top of the aforementioned ML algorithms the performance is further boosted. Ultimately, for the prediction of admission to the ICU, the ensemble stacking via a Neural Net achieved the best result with an accuracy of over 95%. For mortality at the ICU, the vanilla XGB performed slightly better (1% difference with the meta-model). To predict large length of stays both ensemble stacking approaches yield comparable results. Besides it direct implications for managing COVID-19 patients, the approach presented serves as an example how data can be employed in future pandemics or crises.
Keywords: COVID-19 pandemic; Ensemble modeling; ML in health systems; Supervised learning.
© The Author(s), under exclusive licence to Springer Science+Business Media, LLC, part of Springer Nature 2022, Springer Nature or its licensor holds exclusive rights to this article under a publishing agreement with the author(s) or other rightsholder(s); author self-archiving of the accepted manuscript version of this article is solely governed by the terms of such publishing agreement and applicable law.
Conflict of interest statement
Conflict of interestsThe authors declare that they have no conflict of interest.
Figures
Similar articles
-
Disease-Course Adapting Machine Learning Prognostication Models in Elderly Patients Critically Ill With COVID-19: Multicenter Cohort Study With External Validation.JMIR Med Inform. 2022 Mar 31;10(3):e32949. doi: 10.2196/32949. JMIR Med Inform. 2022. PMID: 35099394 Free PMC article.
-
[Constructing a predictive model for the death risk of patients with septic shock based on supervised machine learning algorithms].Zhonghua Wei Zhong Bing Ji Jiu Yi Xue. 2024 Apr;36(4):345-352. doi: 10.3760/cma.j.cn121430-20230930-00832. Zhonghua Wei Zhong Bing Ji Jiu Yi Xue. 2024. PMID: 38813626 Chinese.
-
Hospital Length of Stay and 30-Day Mortality Prediction in Stroke: A Machine Learning Analysis of 17,000 ICU Admissions in Brazil.Neurocrit Care. 2022 Aug;37(Suppl 2):313-321. doi: 10.1007/s12028-022-01486-3. Epub 2022 Apr 6. Neurocrit Care. 2022. PMID: 35381967
-
Machine learning model for predicting the length of stay in the intensive care unit for Covid-19 patients in the eastern province of Saudi Arabia.Inform Med Unlocked. 2022;30:100937. doi: 10.1016/j.imu.2022.100937. Epub 2022 Apr 14. Inform Med Unlocked. 2022. PMID: 35441086 Free PMC article.
-
Artificial intelligence in clinical care amidst COVID-19 pandemic: A systematic review.Comput Struct Biotechnol J. 2021;19:2833-2850. doi: 10.1016/j.csbj.2021.05.010. Epub 2021 May 7. Comput Struct Biotechnol J. 2021. PMID: 34025952 Free PMC article. Review.
Cited by
-
A comparative study of neuro-fuzzy and neural network models in predicting length of stay in university hospital.BMC Health Serv Res. 2025 Mar 27;25(1):446. doi: 10.1186/s12913-025-12623-x. BMC Health Serv Res. 2025. PMID: 40148882 Free PMC article.
-
Predictors of Medical and Dental Clinic Closure by Machine Learning Methods: Cross-Sectional Study Using Empirical Data.J Med Internet Res. 2024 Aug 30;26:e46608. doi: 10.2196/46608. J Med Internet Res. 2024. PMID: 39213534 Free PMC article.
-
PSO-XnB: a proposed model for predicting hospital stay of CAD patients.Front Artif Intell. 2024 May 3;7:1381430. doi: 10.3389/frai.2024.1381430. eCollection 2024. Front Artif Intell. 2024. PMID: 38765633 Free PMC article.
-
Analyzing COVID-19 progression with Markov multistage models: insights from a Korean cohort.Genomics Inform. 2025 Jan 27;23(1):2. doi: 10.1186/s44342-024-00035-y. Genomics Inform. 2025. PMID: 39891219 Free PMC article.
-
We Need to Talk About Lung Ultrasound Score: Prediction of Intensive Care Unit Admission with Machine Learning.J Imaging. 2025 Feb 7;11(2):45. doi: 10.3390/jimaging11020045. J Imaging. 2025. PMID: 39997547 Free PMC article.
References
-
- Alazzam I, Alsmadi I, Akour M. Software fault proneness prediction: A comparative study between bagging, boosting, and stacking ensemble and base learner methods. International Journal of Data Analysis Techniques and Strategies. 2017;9(1):1. doi: 10.1504/IJDATS.2017.10003991. - DOI
-
- Alinaghian M, Goli A. Location, allocation and routing of temporary health centers in rural areas in crisis, solved by improved harmony search algorithm. International Journal of Computational Intelligence Systems. 2017;10(1):894. doi: 10.2991/ijcis.2017.10.1.60. - DOI
LinkOut - more resources
Full Text Sources